
Photo by Bozhin Karaivanov on Unsplash
The short version
- A daily-rebalanced 2x ETF surrenders roughly one annualized variance to compounding each year — about 2.9 percentage points at S&P 500 volatility levels — before any fee or financing cost is paid.
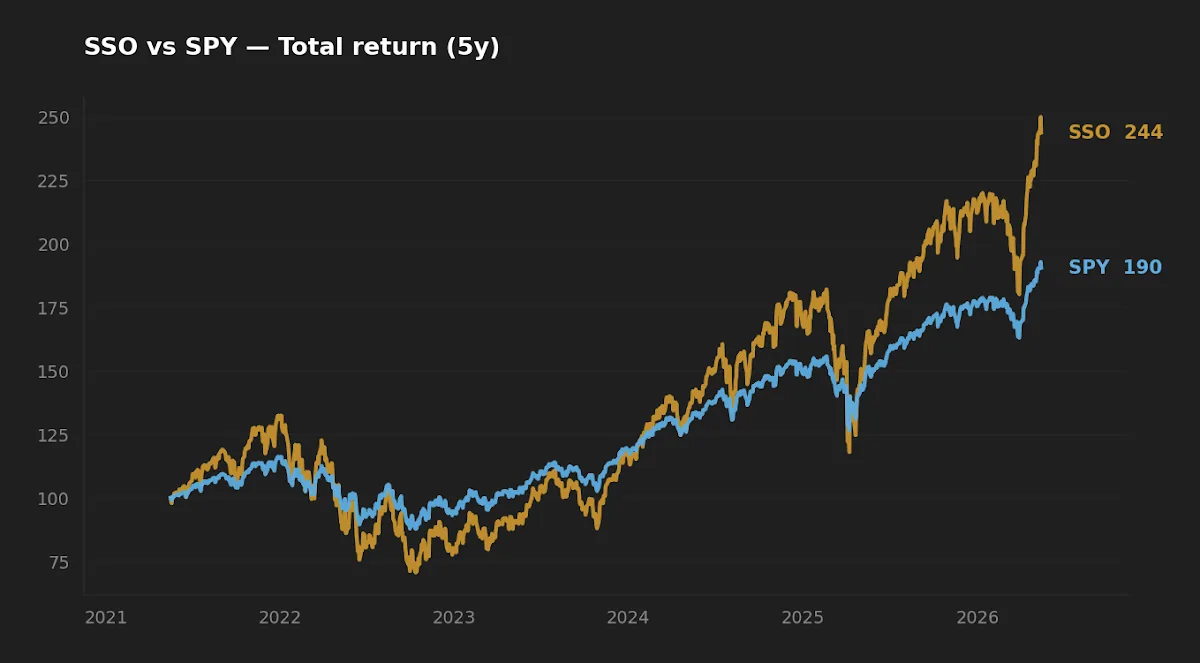
- Over the past five years SSO compounded at 19.6% annualized versus SPY's 13.8%. Naive doubling would suggest 27.6%; the missing 8 points are variance drag, expense ratio, and financing.
- Leveraged daily-reset ETFs are tactical instruments with a quadratic risk profile. They are not a hidden lever a long-term buy-and-hold investor can quietly pull.
A reader who sees SSO's "2x S&P 500" label and SPY's 13.8% five-year CAGR might reasonably expect SSO to have compounded somewhere near 27.6%. The realized number is 19.6%. The eight-point gap is not poor fund management or a defective product; it is the predictable arithmetic of compounding daily-leveraged returns through a volatile market. Variance drag is unsentimental enough to deserve its own article, and unsentimental enough that no fund operator can fee it away.
What SSO and SPY actually are
SPY is the SPDR S&P 500 ETF Trust, the original 1x physically replicated index fund and the most heavily traded equity ETF in the world. SSO is ProShares Ultra S&P 500, a daily-rebalanced 2x exposure to the same underlying universe. The two share an index but differ in one engineering choice: SSO promises 2x the index's return each trading day, then resets its leverage at the close. Over any holding period longer than a single session, the path of returns — not just the start and end prices — determines what compounding does to that promise.
That distinction is the entire subject. It is also the part of the prospectus that most retail buyers skim past.
The numbers, side by side
| Metric | SSO | SPY |
|---|---|---|
| Issuer | ProShares | State Street SPDR |
| Expense ratio | 0.87% | 0.1% |
| AUM | $7.3B | $735.1B |
| Inception | 2006-06-19 | 1993-01-22 |
| Distribution yield | 0.7% | 1.0% |
| 5Y CAGR | 19.6% | 13.8% |
| 10Y CAGR | 24.2% | 15.5% |
| 5Y annualized volatility | 33.7% | 17.1% |
| 5Y max drawdown | −46.7% | −24.5% |
Expense ratio and AUM verified against the ProShares SSO fact sheet and the SPDR SPY fact sheet; performance and risk fields are computed from yfinance daily total-return series through 2026-05-15.
The math of variance drag
Take a single daily return r on the S&P 500. SSO targets 2r for that day. Over n days, your dollar grows by the product of (1 + 2rt) terms. The relevant identity, derived from a Taylor expansion of the log return, is approximately:
gL ≈ L · g1 − ½ · L · (L − 1) · σ12
where g1 is the geometric (compounded) return of the underlying, σ1 is its volatility, and L is the daily leverage factor. For L = 2, the second term collapses to a clean σ12. Plug in SPY's realized five-year volatility of 17.1%, and the variance drag works out to roughly 2.9% per year — before fees, before borrow costs, before any operational slippage.
That is the mechanical floor. Add SSO's 0.87% expense ratio and the embedded financing cost on the levered notional — at a fed funds rate of 3.64% (FRED, asof 2026-04-01) plus a typical swap spread, call it 3.5%–4% on the additional 1x of exposure — and the expected gap between SSO and a frictionless 2x of SPY widens to roughly 7–8 percentage points annually. The realized 5Y gap, 27.6% − 19.6% = 8.0%, lands almost exactly where the formula predicts. There is no mystery in the data; the surprise is that it surprises anyone.
The right intuition is that variance drag scales quadratically with L. A 3x fund at the same 17% underlying vol bleeds roughly 3 · 2 · σ²/2 = 8.7% per year to drag alone. The math is built into the product. The deeper exploration of why this is so often misunderstood is covered in our piece on the compounding truth of leveraged ETFs.
What the five-year empirical record actually shows
The realized data does not say SSO "lost" to SPY over this window — it compounded at 19.6% versus SPY's 13.8%, a 5.8-point annualized win. But framing that as a vindication of leverage misreads the result. Two facts have to sit together:
- The 2021–2026 window contains one credit-driven drawdown (2022) and a long, fundamentally upward-trending regime in 2023–2025. That regime is friendly to daily-reset leverage, because variance drag is smaller in trending markets than in choppy ones for any given level of realized volatility. The decay-myth piece works through why this is true.
- The realized return still fell roughly 8 points short of naive 2x. A reader who held SSO believing they were earning double SPY's compounded return is reconciling, after the fact, with a number meaningfully below that expectation.
Both can be true. The product worked as designed. The expectation many holders had was not what the product was designed to deliver.
Variance drag is not a bug in fund management; it is a feature of resetting leverage daily, and its cost scales quadratically with the leverage factor. No fee waiver removes it.
Drawdown asymmetry and realized risk
The variance term is the slow tax. The drawdown is the fast one. Over the trailing five years, SSO posted a peak-to-trough drawdown of 46.7% against SPY's 24.5% — a ratio of 1.91, slightly under the naive 2x. The realized annualized volatility ratio is 33.7% / 17.1% = 1.97, almost exactly 2x. The fund is doing what it says.
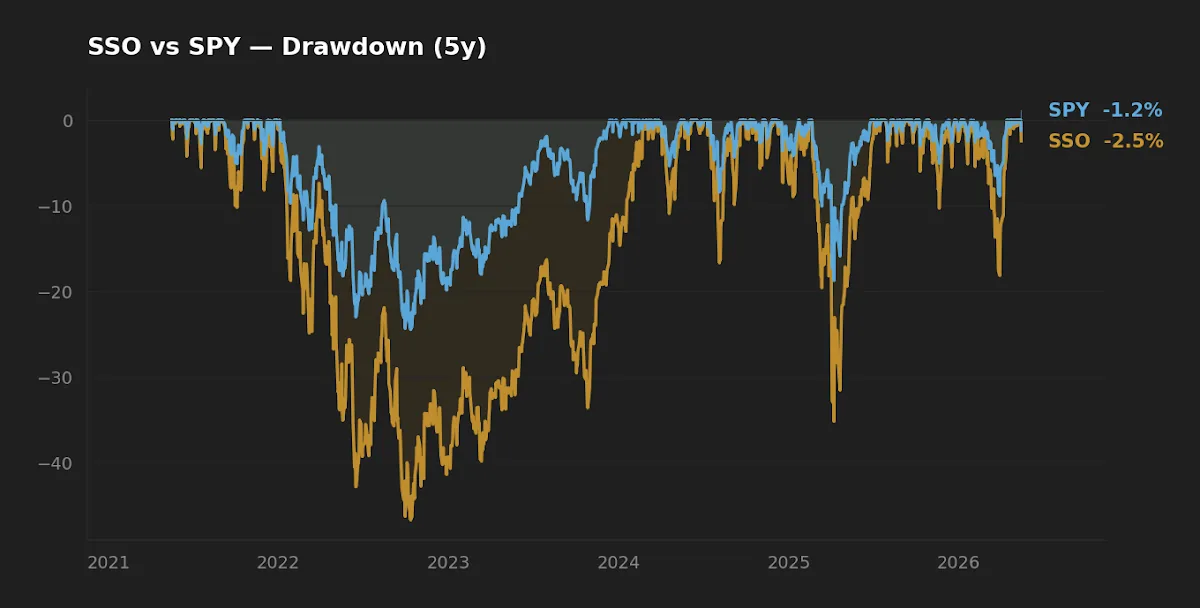
The non-obvious part of this is recovery time, not depth. A 46.7% drawdown requires an 87.6% recovery to regain the prior high. SPY's 24.5% drawdown required a 32.5% recovery. Even setting variance drag aside, the asymmetry of percentage gains and losses penalizes deep-drawdown vehicles more than first-order arithmetic suggests. A sequence of losses in 2022 followed by gains in 2023 does not net out to zero in a 2x fund the way it nearly does in a 1x fund. The capital-preservation argument applies with particular force here.
Financing costs and the rate regime
The 2x exposure inside SSO is financed, typically through total-return swaps. The dealer providing that swap charges a rate close to short-term funding plus a spread. With the fed funds rate at 3.64% (FRED, asof 2026-04-01) versus an average closer to 0.4% across the 2020–2022 portion of the lookback, the financing component of the drag is materially higher today than during the bulk of the historical window in our table. A reader anchoring on the 5Y or 10Y CAGR as a forward expectation is implicitly assuming the prior rate regime continues — which, with 10Y Treasuries at 4.47% and a still-positive real fed funds rate, is not a free assumption.
The mechanics of how rising rates erode leveraged ETF returns are worked through in detail in this earlier piece on borrowing costs. The short version: roughly each additional percentage point of short-term financing translates approximately linearly into the leveraged fund's net return, on top of whatever the underlying does.
At-a-glance scoreboard
| Category | Winner | Margin |
|---|---|---|
| Cost (expense + financing) | SPY | Large — 77 bp ER gap plus embedded swap costs |
| Realized 5Y CAGR | SSO | Material — 5.8 pp/yr in a friendly regime |
| Realized risk (vol & drawdown) | SPY | Roughly half on both axes |
| Suitability for long-horizon core | SPY | Strong — leverage is a tactical sleeve, not a core holding |
| Capacity, liquidity, tax treatment | SPY | 100x AUM, tighter spreads, simpler distributions |
FAQ
Q1. If SSO outperformed SPY over five years, why is variance drag a concern?
Because the outperformance was less than the leverage factor would predict. Realized 19.6% versus an idealized 27.6% means roughly 8 percentage points per year were lost to drag, fees, and financing. In a higher-volatility or sideways regime, the realized gap can flip negative — the same SSO/SPY pair lost to a 1x position from late 2007 through early 2013 by a wide margin.
Q2. Does variance drag apply only to leveraged ETFs?
The drag term L(L−1)σ²/2 is zero when L = 1, so it does not affect unlevered funds. For L = 2 it equals one variance; for L = 3, three variances. Inverse funds (L = −1) have a positive drag of one variance, which is one reason short ETFs decay even when the underlying chops sideways.
Q3. Can long-horizon investors use SSO as a "core with a tilt"?
The honest answer is: only with a written rule for when leverage is added and removed, a tolerance for ~50% drawdowns, and an understanding that financing costs are now meaningfully higher than during the recent backtest window. Our piece comparing leveraged and normal ETFs for long-term investors develops the conditions where it can be defensible.
Q4. How does the 5Y CAGR compare against the 10Y?
SSO's 10Y CAGR is 24.2% versus SPY's 15.5%. The ratio is 1.56x, again below the naive 2x. The longer window includes the rate-cut era from 2016–2020, when financing was nearly free, which is a major reason the leveraged track record looks favorable. Forward expectations should not assume those financing conditions return.
Q5. Is the daily-reset feature unique to ProShares?
No. Direxion, iShares, and other issuers offer similar products with the same daily-reset mechanism. The math is identical. The choice between issuers is largely about expense ratio, swap counterparty quality, and liquidity, not the underlying compounding behavior.
What this comparison can and can't tell you
This article rests on a single five-year window. That window includes one drawdown (2022) and a long upward trend; it does not include a 2008-style credit shock or a 2000–2002-style multi-year drawdown, either of which would test SSO under conditions closer to the worst-case outcomes of daily-reset leverage. The 10Y CAGR helps but is dominated by the 2016–2020 zero-rate era, which is not the rate regime we are in now. Treat the realized gap between the 19.6% and the naive 27.6% as a clean illustration of the formula — not as a forecast for the next five years.
Scenarios where each fund fits
- Long-term core position, retirement account, 20+ year horizon: SPY (or any low-cost S&P 500 index ETF). The 0.0945% expense ratio, predictable compounding, and absence of variance drag make it a defensible default.
- Tactical sleeve, written entry/exit rules, drawdown budget set in advance: SSO may be defensible at a small allocation (typically <10% of portfolio) for an investor who has explicitly modeled the variance and financing costs.
- Investor seeking "higher expected return" without changing horizon or risk tolerance: Neither leverage on equities nor any other product solves this. The cleanest expected-return increase is usually a higher equity allocation, not levered exposure on a smaller base.
- Investor in their 50s within a decade of drawing income: SSO is structurally a poor fit. The path dependency of daily-reset leverage interacts badly with shortened recovery windows.
Editor's read
If forced to choose between SSO and SPY for any role inside a long-horizon portfolio, the editor's view is that SPY is the only one that earns its seat. SSO is not a defective product — it is precisely engineered for one-day leveraged exposure. The mismatch is between what it is engineered to do and what most retail buyers seem to think they are buying. For a tactical investor with explicit rules, SSO is a tool; for a buy-and-hold investor compounding over decades, it is a tax on volatility paid every year in exchange for an asymmetric drawdown profile, and the trade is rarely worth it.
Editor's holdings disclosure: The editor holds broad-market S&P 500 index exposure equivalent to SPY; the editor does not hold SSO or any daily-reset leveraged ETF.
Methodology
Performance and risk metrics computed from yfinance daily total-return series for SSO and SPY, with the data pull dated 2026-05-16 and the analysis window running through the trading session of 2026-05-15. CAGR is annualized geometric return; volatility is the annualized standard deviation of daily log returns; max drawdown is the largest peak-to-trough decline in the cumulative total-return series. Expense ratio and AUM reflect the issuer fact sheets (ProShares for SSO, State Street SPDR for SPY). Macro reference points sourced from FRED (10Y Treasury, fed funds rate, CPI YoY, VIX), with as-of dates noted inline.
Key takeaways
- Variance drag is mechanical, not a fund-management failure. At S&P 500 volatility levels, a 2x daily-reset ETF surrenders roughly 2.9 percentage points per year before any other cost.
- The realized 8-point gap between SSO's 5Y CAGR and naive 2x of SPY is fully explained by variance drag plus expense ratio plus financing — the math predicts the outcome.
- Drawdown asymmetry compounds the case against leverage as a core position: a 46.7% loss requires an 87.6% gain to recover, not a 46.7% gain.
- Higher short rates in 2026 make the historical 10Y CAGR a poor anchor for forward expectations on leveraged ETFs; financing costs are materially higher than during much of the lookback.
- The compounded value of evidence-based discipline in a 1x core compares favorably to the compounded cost of variance drag in a 2x sleeve over realistic long-horizon paths.
This article is for educational purposes and does not constitute personalized financial advice. See Disclaimer for full terms.
— by the Mulden editor