
Photo by Dynamic Wang on Unsplash
The short version
- VOO and VTI share the same large-cap core, the same 0.03% fee, and a return history that has tracked within roughly a percentage point a year — so "which is better" is rarely the decision that matters.
- The question worth measuring is overlap: how much of a second fund is genuinely new exposure, and whether the new part earns its place in a specific regime.
- Bottom line: pick one as the core; the real value of this comparison is a repeatable method for deciding when two funds are redundant.
"VOO or VTI?" is one of the most-searched index-fund matchups, and it is usually the wrong question. The two funds cost the same, are run by the same issuer, and have delivered returns close enough that the gap fits inside a single year of fees rounding error. The decision that actually changes a portfolio is not which one — it is whether holding a second broad U.S. equity fund adds exposure you do not already own. That is a measurement problem, and it has a method.
This article uses VOO and VTI as a worked example of that method: how to quantify overlap, how to read the small slice where the two funds differ, and how to decide whether that slice deserves a line in your portfolio. The framework generalizes to any pair of broad funds you are tempted to hold together.
Context: what each fund actually owns
Vanguard's S&P 500 ETF (VOO) tracks the S&P 500 — roughly the 500 largest U.S. companies, weighted by market capitalization. Vanguard's Total Stock Market ETF (VTI) tracks the CRSP US Total Market Index, which holds those same large caps and then extends down into the mid-, small-, and micro-cap tail, for several thousand names in total. Because both are capitalization-weighted, the largest companies dominate each fund's weight. The S&P 500 constituents that VOO holds also make up the large majority of VTI's weight — the thousands of additional VTI names sit in the long, lightly weighted tail.
That construction detail is the whole story. VTI is not "VOO plus a different strategy." It is VOO plus a diluted small- and mid-cap extension. Whether that extension matters depends entirely on how much weight it carries and how those smaller companies behave in a given regime.
The data
| Metric | VOO | VTI |
|---|---|---|
| Name | Vanguard S&P 500 ETF | Vanguard Total Stock Market ETF |
| Expense ratio | 0.03% | 0.03% |
| AUM | $1,701.5B | $2,308.9B |
| Dividend yield | 1.0% | 1.0% |
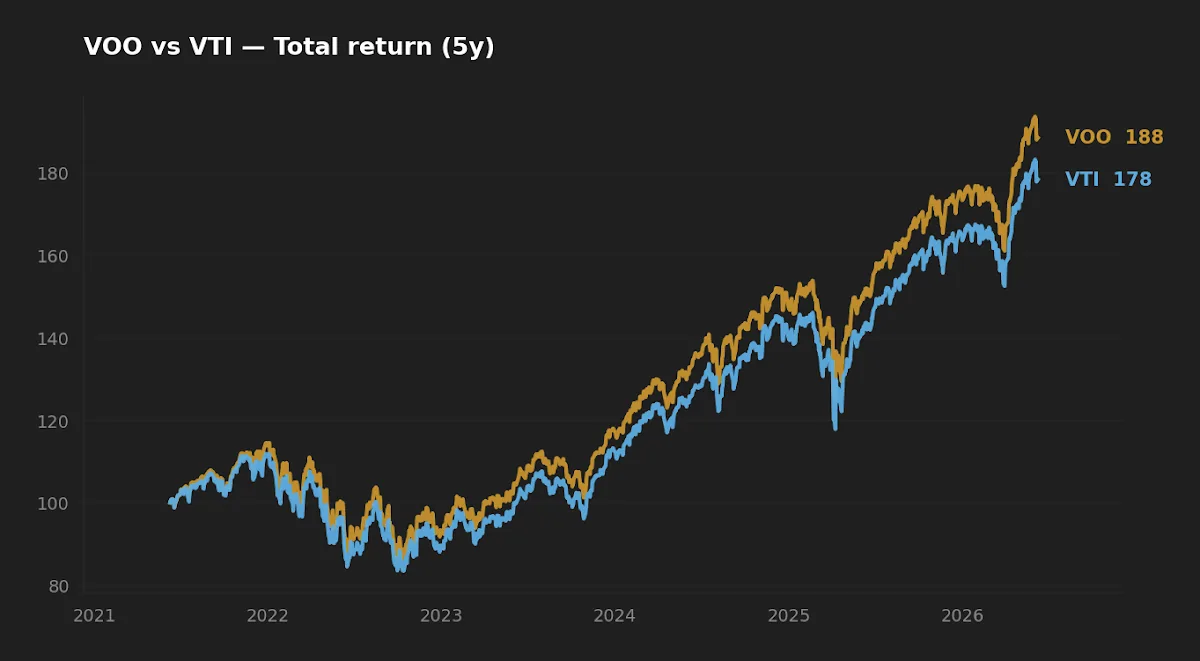
| 5Y CAGR | 13.6% | 12.3% |
| 10Y CAGR | 15.3% | 14.8% |
| 5Y volatility (annualized) | 16.8% | 17.4% |
| 5Y max drawdown | -24.5% | -25.4% |
Expense ratio and AUM are from the Vanguard fact sheets (VOO, VTI); price, return, volatility, and drawdown figures are computed from yfinance daily data pulled 2026-06-08. Yields are trailing and rounded to one decimal.
Measuring overlap instead of arguing preference
There are three ways to quantify how much two funds duplicate each other, and they answer different questions.
Holdings-weight overlap is the most useful. It asks: of every dollar in fund A, how many cents sit in companies that fund B also holds, at similar weight? For VOO and VTI this is high — the shared large caps carry the large majority of VTI's weight, so most of a VTI dollar is, functionally, a VOO dollar. Holdings-count overlap is the most misleading: VTI holds thousands of names VOO does not, which sounds like meaningful diversification until you notice those names carry tiny weights. Counting holdings flatters the difference; weighting them deflates it. Return correlation and tracking difference close the loop: over the trailing five years the two funds moved almost identically, with VTI lagging by about 1.3 percentage points annualized (12.3% vs 13.6%). That gap is not noise — it is the small-cap extension underperforming in a higher-rate environment.
The practical rule: if weight overlap is high and return correlation is near one, a second fund is mostly redundant regardless of how many extra tickers it lists. Holding both VOO and VTI is close to holding one fund at 1.0x and calling it 2.0x.
Counting holdings flatters the difference between two funds; weighting them by what they actually own usually erases it.
Realized risk: the extension shows up in the drawdown
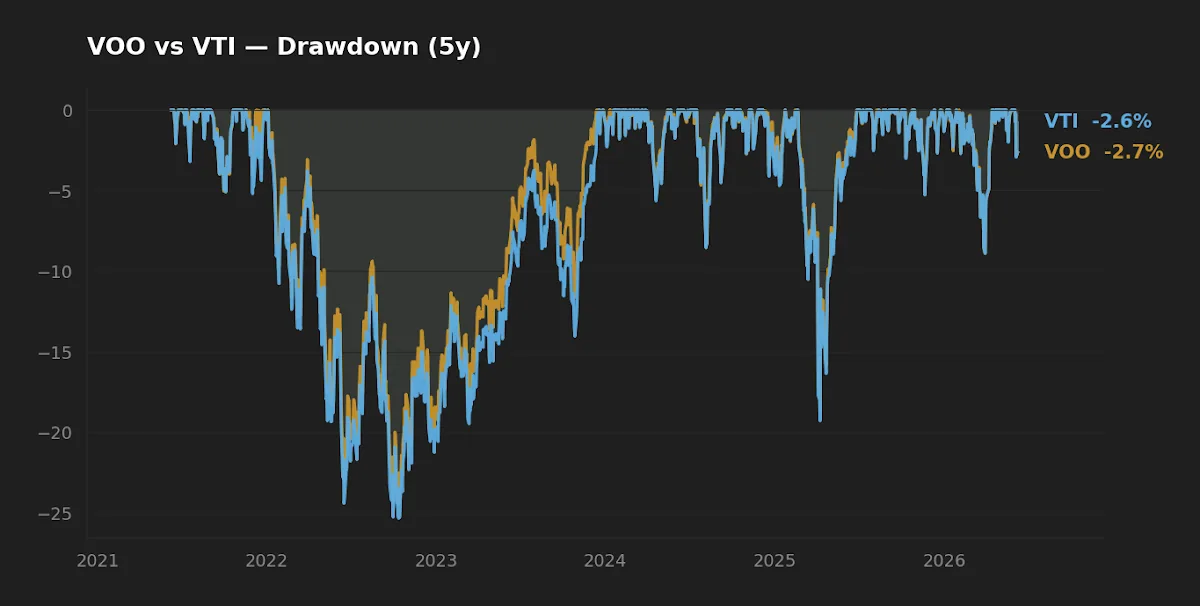
The risk numbers tell the same story from the other side. VTI's 5-year annualized volatility (17.4%) ran slightly above VOO's (16.8%), and its worst drawdown over the window (-25.4%) was modestly deeper than VOO's (-24.5%). Small and mid caps are more cyclical and more rate-sensitive, so the extension adds a little volatility and a little drawdown without, over this particular window, adding return. With the federal funds rate at 3.63% (FRED, asof 2026-05-01) and CPI still running near 3.9% year over year (FRED, asof 2026-04-01), the post-2022 regime has not been kind to the smaller-cap tail — which is exactly where VTI differs from VOO.
This is the honest limit of the comparison: five years is one regime. There have been long stretches — the early 2000s, parts of the 2010s recovery — when small and mid caps led, and in those windows VTI's extension would have added return rather than subtracted it. The data shows what happened, not what must happen.
The non-obvious cost: holding both complicates, it does not diversify
The second-order effect most "VOO vs VTI" pieces miss is what happens if you try to own both. Because the funds track different indices, they are arguably not "substantially identical" for wash-sale purposes — which tempts investors to pair them for tax-loss harvesting. But their return correlation is so high that pairing them does almost nothing for diversification, while creating a portfolio where two large positions move in lockstep and rebalancing between them is meaningless. You get the bookkeeping of two funds and the exposure of one. If you want a genuinely different return stream to harvest into or to diversify with, the answer is a different exposure entirely — a small-cap value tilt, international, or factor sleeve — not a near-clone of what you already hold. We have written separately about thinking in roles before tickers and about why a long-term core spans distinct exposures rather than redundant ones.
| Category | Edge | Why |
|---|---|---|
| Cost | Tie | Both 0.03%; no fee gap to compound. |
| Realized risk (5Y) | VOO | Lower volatility and shallower drawdown. |
| Realized return (5Y) | VOO | 13.6% vs 12.3% CAGR — but regime-dependent. |
| Breadth / completeness | VTI | Owns the full investable U.S. market in one line. |
| Suitability as sole core | Tie | Either works; the choice is philosophical, not financial. |
FAQ
Is it pointless to own both VOO and VTI? Largely, yes. Their weight overlap and return correlation are high enough that the combination behaves almost like a single fund. You take on two positions' worth of tracking and tax bookkeeping for one position's worth of exposure.
Does VTI's small-cap tail give real diversification? A little, but less than the holdings count suggests. The thousands of extra names carry small weights, so they add some cyclicality and a modest risk premium in the right regime — not a different return engine.
Why did VOO outperform VTI over five years if VTI owns more? Because the "more" — smaller-cap companies — underperformed large caps in a higher-rate environment. Owning more of the market only helps when the extra part is winning.
Are VOO and VTI "substantially identical" for wash-sale rules? They track different indices, so they are generally treated as not substantially identical — but their correlation is so high that pairing them for tax-loss harvesting buys you little genuine diversification. This is a description of how the funds behave, not tax advice; confirm specifics with a qualified professional.
Which should a first-time index investor pick? Either is defensible as a single core holding. VTI is the cleaner "own the whole market" choice; VOO is the cleaner large-cap benchmark. The decision matters far less than picking one and contributing consistently, a point we make in our VOO vs QQQM comparison.
What this comparison can and can't tell you
It can tell you that, over the trailing five and ten years, VOO and VTI delivered nearly the same outcome with VOO modestly ahead, at identical cost. It cannot tell you which leads next decade — the 5Y return gap is the product of a single rate regime, and the small-cap extension that lagged here has led in other windows. There is no stress test beyond the realized 2021–2026 drawdown, no factor decomposition here, and no accounting for an individual investor's existing holdings, where the overlap question is ultimately decided.
Scenarios where each fits
A reader in their 30s building a first portfolio, 401(k)-only, wanting one line that owns everything: VTI does that cleanly. A reader who already holds a separate small-cap or extended-market sleeve and wants a pure large-cap benchmark to pair with it: VOO avoids double-counting the small-cap tail. A reader currently holding both and wondering whether to consolidate: the overlap analysis says you are not getting two distinct exposures — collapsing to one and redeploying the freed allocation into a genuinely different role is worth considering.
Editor's read
If the goal is a single U.S. equity core, the editor leans VTI on principle — owning the whole investable market in one line, at the same 0.03% fee, is the more complete default, and the realized 1.3 pp gap is a regime artifact rather than a structural edge. But the stronger conclusion is the framework one: before adding any second broad fund, measure weight overlap and return correlation. If they are high, you are duplicating, not diversifying, and the better use of that allocation is an exposure you do not already own.
Holdings disclosure: the editor holds VOO as part of a long-term core; does not hold VTI at the time of writing.
Key takeaways
- VOO and VTI share the same fee (0.03%) and most of their weight; the decision between them is minor.
- Measure overlap by weight and return correlation, not by holdings count — counting names overstates the difference.
- VTI's small-cap extension added a little volatility and drawdown but no return over the 5Y window, in a higher-rate regime.
- Holding both duplicates exposure rather than diversifying it; a freed allocation is better spent on a genuinely different role.
- Five years is one regime — the realized return gap is not a forecast.
Methodology: expense ratio, AUM, and yield from Vanguard issuer fact sheets; price, return, volatility, and drawdown computed from yfinance daily data pulled 2026-06-08; macro figures from FRED (fed funds asof 2026-05-01, CPI asof 2026-04-01). Window analyzed: trailing 5 and 10 years through June 2026.
This article is for educational purposes and does not constitute personalized financial advice. See our full Disclaimer.