Photo by Annie Spratt on Unsplash
The short version
- SMH and SOXX both track US-listed semiconductor equity, but SMH runs a far more concentrated book — the return gap over five years is mostly a concentration story, not a cost story.
- Fees are effectively identical (0.35% vs 0.34%), so the decision rests on how much single-name exposure a holder is willing to accept inside one ticker.
- Bottom line: SMH suits an investor who wants the cap-weighted leaders undiluted; SOXX suits one who wants the sector with the edges sanded off.
Two semiconductor ETFs, nearly identical fees, nearly identical five-year drawdowns — and a five-percentage-point annualized return gap. The interesting question is not which one "won" the last five years, but why the gap exists and whether the reason is durable or an artifact of one regime.
This is a comparison of the VanEck Semiconductor ETF (SMH) and the iShares Semiconductor ETF (SOXX). Both give a long-term holder concentrated exposure to a single, cyclical, capital-intensive industry. They are not interchangeable, and the difference is structural rather than cosmetic.
Context: same sector, two different design choices
Semiconductors sit at the center of the current capital-spending cycle — data-center buildout, AI accelerators, and the foundries that fabricate them. A sector ETF lets a holder express that view without picking a single chipmaker. But "the semiconductor sector" is not one thing inside these wrappers.
SMH tracks the MVIS US Listed Semiconductor 25 Index — a deliberately narrow, modified-cap-weighted basket of roughly 25 of the largest semiconductor and semiconductor-equipment names. SOXX tracks the ICE Semiconductor Index (it migrated from the older PHLX SOX index family in 2021) and holds a wider roster, historically around 30 names, with weighting rules that pull capital away from the very top of the cap distribution. The headline consequence: SMH lets its largest positions run; SOXX trims them. For readers approaching the AI build-out from the infrastructure side rather than the chip side, the utilities-and-grid angle on AI infrastructure covers an adjacent, less-concentrated exposure.
The data
| Metric | SMH (VanEck) | SOXX (iShares) |
|---|---|---|
| Fund name | VanEck Semiconductor ETF | iShares Semiconductor ETF |
| Expense ratio | 0.35% | 0.34% |
| AUM | $67.8B | $38.4B |
| Inception | 2011-12-20 | 2001-07-10 |
| Distribution yield | 0.2% | 0.3% |
| 5Y CAGR | 37.6% | 32.7% |
| 10Y CAGR | 36.8% | 34.8% |
| 5Y annualized volatility | 35.3% | 36.5% |
| 5Y max drawdown | −45.3% | −45.8% |
Price and return figures are from yfinance, pulled 2026-06-08; expense ratio, AUM, and index methodology are from issuer fact sheets (VanEck SMH and iShares SOXX). CAGR is computed on total-return price series over the trailing windows ending at the pull date; volatility is annualized from daily returns; max drawdown is the deepest peak-to-trough over the five-year window.
The return gap is a concentration gap
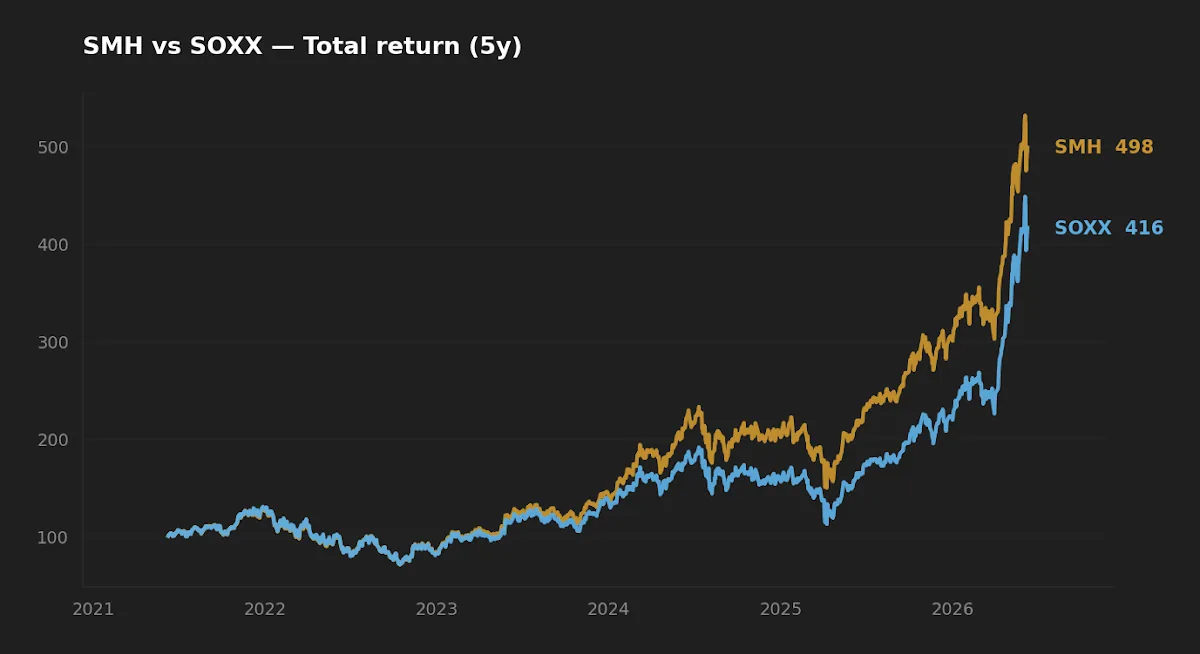
SMH compounded at 37.6% annualized over five years against SOXX's 32.7% — roughly five points a year, which over a five-year window is a large divergence in terminal value. The fee gap explains almost none of it: one basis point of expense ratio is rounding error against a five-point return spread.
The driver is concentration. SMH's modified-cap weighting allows its top two or three holdings — the dominant accelerator designer and the leading pure-play foundry among them — to occupy an outsized share of the book. SOXX's methodology deliberately spreads weight further down the list. In a five-year stretch where the very largest names were also the strongest performers, the fund that refused to trim its winners pulled ahead. That is not a structural edge; it is a structural bet that paid off in this regime.
This is the part worth sitting with. SMH's outperformance is not evidence that its design is superior across cycles. It is evidence that top-heavy weighting beat diversified weighting during a period when the top was where the returns were. Reverse the leadership — a single dominant holding stumbles, or capital rotates toward equipment and mid-cap names — and the same concentration that helped becomes the thing that hurts. The data shows what happened; it cannot tell you the next regime will rhyme.
SMH's five-year lead is not proof its design is better — it is proof that top-heavy weighting beats diversified weighting precisely when the top is where the returns are.
Realized risk: the counterintuitive part
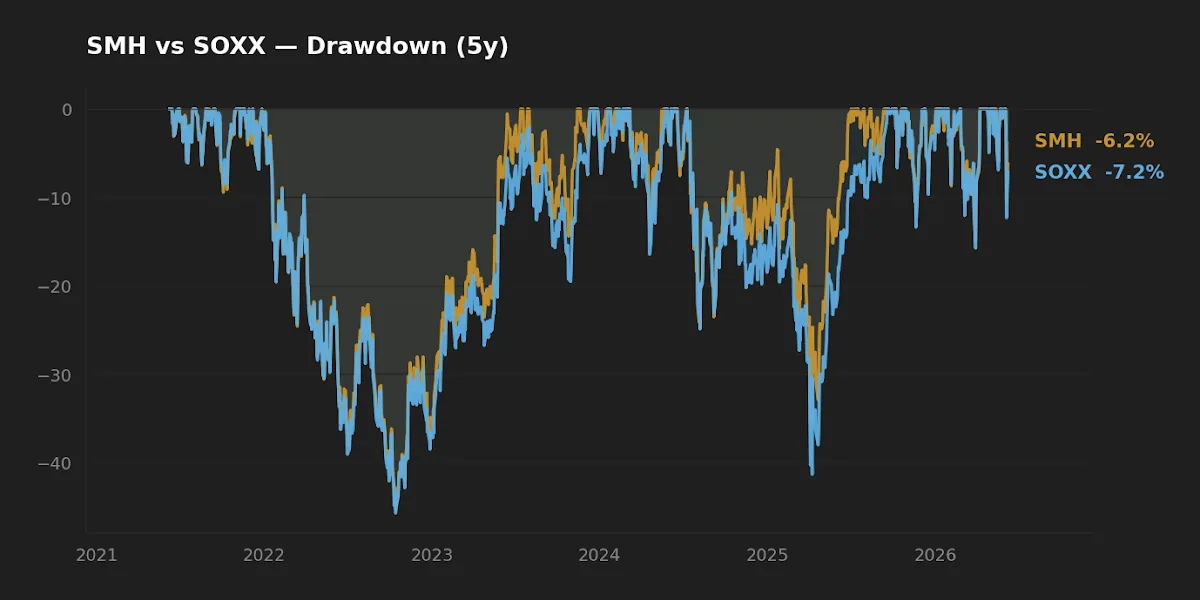
Here is the result that does not fit the intuition. The more concentrated fund posted lower realized volatility — SMH at 35.3% annualized versus SOXX at 36.5% — and a marginally shallower max drawdown (−45.3% vs −45.8%). Most investors would expect the 25-stock book to be the jumpier of the two.
The explanation is that concentration and volatility are not the same axis. SMH's largest weights sat in mega-cap names whose own realized volatility, during this window, was lower than that of the smaller-cap and equipment names that SOXX's broader weighting pulled in. Concentrating into the calmest large caps produced a portfolio that was, in this single sample, slightly steadier than the more "diversified" alternative. That is a single-regime artifact — there is no law that says the largest semiconductor names will always be the least volatile, and in a downturn led by the megacaps the ordering could flip entirely.
The drawdown profile reinforces how little daylight there is on the downside. Both funds lost roughly 45% peak-to-trough over five years. Whatever diversification SOXX offers on paper, it did not buy a meaningfully gentler bottom. When a single sector de-rates, holding 25 names or 30 names of the same industry is close to the same trade — correlation inside a sector spikes exactly when a holder would most want it not to.
Implementation, capacity, and the macro backdrop
On implementation friction, both funds are large and liquid enough that bid-ask spread and tracking error are second-order for a buy-and-hold investor. SMH carries the larger asset base at $67.8B versus $38.4B for SOXX; at this scale, neither faces capacity constraints, and both trade with tight spreads. Distribution yields are negligible (0.2% and 0.3%) — these are growth vehicles, not income vehicles, and the qualified-versus-ordinary split on such small distributions is immaterial to the thesis.
The macro frame matters more than the micro-friction. Semiconductors are a long-duration, capital-spending-sensitive trade. With the federal funds rate at 3.63% (FRED, as of 2026-05-01) and CPI still running at 3.9% year over year (FRED, as of 2026-04-01), the discount rate applied to a sector whose value sits years out in capital cycles is not trivial. Neither ETF hedges that; both are pure long exposure. A holder is taking the rate-sensitivity and the cyclicality together, in one instrument.
One more framing worth naming: a top-heavy sector ETF behaves a little like implicit leverage on its largest holdings — not in the daily-reset, path-dependent sense of a geared fund, but in the sense that the concentrated position amplifies single-name outcomes. Readers thinking about that amplification mechanically may find the discussion of path dependency and the behavioral gap in leveraged products a useful contrast, even though SMH and SOXX are both unlevered.
Scoreboard
| Category | Edge | Why |
|---|---|---|
| Cost | Tie | 0.35% vs 0.34% — one basis point is immaterial. |
| Realized risk (5Y) | SMH, narrowly | Lower volatility (35.3% vs 36.5%) and shallower drawdown — but a single-regime result. |
| Realized return (5Y) | SMH | 37.6% vs 32.7% CAGR, driven by concentration in the leaders. |
| Suitability / breadth | SOXX | Wider roster dilutes single-name risk for those who want it diluted. |
FAQ
Is SMH or SOXX more diversified? SOXX. It holds a wider roster and its weighting methodology pulls capital away from the very top of the cap distribution, where SMH lets its largest positions run. Inside a single sector, though, "more diversified" is a relative term — both lost roughly 45% at their five-year troughs.
Why did SMH outperform SOXX over five years? Concentration. SMH's heavier weighting toward the largest semiconductor names captured more of their gains during a period when those names led the sector. The fee difference (one basis point) explains essentially none of the 5-point annualized gap.
Are the fees different enough to matter? No. At 0.35% and 0.34%, the expense ratios are functionally identical. Over decades the gap compounds to a rounding error relative to the return dispersion the two funds produce through their different weighting.
Do these ETFs pay meaningful dividends? No. Distribution yields are roughly 0.2% (SMH) and 0.3% (SOXX). Both are growth-oriented; an investor seeking income should not look here.
Is holding one semiconductor ETF a substitute for a broad-market fund? No. Both are single-sector, cyclical, rate-sensitive exposures with ~35% annualized volatility — many times the dispersion of a total-market index. They function as a satellite tilt, not a core.
What this comparison can and can't tell you
The five-year window covers one broad semiconductor up-cycle with a single deep drawdown. It does not contain a multi-year sector bear market, a sustained rotation away from the megacap leaders, or a regime where small-cap and equipment names lead. Because SMH's apparent edge in both return and realized risk depends on the largest names being both the strongest and the steadiest, every advantage shown here is conditional on that ordering holding — and the sample is too short, and too single-regime, to assume it will. The drawdown figures also reflect daily-close data and will understate intraday extremes.
Scenarios where each fits
A reader who wants undiluted exposure to the dominant chip leaders and accepts that the position rides or falls with two or three names leans toward SMH. A reader who wants the semiconductor theme with single-name risk spread further down the roster — accepting a slightly lower realized return in exchange for not concentrating into the top — leans toward SOXX. A reader in their 30s with a 401(k)-only account and no existing tech tilt should size either as a small satellite, not a core, given the ~45% drawdown both carry. For how a concentrated satellite interacts with a diversified core, the hybrid-portfolio framework is the relevant companion read.
Editor's read
If forced to choose one for a satellite semiconductor sleeve, the editor leans toward SOXX — not because it won the last five years (it didn't) but because its broader weighting is less dependent on two names continuing to lead, and the cost of that diversification is one basis point. SMH is the cleaner expression of "I want the leaders and I accept the concentration," and there is nothing wrong with that thesis stated honestly. The discomfort is that SMH's recent edge in both return and realized risk is precisely the kind of result a single regime manufactures, and paying for it with hindsight is how look-ahead bias enters a portfolio.
The editor holds neither SMH nor SOXX at the time of writing.
Methodology: Return, volatility, and drawdown figures computed from yfinance daily total-return price series, pulled 2026-06-08; trailing windows end at the pull date. Expense ratio, AUM, inception, and index methodology from issuer fact sheets (VanEck, iShares), accessed 2026-06-08. Macro figures from FRED: federal funds rate as of 2026-05-01, CPI year-over-year as of 2026-04-01.
This article is for educational purposes and does not constitute personalized financial advice. See our full Disclaimer.