
Photo by Mohamed Nohassi on Unsplash
The short version
- AI capex is increasingly an electricity story. Data-center load growth has revived a previously sleepy regulated-utility sector and pulled grid-equipment makers into the spotlight.
- "AI infrastructure" is not one trade. XLU, IFRA, PAVE, and XLE express four different bets — on rate-base growth, on broad infrastructure, on equipment capex, and on natural-gas-fired base load — and they behave very differently in stress.
- The unappreciated risk is regulatory, not technological. Utility capex only earns a return if state public utility commissions approve the underlying rate-base increases. That approval is not automatic.
The interesting question is no longer whether AI workloads need more electricity — that is settled. The interesting question is which part of the value chain captures the spend, on what timeline, and with what regulatory friction. "AI infrastructure" gets used as one phrase, but the ETFs marketed under that banner buy four quite different things, and they will not all pay off in the same way.
This piece walks through XLU for regulated utilities, IFRA for the broader infrastructure value chain, PAVE for grid and construction equipment, and XLE for the fossil-fuel layer that still backs most US base-load generation. The goal is not a buy list. It is to give a reader enough structure to decide whether any of these belong in their own portfolio, and at what weight.
What "AI infrastructure" actually means in 2026
The hyperscalers have collectively guided to several hundred billion dollars of annual data-center capex through the back half of the decade. The bottleneck is no longer chip availability; it is grid interconnection. Several US utilities have publicly extended interconnection queues to 2028 or beyond. That changes the financial profile of utilities — long considered slow-growth dividend names — into something closer to capex-cycle businesses, with all the regulatory and rate-base questions that follow.
Three layers matter:
- Generation — who actually produces the electrons. In the US, this is still a mix of natural gas (~40%), nuclear (~19%), wind and solar (~21%), and a declining coal share. AI base-load demand favors dispatchable sources, which means gas and nuclear over intermittent renewables.
- Transmission and distribution — high-voltage lines, transformers, switchgear, substations. Much of the grid was built in the 1960s and 1970s. AI load growth is forcing a refresh that supplier capacity cannot meet on the demanded timeline.
- Real estate — the data-center buildings themselves, primarily owned by specialist REITs and increasingly built-to-suit for hyperscalers.
Each layer has different ETF exposure, different sensitivity to interest rates, and different downside in a recession. Treating them as one trade is the first analytical mistake.
The four ETFs and what each one actually owns
| Ticker | Exposure | ER | AUM | Yield | 5Y CAGR | 5Y vol | Max DD (5Y) |
|---|---|---|---|---|---|---|---|
| XLU | US regulated utilities | 0.08% | $24.1B | 2.5% | 9.2% | 17.3% | −25.3% |
| IFRA | Broad US infrastructure | 0.30% | $4.1B | 1.6% | 12.8% | 18.0% | −19.9% |
| PAVE | US infrastructure development | 0.47% | $13.4B | 0.8% | 16.4% | 21.6% | −26.2% |
| XLE | US energy (large-cap) | 0.08% | $41.4B | 2.5% | 22.3% | 26.1% | −26.0% |
Source: yfinance, asof 2026-05-16. ER, AUM, yield, and inception cross-checked against each issuer's fact sheet (linked from ticker). CAGR, volatility, and max drawdown computed on trailing five-year daily total-return series.
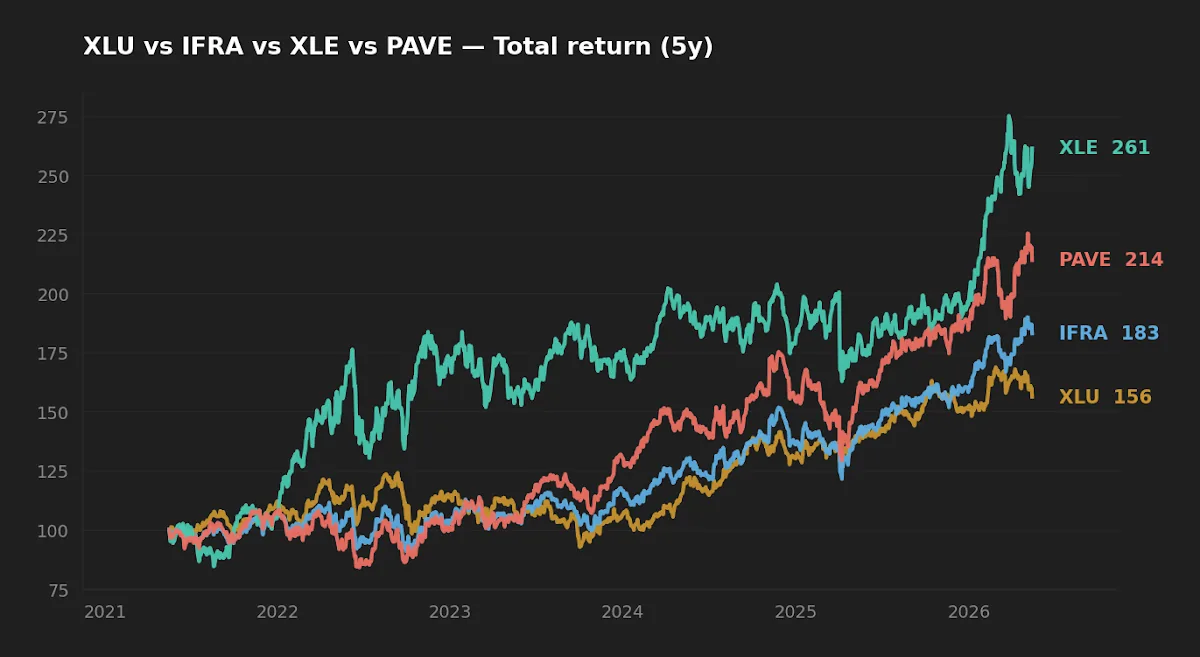
A reader looking only at the names would assume IFRA and PAVE are interchangeable. They are not. PAVE is closer to a pure-play on grid and construction equipment makers and carries a higher fee for that tilt; IFRA leans broader, includes utilities themselves, and costs 0.30%. That distinction is what determines whether the fund correlates with XLU or with industrial cyclicals in a downturn. A separate piece on infrastructure ETFs for 2026 walks through the holdings overlap in more detail.
The power layer: utilities and the rate-base bottleneck
The mainstream narrative on utilities is correct as far as it goes. AI data centers consume roughly 30–50× the power-per-square-foot of conventional commercial real estate, and Virginia, Texas, and parts of the Pacific Northwest are seeing utility load forecasts that would have been unthinkable in 2019. NextEra and Southern Company have both raised long-term capex guidance materially in the last 18 months. XLU's top holdings sit at the center of that.
What gets less coverage is how utility earnings actually grow. A regulated utility does not earn a return on its assets — it earns a return on its rate base, the value of its capital investments that the state public utility commission has approved for inclusion in customer rates. Capex announcements are forecasts. Whether that capex translates into shareholder returns depends on whether the commission allows the utility to recover the cost plus an authorized return on equity, typically in the 9.0–10.5% range, through tariffs.
This is where the AI thesis can disappoint even if the underlying demand is real. State commissions in several jurisdictions are already pushing back on whether residential ratepayers should subsidize hyperscaler load growth, and proposing carve-out tariffs that put more of the cost on the data-center customer. That is reasonable policy, but it can compress the margin available to the utility. The point is not that the thesis is wrong — it is that the implementation risk is regulatory, and that risk is not visible from a price chart.
The other variable is interest rates. Utilities are capital-intensive and finance heavily with long-dated debt. The 10-year Treasury at 4.47% (FRED, asof 2026-05-14) is materially higher than the rate environment in which most utility business plans were drafted. Falling rates help; sticky disinflation, with CPI still at 3.9% YoY (FRED, asof 2026-04-01) and the federal funds rate at 3.64%, means that easing is not the layup it looked like a year ago. A separate piece on rate-sensitive ETFs covers the duration math.
The grid layer: equipment, not utilities
The companies most directly leveraged to AI grid buildout are not the utilities themselves but the firms that supply transformers, switchgear, and high-voltage cables. Eaton, Quanta Services, GE Vernova, and Hubbell have all reported multi-year backlog extensions. Lead times on large power transformers were under a year pre-2020; by 2026 several manufacturers quote 18–36 months. That is a supplier-capacity problem with real pricing power for incumbents.
PAVE captures more of this exposure than IFRA, but neither is a pure play. The 5Y CAGR of 16.4% on PAVE versus 12.8% on IFRA partly reflects this tilt — PAVE's heavier weight in electrical equipment and engineering names benefited from the capex spin-up — but it has also come with higher realized volatility (21.6% vs 18.0%) and a deeper drawdown (−26.2% vs −19.9%). An investor who specifically wants the equipment-maker thesis should at least look at the holdings overlap before assuming IFRA delivers it. For some readers, a small allocation to a broader industrial ETF overlaps meaningfully with the same names at a lower fee than 0.47%, which is worth knowing before paying for PAVE.
The AI capex story does not become a utility-shareholder story until a state public utility commission says it does. Capex announcements are inputs; rate-base approvals are the cash flow.
Realized risk: drawdowns are where the layers separate
Five-year volatility and max drawdown tell a story that the headline CAGR numbers hide. XLU, the supposedly defensive utility book, drew down 25.3% — almost identical to PAVE (−26.2%) and XLE (−26.0%) and meaningfully worse than IFRA (−19.9%). The reason is duration. The 2022 rate cycle hit long-duration cash-flow assets harder than the broader market, and utilities behaved more like long bonds than like equities for several quarters.
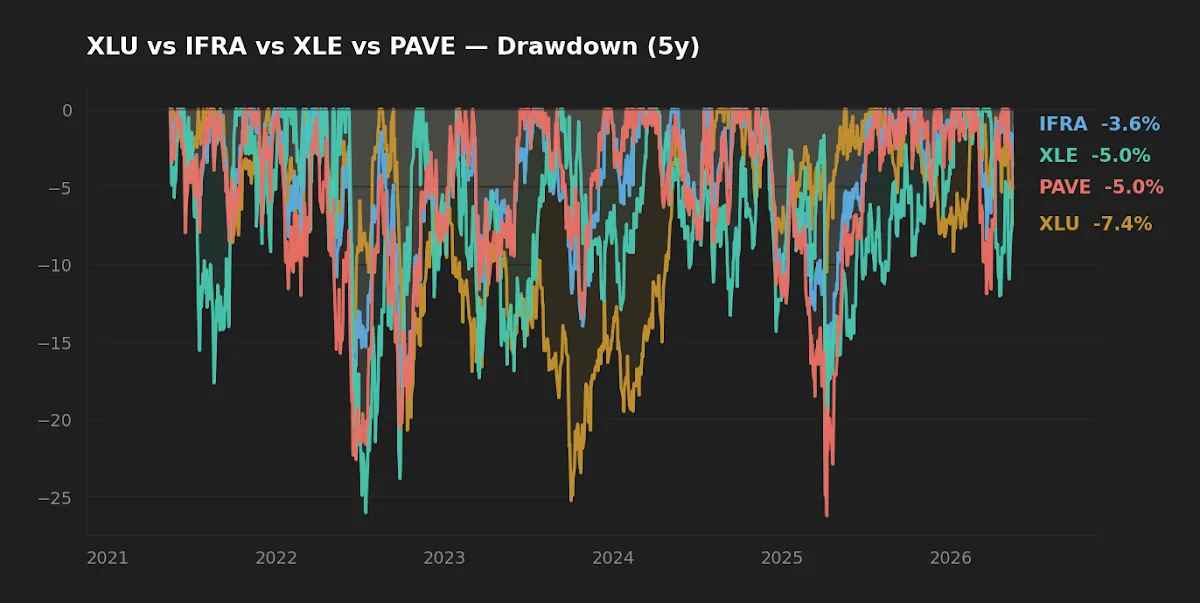
The drawdown chart is also where XLE's CAGR deserves a footnote. The 22.3% trailing 5Y CAGR is real but starts from the 2020 oil-price trough — a single-regime artifact more than a stable expected return. Energy's 10-year CAGR of 10.7% is closer to a defensible long-term estimate, and even that comes with 26.1% annualized volatility. The thesis that AI gas demand will drive XLE is plausible; the assumption that the next five years will look like the last five is not.
The fuel layer: natural gas is the actual AI base load
Renewables generate most of the 2026 power-mix headlines, but the AI workload is not friendly to intermittency. Hyperscalers contracting for 24/7 carbon-matched power are still, in practice, paying for natural-gas-fired combined-cycle plants to fill the gap when wind and solar do not — or paying premium prices for nuclear power purchase agreements.
This is where XLE is misread by some retail commentators. XLE's largest exposures are integrated oil majors whose AI-power story runs through the gas portion of their business, not through chips. The fund is not a clean expression of the data-center thesis. If gas demand is the thesis, an investor would be more direct in a focused natural-gas equity ETF or in midstream pipeline names. A separate XLE vs VDE comparison covers the construction differences in more detail.
One under-discussed angle: data-center REITs share interest-rate sensitivity with utilities. They are not a low-correlation diversifier from XLU; they ride the same duration. A separate piece on data-center REITs vs infrastructure walks through the cash-flow differences.
Where this thesis can break
Three things would invalidate the simple "buy AI infrastructure" version of this trade:
- Capex deferral. If hyperscaler revenue growth disappoints — particularly if AI inference workloads commoditize and per-token pricing collapses — the announced capex can slow. Data-center lead times are multi-year, but capex schedules can still slip.
- Regulatory pushback. State legislatures and PUCs are now actively considering whether to allow special data-center tariffs, what carbon offsets count, and whether new gas plants can be sited at all. Each of these levers compresses returns to the regulated layer.
- Rates staying higher for longer. Utilities are bond proxies in their downside profile. With CPI not yet back to target and the federal funds rate at 3.64%, the easing path is not as clean as the consensus from twelve months ago. XLU's recent rally was partly anticipation of cuts. If those cuts are slower or smaller than priced, that anticipation unwinds.
FAQ
Is XLU still a defensive ETF, or has it become a growth ETF?
Both, in pieces. The sector composition has not changed — these are still regulated utilities with predictable revenue. What has changed is the implied capex growth rate, which is now closer to that of an industrial than a bond proxy. Behavior in an equity drawdown will still resemble historical defensive utilities; behavior in a rate-cut cycle is what looks different.
Should an investor own all four of these ETFs?
Generally no — the overlap is significant, and the combined exposure ends up correlating heavily within US equity. A more typical structure is to pick one expression of the theme at a position size proportionate to conviction, rather than stacking all four.
How does this compare to just owning the broad market?
A reader already owning a total-market ETF is meaningfully exposed to most of these names. NextEra, Eaton, ExxonMobil, and Constellation all sit inside the top few hundred holdings of a broad index. A satellite tilt to one of these sector funds expresses higher conviction than the index weight; it is not exposure that is otherwise missing.
What about KRW-listed equivalents?
KODEX and TIGER each list US-utility and US-infrastructure tracking products. The relevant question is currency: holding US utilities through a USD-denominated ETF gives full FX exposure; holding through a KRW-listed unhedged equivalent does the same; KRW-hedged versions strip it out. None of these track XLU exactly. The fee differential and tax treatment in the local wrappers should be checked against the holder's specific account type.
Is data-center REIT exposure a substitute for utility exposure?
No. They share interest-rate sensitivity but the cash-flow drivers are different. REITs collect rent from hyperscaler tenants on long-dated leases; utilities collect tariffs from regulated ratepayers. They both rise on AI demand but break differently in a downturn. Treating them as substitutes overstates the diversification.
What this analysis can and can't tell you
The AI-power capex cycle is roughly 18 months old as a clearly visible market trend. There is no precedent in the modern dataset for utility load growth at this rate; the closest historical analog is the industrial expansion of the 1950s and early 1960s, which is not directly comparable because the regulatory regime was different. Any factor backtest on these names is essentially fitting noise across regimes that did not include this driver. The five-year statistics in the table above are useful as a baseline of historical realized risk, but they are not a forecast of the next five years — and XLE's CAGR in particular is starting from a regime-specific low. Treat the thesis as forward-looking; do not expect historical statistics to confirm it.
Scenarios where each fund fits
- XLU — natural fit for a reader who already holds broad US equity and wants a measured overweight to the regulated-utility rate-base story. Behaves more like a long-duration bond proxy than the index in stress; expect drawdowns timed to rate spikes, not equity recessions.
- IFRA — broader, more diversified infrastructure exposure for a reader who does not want to pick a sub-theme. The trade-off is dilution: less leverage to any one layer, in exchange for the smallest realized drawdown in the cohort. Useful as a single-fund proxy.
- PAVE — closer to a pure equipment, construction, and electrification play. Higher correlation with industrial cyclicals; not a defensive position. Suitable as a satellite tilt for a reader who specifically wants the supplier-capacity thesis and is willing to pay 0.47%.
- XLE — overlapping with the AI thesis only through the gas portion of integrated majors. Readers who want it primarily for AI exposure should reconsider; readers who want general energy-sector exposure should treat AI as an incremental tailwind, not the core thesis.
Editor's read
If forced to pick one expression of this theme for a long-horizon satellite, the editor would lean toward XLU over PAVE — not because the equipment-maker thesis is wrong, but because PAVE's 0.47% fee and 21.6% volatility ask a lot of a reader who already owns industrials through a broad index. XLU at 0.08% offers the cleanest exposure to the rate-base story, with the honest acknowledgement that the position is essentially a leveraged bet on the path of long rates. IFRA at 0.30% is the most defensible single-fund choice for readers who do not want to commit to a sub-theme. XLE belongs in this conversation only as an energy-sector decision, not as an AI trade.
The editor does not hold XLU, IFRA, PAVE, or XLE at the time of writing.
Methodology
ETF price, expense ratio, AUM, dividend yield, inception, and trailing five-year total-return statistics in this article are sourced from yfinance, fetched 2026-05-16. CAGR, annualized volatility, and maximum drawdown are computed from daily total-return series over the trailing five-year window; XLU and XLE additionally have ten-year CAGR available (9.4% and 10.7% respectively) and the others do not, given inception dates in 2017 and 2018. Holdings and structural descriptions cross-check against each issuer's fact sheet, linked from the ticker symbols in the data table. Macro figures (10-year Treasury, federal funds rate, CPI YoY, VIX) are from FRED with as-of dates noted inline.
This article is for educational purposes and does not constitute personalized financial advice. See the full Disclaimer for terms.