
Photo by Pawel Czerwinski on Unsplash
The short version
- The low-volatility anomaly — lower-risk stocks earning competitive or better risk-adjusted returns — has survived decades of out-of-sample testing, but the two largest US products built on it differ more in construction than in name.
- Over the trailing five years, SPLV and USMV delivered nearly identical realized volatility (12.6% vs 12.4%) and nearly identical worst drawdowns (−17.3% vs −17.9%); the divergence showed up in return, not in defense.
- Bottom line: USMV's optimizer-based construction and 0.10% lower fee have translated into a compounding edge, while SPLV offers a deeper, higher-yielding defensive tilt that behaves differently across rate regimes.
The central question here is not whether the low-volatility anomaly is real — the academic record on that is unusually durable — but whether the two funds most investors reach for to capture it are actually doing the same job. SPLV (Invesco S&P 500 Low Volatility ETF) and USMV (iShares MSCI USA Min Vol Factor ETF) share a shelf and a reputation, yet they are built from different first principles. The distinction matters because it determines what you own in a crash, what you yield in the meantime, and how the position behaves when interest rates move.
Context: what the anomaly actually claims
Classical theory says risk and return move together: hold more volatile stocks, earn a higher expected return for bearing that risk. The low-volatility anomaly is the empirical observation that this relationship is flat — or even inverted — inside the equity market. Low-beta, low-volatility stocks have historically delivered returns comparable to the market with meaningfully less variance, which means superior risk-adjusted performance. Frazzini and Pedersen formalized one mechanism in Betting Against Beta (2014): leverage-constrained investors bid up high-beta names, leaving low-beta stocks structurally cheap on a risk-adjusted basis. Baker, Bradley and Wurgler (2011) framed the persistence as a limit to arbitrage — benchmarking keeps institutional capital from fully exploiting it. This is the same family of thinking that underpins broader factor investing and the Fama-French program.
Both funds launched in 2011, giving roughly a decade and a half of live, post-publication history — the part of a factor's record that matters most, because it is immune to the data-mining and look-ahead problems that inflate backtests. What follows uses that live record rather than a simulated one.
The data
| Metric | SPLV | USMV |
|---|---|---|
| Name | Invesco S&P 500 Low Volatility | iShares MSCI USA Min Vol Factor |
| Expense ratio | 0.25% | 0.15% |
| AUM | $7.1B | $23.0B |
| Inception | 2011-05-05 | 2011-10-18 |
| Dividend yield | 2.1% | 1.5% |
| 5Y CAGR | 6.3% | 7.0% |
| 10Y CAGR | 8.0% | 9.5% |
| 5Y realized volatility | 12.6% | 12.4% |
| 5Y max drawdown | −17.3% | −17.9% |
Price, return, volatility and drawdown figures are computed from yfinance data pulled 2026-07-16; expense ratio, AUM, yield and inception are from the issuer fact sheets (Invesco SPLV; iShares USMV). CAGR, yield and drawdown are expressed as percentages; realized volatility is annualized from daily returns.
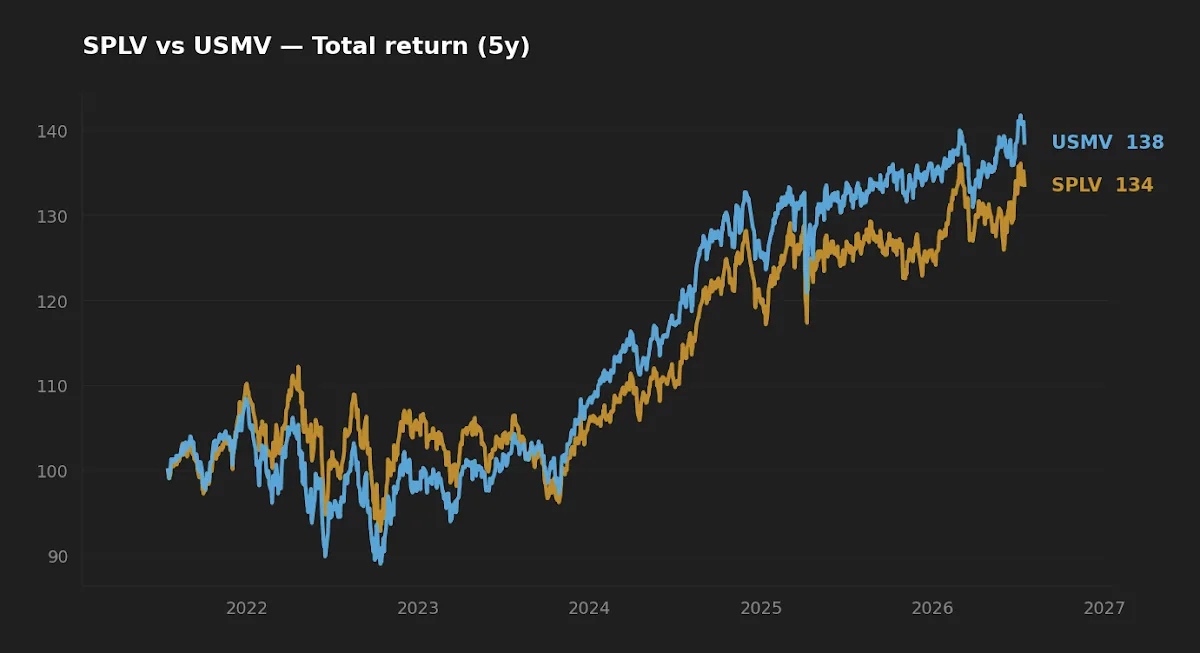
Same label, different machinery
The naming hides the most important difference. SPLV is a ranking rule: it takes the 100 S&P 500 constituents with the lowest trailing 12-month realized volatility and weights them by the inverse of that volatility. It does not look at how those stocks move relative to each other. USMV is an optimizer: MSCI's minimum-volatility methodology solves for the lowest-variance portfolio subject to constraints on sector and single-stock weights, and critically it uses the full covariance matrix — correlations included.
That single design choice has a counterintuitive consequence. An optimizer can hold a moderately volatile stock if it diversifies the rest of the book, and can underweight a low-volatility stock that happens to be highly correlated with existing holdings. So USMV will sometimes own names SPLV would reject, and vice versa. This is why the realized-volatility numbers converge — 12.4% versus 12.6% — even though SPLV's selection screen sounds like it should produce the calmer portfolio. The lesson generalizes: what a factor fund is named tells you its intent, not its behavior. Measuring the actual holdings and their overlap and construction is the only way to know what you own.
Realized risk: the anomaly does not mean crash-proof
The most useful thing the live record tells us is what these funds did not do. Over the trailing five years — a window that includes a sharp rate-driven repricing — SPLV drew down 17.3% and USMV 17.9%. Neither escaped. A reasonable prior for a product marketed on "low volatility" might be a materially shallower hole than the broad market; the reality is a partial cushion, not a wall.
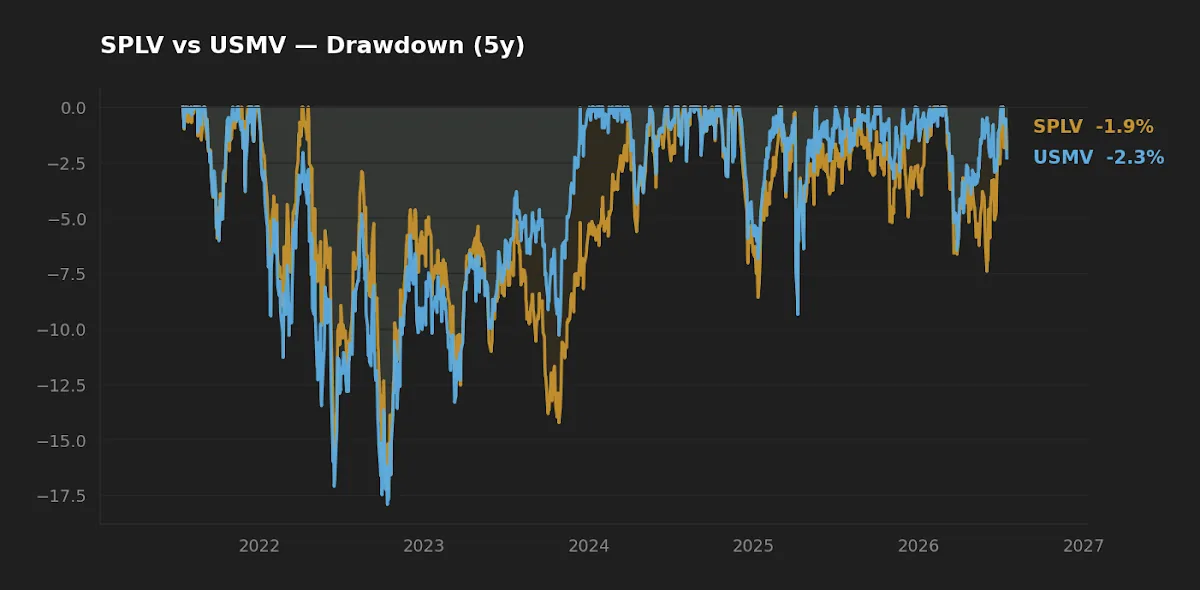
This is the part of the anomaly that gets oversold. Low-volatility strategies reduce the frequency and amplitude of ordinary fluctuation, and they improve return per unit of risk over full cycles. What they do not reliably do is protect you in a fast, correlation-spiking selloff, when the diversification the optimizer relied on temporarily disappears. Both funds also carry a specific structural exposure: their defensive tilt concentrates in utilities, consumer staples and other rate-sensitive, bond-proxy sectors. With the 10-year Treasury at 4.58% and the fed funds rate at 3.63% (FRED, asof 2026-07-14 and 2026-06-01), those sectors face a valuation headwind that a broad-market fund carries less of. The drawdown you see is partly a low-vol drawdown and partly a duration drawdown wearing the same coat.
Over five years these two funds shared almost identical volatility and almost identical worst-case losses — the entire divergence lived in return, which is the opposite of what their shared name implies.
Where the return gap comes from
USMV out-earned SPLV by roughly 0.7 percentage points annually over five years and about 1.5 points over ten, with essentially the same realized risk. Three factors plausibly account for the spread. First, the 0.10% fee difference compounds quietly but relentlessly — faithfulness in small things is not a slogan here, it is arithmetic. Second, SPLV's deeper, higher-conviction tilt into the lowest-volatility (and often most rate-sensitive) names produced its higher 2.1% yield but also heavier exposure to sectors that lagged in a rising-rate decade. Third, USMV's correlation-aware construction let it hold a broader, less sector-concentrated book, which helped in the specific regime we observed.
I want to be careful about what this does and does not prove. Ten years — even live — is one macro regime dominated by low-then-rising rates and strong large-cap growth leadership. A different regime, particularly a prolonged high-inflation or falling-rate environment, could reorder these results. Initially I assumed SPLV's simpler, deeper tilt would show up as clearly lower realized volatility; the rolling numbers did not support it, which is a reminder that construction intent and construction outcome are separate measurements. USMV's larger $23.0B AUM versus SPLV's $7.1B also matters at the margin — deeper liquidity, tighter spreads, and lower closure risk are real implementation advantages even before returns enter the picture. Readers weighing this alongside a fuller side-by-side of the two defensive approaches will find the construction detail is where the decision actually lives.
Scoreboard
| Category | Edge | Why |
|---|---|---|
| Cost | USMV | 0.15% vs 0.25% — 10 bp compounds over decades |
| Realized risk | Tie | 12.4% vs 12.6% vol; −17.9% vs −17.3% drawdown |
| Realized return | USMV | Higher 5Y and 10Y CAGR at equal risk |
| Income | SPLV | 2.1% vs 1.5% yield, deeper defensive tilt |
| Liquidity / scale | USMV | $23.0B vs $7.1B AUM |
Frequently asked questions
Is the low-volatility anomaly still real, or has it been arbitraged away? The live post-2011 record for both funds shows competitive returns at lower-than-market volatility, consistent with the pre-publication evidence. The anomaly appears to persist, likely because benchmarking and leverage constraints limit the capital willing to exploit it — but persistence is not permanence, and factor premia can go quiet for long stretches.
Why do two "low-volatility" funds have almost the same realized volatility? SPLV ranks stocks by individual volatility; USMV optimizes the whole portfolio using correlations. Different machinery, similar realized variance. The naming describes intent, not the covariance-driven outcome.
Do these funds protect me in a crash? Partially. Both fell roughly 17–18% at their five-year worst. They dampen ordinary fluctuation and improve risk-adjusted return over cycles, but they are not a hedge against a fast, correlation-spiking selloff.
Why does SPLV yield more? Its screen tilts harder into the lowest-volatility names, which cluster in utilities, staples and other higher-yielding, rate-sensitive sectors. That produces the 2.1% versus 1.5% yield gap and also concentrates interest-rate exposure.
Does the 0.10% fee difference actually matter? Over a year, marginally. Over multiple decades of compounding on a core position, a persistent 10 bp drag is a meaningful headwind — especially when the cheaper fund also delivered the higher gross return in the observed window.
What this comparison can and can't tell you
The return and risk figures come from a single, roughly ten-year regime dominated by low-then-rising rates and large-cap growth leadership. There is no stress test here for a sustained high-inflation decade, a Japan-style deflationary stretch, or a rapid falling-rate cycle — all of which could favor SPLV's deeper defensive tilt over USMV's broader book. Five-year drawdown captures one major selloff, not the tail of tails. Treat the return gap as descriptive of what happened, not predictive of what must.
Scenarios where each fund fits
A reader in their 30s using a 401(k)-only account who wants a lower-volatility equity sleeve without a strong rate view has, on this evidence, a defensible default in USMV: lower fee, higher realized return, equal risk, deeper liquidity. A reader closer to or in retirement who prioritizes distribution yield and a more explicit defensive posture — and who is comfortable with heavier rate sensitivity — may find SPLV's 2.1% yield and deeper tilt a better behavioral fit, particularly as a satellite rather than the whole equity core. Anyone thinking about how a calmer sleeve interacts with withdrawal timing should also weigh sequence-of-returns risk, where drawdown timing matters as much as its depth.
Editor's read
If forced to hold one as a long-horizon low-volatility core, the editor leans toward USMV: the 10 bp fee edge, the higher realized return at equal risk, and the larger $23.0B asset base compound in the same direction over decades, and its correlation-aware construction is the more honest expression of "minimum volatility." SPLV remains genuinely interesting as an income-tilted satellite for an investor who wants the deeper defensive posture and is clear-eyed about the added rate sensitivity — but as a core sleeve, the evidence in this window favors the optimizer.
The editor does not hold either fund at the time of writing.
Key takeaways
- The low-volatility anomaly held up in live, post-publication data for both funds — but "low volatility" describes intent, not identical behavior.
- SPLV (rank-based) and USMV (optimizer-based) converged on realized risk; the entire trailing gap was in return, favoring USMV.
- Neither fund is crash-proof: both drew down 17–18% at their five-year worst, with meaningful rate-sensitive sector exposure.
- USMV wins cost, return and liquidity; SPLV wins yield and offers a deeper defensive tilt as a satellite.
- One regime, one decade — treat the numbers as descriptive, not predictive.
Methodology: Return, volatility and drawdown computed from daily price data via yfinance, pulled 2026-07-16; five- and ten-year windows ending that date. Expense ratio, AUM, dividend yield and inception from Invesco and iShares fact sheets. Macro reference rates from FRED (10Y Treasury and VIX asof 2026-07-14; fed funds and CPI asof 2026-06-01).
This article is for educational purposes and does not constitute personalized financial advice. See our full Disclaimer.