
Photo by Massimiliano Morosinotto on Unsplash
The short version
- A fund's holding count is a headline number; the effective number of holdings — the count an equal-weighted portfolio would need to match the same concentration — is usually far smaller.
- VOO nominally holds ~500 names but behaves like roughly 55 equally weighted positions; QQQM nominally holds ~100 but behaves like the mid-20s. The 5× gap in nominal count shrinks to closer to 2× once you weight it.
- Bottom line: "500 stocks" and "100 stocks" are marketing counts. The diversification you actually own — and the drawdown you inherit — is set by the top of the book, not the tail.
Ask most index investors how diversified they are and they will quote a holdings count: 500 for an S&P 500 fund, 100 for a Nasdaq-100 fund. That number is technically accurate and analytically close to useless. A market-cap-weighted index puts most of its money in a handful of names, so the tail of small positions contributes almost nothing to how the portfolio actually moves. The question worth asking is not how many stocks do I own but how many stocks am I effectively exposed to — and the answer, for both VOO and QQQM, is a small fraction of the label.
This matters because concentration is what you feel in a drawdown. If the top ten names drive the return, they also drive the loss, and no amount of long-tail holdings will cushion it. Below I put a single measurable number on that intuition and apply it to two funds retail investors routinely treat as "diversified by default."
Context: nominal count versus effective count
The standard tool here is the inverse Herfindahl-Hirschman index. If a fund holds positions with weights w₁, w₂, … wₙ, the effective number of holdings is
Neff = 1 / Σ wi²
For an equal-weighted portfolio of 100 stocks, every weight is 0.01, the sum of squares is 0.01, and Neff is exactly 100 — the nominal and effective counts agree. The moment weights become unequal, Neff falls below the nominal count, and it falls fast: a portfolio where one name is 10% and the rest are small has an effective count dominated by that one position. This is the same math antitrust regulators use to measure market concentration; the inverse simply reframes it as "how many equal-sized players does this resemble."
Applied to cap-weighted equity indices, the result is sobering. As of mid-2026, the S&P 500's largest names carry double-digit combined weight in the top handful, which pulls VOO's effective holding count down to roughly the mid-50s — computed from Vanguard's published weight file, and moving with the tape as the mega-caps expand and contract. The Nasdaq-100 is more top-heavy still, and QQQM's effective count sits in the mid-20s. Both figures are approximate and regime-dependent; treat them as order-of-magnitude, not decimals. The point survives the imprecision: a "500-stock" fund is diversified like ~55 names, and a "100-stock" fund like ~25.
The two funds, by the numbers
Before the concentration analysis, the baseline fund facts. Return and risk figures are computed from daily prices via yfinance; expense ratio, AUM, and yield are from each issuer's fact sheet.
| Metric | VOO | QQQM |
|---|---|---|
| Name | Vanguard S&P 500 ETF | Invesco NASDAQ 100 ETF |
| Index | S&P 500 (~500 names) | Nasdaq-100 (~100 names) |
| Expense ratio | 0.03% | 0.15% |
| AUM | $1,670.9B | $101.3B |
| Dividend yield | 1.1% | 0.4% |
| Inception | 2000-11-13 | 2020-10-13 |
| 5Y CAGR | 13.5% | 15.7% |
| 10Y CAGR | 15.5% | n/a (fund <6 yrs old) |
| 5Y volatility (annualized) | 16.9% | 22.6% |
| 5Y max drawdown | −24.5% | −35.0% |
| Effective holdings (approx.) | ~55 | ~25 |
Sources: Vanguard VOO fact sheet; Invesco QQQM fact sheet. Price-derived metrics from yfinance, pulled 2026-07-16, trailing-five-year window.
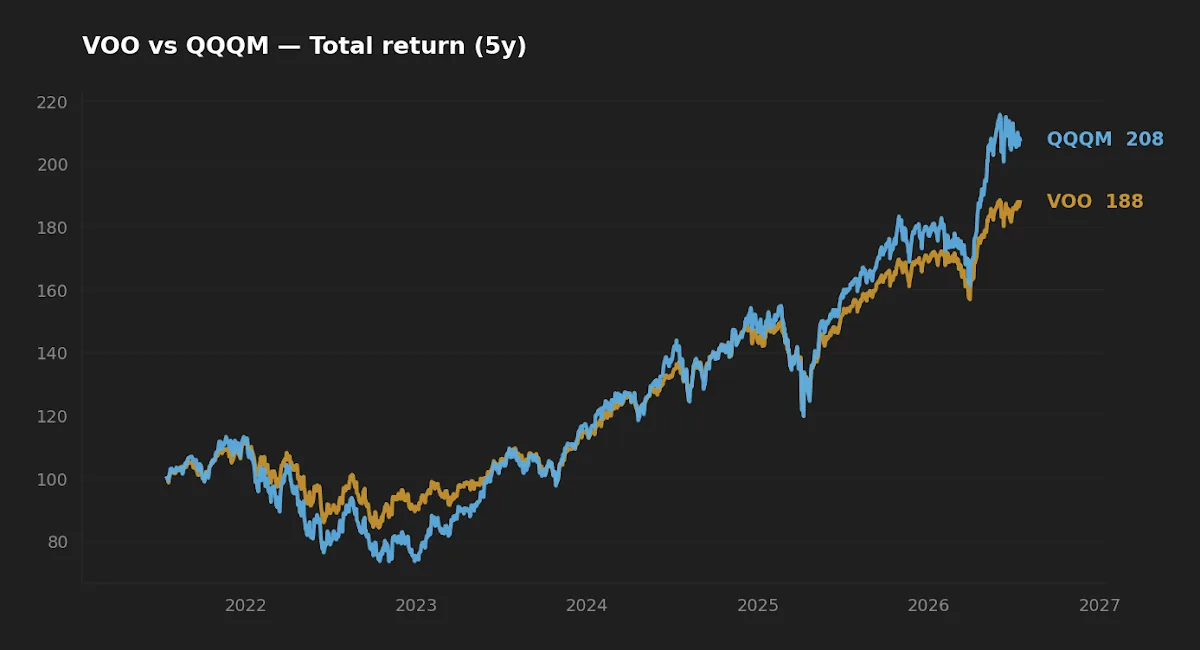
Why the effective count barely doubles when the nominal count quintuples
Here is the non-obvious part. VOO holds five times as many names as QQQM, yet its effective count is only roughly twice as large. The reason is that both indices are dominated by the same mega-cap technology and platform companies. Those names sit at the top of both weight files. Adding 400 additional small-weight stocks to the bottom of VOO's book does widen the tail, but a 0.1%-weight position contributes 0.000001 to the sum of squares — effectively nothing. Diversification is a top-of-book property, and the top of both books rhymes.
This has a direct consequence for anyone who owns both, or who owns a broad-market fund alongside a Nasdaq-100 tilt believing the pair adds meaningful breadth. It usually doesn't. The incremental names QQQM brings are largely already inside VOO at similar rank, so the combined effective count rises far less than a naïve "55 + 25" would suggest. I explored this redundancy problem directly in how much ETF overlap is too much and in why "VOO vs VTI" is usually the wrong question; the effective-holdings lens is the same argument expressed as a single number.
A "500-stock" fund and a "100-stock" fund are separated by less diversification than their labels imply, because both are steered by the same dozen names at the top of the book.
Realized risk: concentration is the drawdown you already agreed to
The effective-count gap shows up cleanly in realized risk. Over the trailing five years, QQQM ran a 22.6% annualized volatility against VOO's 16.9%, and its worst drawdown reached −35.0% versus −24.5% for VOO (yfinance, 2026-07-16). That is not a coincidence layered on top of the concentration story — it is the concentration story. A portfolio behaving like ~25 effective names will swing harder than one behaving like ~55, because idiosyncratic shocks to the top holdings are less diluted.
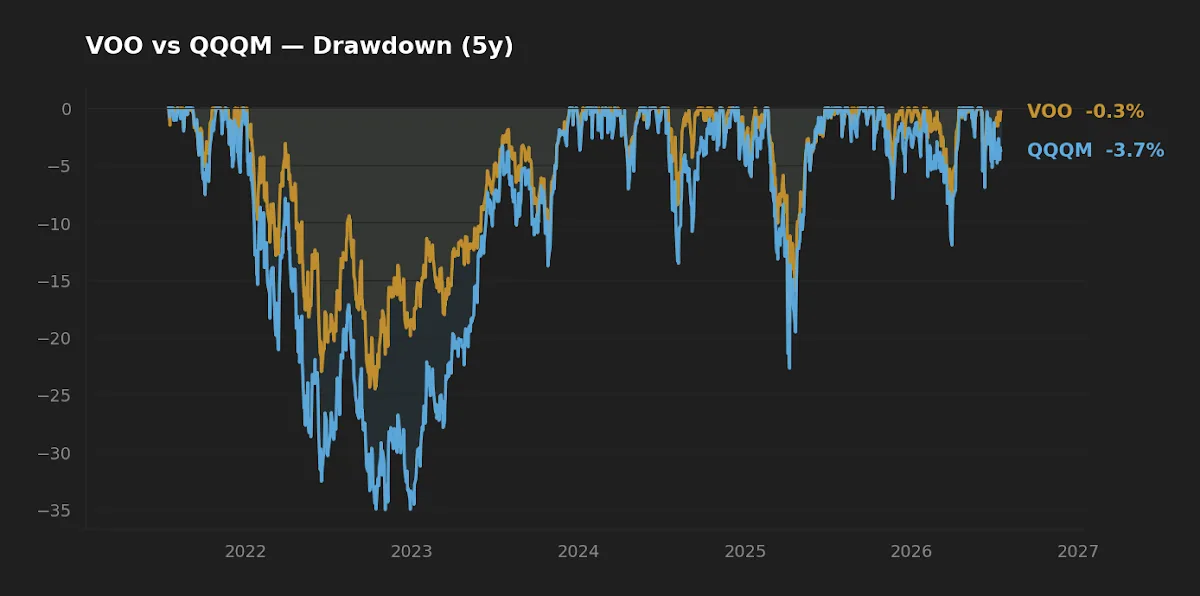
Worth noting the regime this was measured in. The current VIX reading is 16.5 (FRED, asof 2026-07-14) — a calm tape. Effective-count differences are widest exactly when volatility spikes and correlations across the top names rise together, which is not captured in a five-year window that includes only one severe stress episode. A concentrated book looks tolerable in quiet markets and reveals its true dispersion in loud ones. Initially I treated the drawdown gap as roughly proportional to the volatility gap; running the peak-to-trough paths, the drawdown gap is wider than volatility alone predicts, because concentration also shortens the diversification benefit precisely when it is most needed.
Cost, yield, and the parts that don't depend on concentration
Two differences here are structural rather than behavioral. QQQM costs 0.15% against VOO's 0.03% — a 12-basis-point gap that compounds quietly over decades and is the kind of small, persistent drag stewardship of capital takes seriously. And QQQM yields 0.4% versus VOO's 1.1%, a natural consequence of the Nasdaq-100 tilting toward reinvesting growth companies rather than mature dividend payers. For context, both yields sit well below the 4.58% on the 10-year Treasury (FRED, asof 2026-07-14); neither fund is an income vehicle, and framing either as one misreads the mandate.
On the wrapper question specifically — QQQM versus its older, pricier sibling QQQ — I covered the mechanics in QQQ vs QQQM: same index, different wrapper. For readers who want to compute effective holdings on their own book rather than trust an approximation, the method is a short exercise in a spreadsheet or a few lines of Python, along the lines of backtesting your own ETF strategy.
Scoreboard
| Category | Winner | Why |
|---|---|---|
| Cost | VOO | 0.03% vs 0.15% — a 12 bp edge that compounds. |
| Realized risk | VOO | Lower volatility (16.9% vs 22.6%) and shallower drawdown (−24.5% vs −35.0%). |
| Realized return (5Y) | QQQM | 15.7% vs 13.5% CAGR — but earned in one growth-led regime. |
| Effective diversification | VOO | ~55 effective holdings vs ~25. |
| Suitability as a core | VOO | Broader base, lower cost; QQQM reads as a satellite tilt. |
FAQ
What is the "effective number of holdings"? It is the count of equally weighted positions that would produce the same concentration as the fund's actual weighting, computed as 1 divided by the sum of squared weights. It strips out the illusion created by tiny tail positions and tells you how many names really drive the portfolio.
Why is VOO's effective count so much lower than 500? Because it is market-cap weighted. The largest names carry outsized weight while hundreds of small holdings contribute almost nothing to variance. The effective count reflects where the money — and the risk — actually sits.
Does holding both VOO and QQQM meaningfully increase diversification? Less than the holding counts suggest. The two indices share the same mega-cap leaders at the top of the book, so the incremental names QQQM adds are largely already inside VOO. The combined effective count rises modestly, not additively.
Is a higher effective count always better? Not universally — it measures breadth, not return. A more concentrated book can outperform in a regime that favors its top names, as QQQM's five-year return shows. The effective count tells you how much idiosyncratic risk you are carrying, which is a separate question from expected return.
How often does the effective count change? Continuously, as prices move and the index reconstitutes. When mega-cap leadership widens, effective counts fall; when leadership broadens, they rise. Any single figure is a snapshot, which is why the numbers here are given as approximations.
What this comparison can and can't tell you
The return and risk figures cover a single trailing-five-year window that spans mostly a growth-favorable, low-volatility regime with only one severe drawdown. That is a thin sample for judging a concentrated fund, whose defining weakness — top-name correlation in a crisis — is precisely what a calm sample under-tests. The effective-count figures are computed from published weights at one point in time and will drift. Nothing here models tax treatment, bid-ask spreads, or the sequence-of-returns risk that matters most to investors drawing down capital. Treat the concentration numbers as a lens, not a verdict.
Scenarios where each fund fits
Reader in their 30s, 401(k)-only, no existing equity tilt → a broad, low-cost, higher-effective-count core like VOO is the conventional default; the concentration analysis argues for breadth as the base layer. Reader who already owns a broad-market core and wants a deliberate growth satellite → QQQM is a coherent tilt, provided the position is sized as a satellite and the −35% historical drawdown is acceptable. Reader who owns both and assumed it was "extra diversification" → the overlap analysis suggests re-examining whether the pair is adding breadth or simply doubling the same top-of-book exposure.
Editor's read
Measured by effective holdings, VOO is the more diversified instrument and the more natural long-horizon core: lower cost, lower realized drawdown, and a top-of-book that is broad enough to dilute single-name shocks better than a ~25-effective-name book can. QQQM's five-year return edge is real but was earned in one regime and comes bundled with volatility and drawdown that the effective count predicts in advance. If forced to pick one for the core sleeve, the editor leans VOO and treats QQQM as an optional satellite — the concentration is a feature only when it is a deliberate, sized bet rather than an accidental default.
The editor holds a broad-market S&P 500 index position as part of a long-term core; does not hold QQQM at the time of writing.
Methodology. Price, return, volatility, and drawdown metrics computed from daily adjusted closing prices via yfinance, pulled 2026-07-16, over the trailing five-year window (10Y CAGR shown where available). Expense ratio, AUM, dividend yield, and inception from each issuer's fact sheet. Effective-holdings figures computed as the inverse Herfindahl-Hirschman index of published index weights and rounded to approximate values. Macro figures from FRED (10-year Treasury and VIX asof 2026-07-14).
This article is for educational purposes and does not constitute personalized financial advice. See our full Disclaimer.