Photo by Markus Spiske on Unsplash
The short version
- Holding VOO, QQQ, and VGT together does not add diversification — it stacks three different wrappers around the same mega-cap names, so the second and third fund mostly buy what you already own.
- The number that matters is not how many funds you hold but the effective number of independent bets; high-overlap sleeves quietly raise concentration and single-regime risk while looking like prudence.
- Bottom line: VOO can stand alone as a core; QQQ and VGT are factor tilts toward large-cap growth and technology, useful only when the tilt is intentional and sized.
The question sounds like a counting problem — how many funds is the right number — but it is really a measurement problem. Two investors can each hold three ETFs and own completely different risk. The one who pairs a broad index with an unrelated sleeve owns three bets; the one who stacks VOO, QQQ, and VGT owns roughly one bet wearing three tickers. This article is about how to tell the difference, and why the distinction compounds over decades.
Context: what "overlap" actually means
Overlap is usually discussed as a single percentage — the share of holdings two funds have in common. That framing undercounts the problem. VOO tracks the S&P 500. QQQ tracks the Nasdaq-100. VGT tracks a U.S. information-technology index. On paper they are three different mandates. In practice, the same handful of mega-cap technology companies sit near the top of all three, and because each fund is capitalization-weighted, those names carry disproportionate weight in every one.
So the real exposure is not "three indexes." It is a concentrated position in roughly the same ten companies, expressed through three fee structures. The thing to measure is not the fund count but the effective number of independent positions — how many genuinely distinct return streams you are exposed to after accounting for shared holdings and shared factor loadings. That number can be far smaller than the ticker count suggests.
The data on the table
Below are the three funds on cost, scale, distribution, and realized five- and ten-year performance. Expense ratios and AUM come from issuer fact sheets; price-derived figures (NAV, CAGR, volatility, drawdown) are computed from yfinance daily total-return data pulled 2026-06-09.
| Metric | VOO | QQQ | VGT |
|---|---|---|---|
| Mandate | S&P 500 | Nasdaq-100 | U.S. Info Tech |
| Expense ratio | 0.03% | 0.18% | 0.09% |
| AUM | $1,701.5B | $494.0B | $170.1B |
| Dividend yield | 1.0% | 0.4% | 0.3% |
| Inception | 2000-11-13 | 1999-03-10 | 2004-03-25 |
| 5Y CAGR | 13.6% | 17.2% | 21.1% |
| 10Y CAGR | 15.3% | 21.4% | 25.0% |
| 5Y volatility | 16.8% | 22.5% | 25.3% |
| 5Y max drawdown | -24.5% | -35.1% | -35.1% |
Sources: Vanguard VOO fact sheet, Invesco QQQ fact sheet, Vanguard VGT fact sheet; price data via yfinance, 2026-06-09.
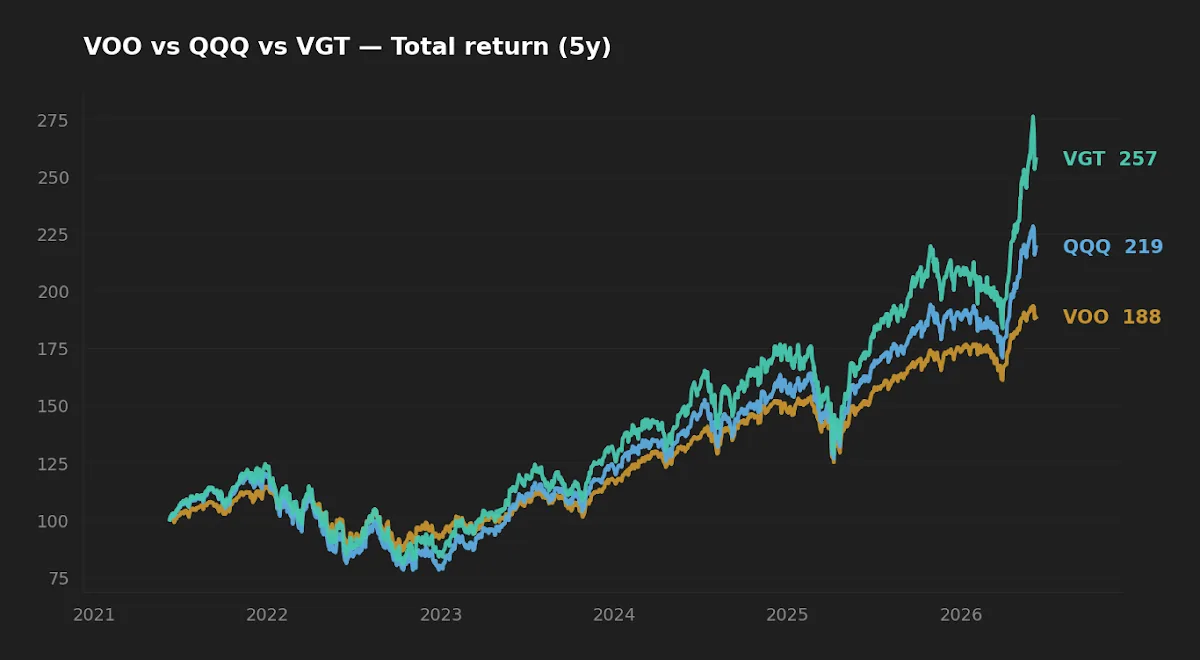
The normalized return chart is the first piece of evidence. The three lines do not just trend the same direction — they bend at the same points. That co-movement is the signature of overlap. Funds that diversify each other zig when the other zags; these mostly move as one, with VGT amplified and VOO damped.
Why the return ladder is the same bet, levered
Read the CAGR column from left to right and it looks like a menu of return: 13.6%, 17.2%, 21.1% over five years; a similar ladder over ten. The intuitive reading is that VGT is the "better" fund. The more accurate reading is that VGT is the same bet at higher intensity. As you move from VOO to QQQ to VGT, you are not changing what you own so much as concentrating it — dropping the non-technology remainder of the S&P 500 and loading harder onto large-cap growth.
The risk column confirms it. Volatility climbs in lockstep with return — 16.8%, 22.5%, 25.3% — and the five-year maximum drawdown deepens from -24.5% for VOO to roughly -35% for both QQQ and VGT. There is no free return here. The extra CAGR is compensation for a deeper hole and a longer climb out of it, realized over a single, unusually favorable regime for technology. Stacking all three does not blend these profiles; it pushes the whole portfolio toward the QQQ/VGT end of the risk axis while the investor believes they are diversifying.
Adding a second highly correlated fund does not spread risk — it concentrates conviction while disguising it as breadth.
The overlap math most plans skip
Here is the part the fund count hides. The diversification benefit of combining two assets depends on their correlation. When correlation approaches one, the combined volatility is just the weighted average of the parts — you get no variance reduction for the trouble. VOO, QQQ, and VGT are not perfectly correlated, but over the recent window they are correlated enough that the marginal diversification from adding the second and third fund is small and shrinking.
Worse, the overlap is concentrated exactly where concentration hurts most: the top names. Because all three are cap-weighted, the largest mega-cap technology companies appear at the top of each. An investor splitting money across all three can easily push the combined weight of their top handful of holdings well above what VOO alone would give — without ever choosing those names deliberately. This is the second-order effect: the redundancy does not merely waste a fund slot, it actively raises single-stock and single-factor concentration. The portfolio's effective number of independent bets falls even as the ticker count rises.
That is also why rebalancing between these three adds little. The rebalancing premium — the small return harvested by trimming winners and topping up laggards — depends on the holdings diverging and reverting. When the holdings are largely the same names, there is little dispersion to harvest. The academic literature on rebalancing (Daryanani 2008; Vanguard's 2024 work on rebalancing bands) frames the benefit as risk control across genuinely distinct asset classes, not as a tool for managing three views of the same sector. I covered the mechanics of how weight shifts actually reshape outcomes in Asset Allocation in Practice, and the diminishing returns of slicing a correlated core thinner connect directly to the structure I laid out in the rationale behind a five-ETF long-term core.
Realized risk: where the redundancy shows up
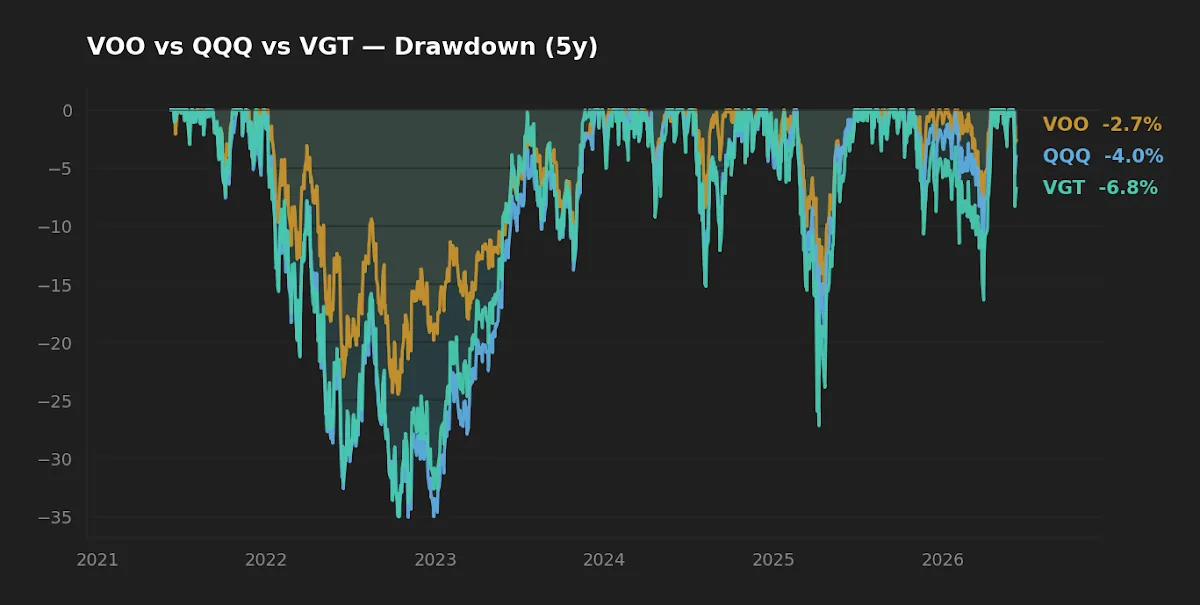
The drawdown chart is where overlap stops being abstract. In the stress episodes of the last five years, the three funds drew down together — same timing, different depth. VOO bottomed near -24.5%; QQQ and VGT both reached roughly -35.1%. A portfolio built from all three would have had no internal shock absorber, because every sleeve was selling off at once. The thing investors hope a second fund provides in a drawdown — something that holds while the other falls — is exactly what overlapping funds cannot deliver.
This matters more than the return ladder, because behavior in stress is where long-horizon plans break. A -35% drawdown tests a holder's discipline differently than a -24% one, and a portfolio that concentrates into the deeper-drawdown end without the holder realizing it is a portfolio set up for an unplanned exit at the wrong moment. The macro backdrop does not soften this: with CPI running 3.9% year over year (FRED, asof 2026-04-01) and the federal funds rate at 3.63% (FRED, asof 2026-05-01), the discount rate on long-duration growth equities is not the near-zero environment that flattered these funds for much of the past decade. The historical CAGR ladder was earned under conditions that may not repeat.
Initially I treated "more funds" as a mild inefficiency — a bit of fee drag, nothing serious. Then I looked at the joint drawdown paths and the correlation of the top holdings, and the conclusion changed: the cost is not the extra basis points, it is the hidden concentration that the extra tickers conceal.
Scoreboard: how the three actually sort out
| Category | Winner | Why |
|---|---|---|
| Cost | VOO | 0.03% vs 0.09% (VGT) and 0.18% (QQQ) |
| Realized risk | VOO | Shallowest drawdown (-24.5%), lowest volatility (16.8%) |
| Realized return (5Y/10Y) | VGT | 21.1% / 25.0% CAGR — at the highest volatility |
| Suitability as a standalone core | VOO | Broadest mandate; QQQ and VGT are tilts, not cores |
FAQ
Is it ever sensible to hold VOO and QQQ together? Yes, if the QQQ position is a deliberate, sized tilt toward large-cap growth rather than an attempt at diversification. The key is to recognize that you are concentrating, not spreading, and to size the tilt so the combined top-holding weight stays within a band you would accept knowingly.
Doesn't VGT's higher CAGR make it the better long-term holding? Higher realized CAGR over one regime is not evidence of a better long-term holding. VGT's 21.1% five-year return came with 25.3% volatility and a -35.1% drawdown, earned in a period favorable to technology. The same concentration that produced the upside is the source of the downside risk.
How do I actually measure overlap between my funds? Look past the single "common holdings %" figure. Check the combined weight of your top ten holdings across all funds, and consider how correlated the funds were during recent drawdowns. If two funds fell together every time, they are not diversifying each other regardless of the overlap percentage.
Why does overlap make rebalancing less useful? Rebalancing harvests value when holdings diverge and revert. Highly overlapping funds move together, so there is little dispersion to harvest — the rebalancing benefit shrinks toward the cost of trading. Rebalancing earns its keep across genuinely distinct asset classes, not across three views of one sector.
What is the simplest fix if I already hold all three? Decide what bet you actually want. If the answer is "broad U.S. equity," one of the three usually expresses it. If the answer includes an intentional technology or growth tilt, keep the tilt but size it on purpose, and verify the combined concentration is one you would choose deliberately. The principle generalizes; I applied a similar discipline to risk-stacked sleeves in VOO, QQQM, and SCHD.
Editor's read
If the goal is a long-horizon core, the editor treats VOO as the default and QQQ or VGT as optional satellite tilts, never as co-cores. The reason is specific: the three funds drew down together to roughly -35% at their worst, so stacking them removes the internal diversification investors think they are buying while compounding concentration in the same mega-cap names. A tilt held knowingly is a defensible choice; a tilt held by accident, disguised as breadth, is the failure mode this comparison is meant to surface.
The editor holds a broad S&P 500 position as a core sleeve; does not hold QQQ or VGT at the time of writing.
Key takeaways
- Fund count is not diversification. The measure that matters is the effective number of independent bets after accounting for shared holdings and shared factor loadings.
- VOO, QQQ, and VGT moved and drew down together over five years (-24.5% / -35.1% / -35.1%), so stacking them concentrates risk rather than spreading it.
- The return ladder (13.6% / 17.2% / 21.1% 5Y CAGR) is the same bet at rising intensity, paired with rising volatility — not three independent return sources.
- Overlap erodes the rebalancing benefit, because correlated holdings offer little dispersion to harvest.
- Tilts are legitimate when sized on purpose; the danger is hidden concentration the holder never chose.
What this comparison can and can't tell you
The performance figures cover a five- and ten-year window dominated by a single, technology-favorable regime, with no full bear market in long-duration growth equities of the kind seen in earlier decades. Realized correlation and drawdown are backward-looking and can shift; the overlap relationship is structural and more durable, but the magnitudes are not guarantees. This analysis does not model taxes, an investor's other holdings, or the exact current top-ten weights, which the issuer fact sheets update over time.
Methodology
Price, return, volatility, and drawdown figures are computed from yfinance daily total-return data pulled 2026-06-09, over trailing five- and ten-year windows. Expense ratio, AUM, dividend yield, and inception are from the Vanguard and Invesco issuer fact sheets linked above. Macro figures are from FRED (CPI year-over-year asof 2026-04-01; federal funds rate asof 2026-05-01).
This article is for educational purposes and does not constitute personalized financial advice. See the full Disclaimer.