
The short version
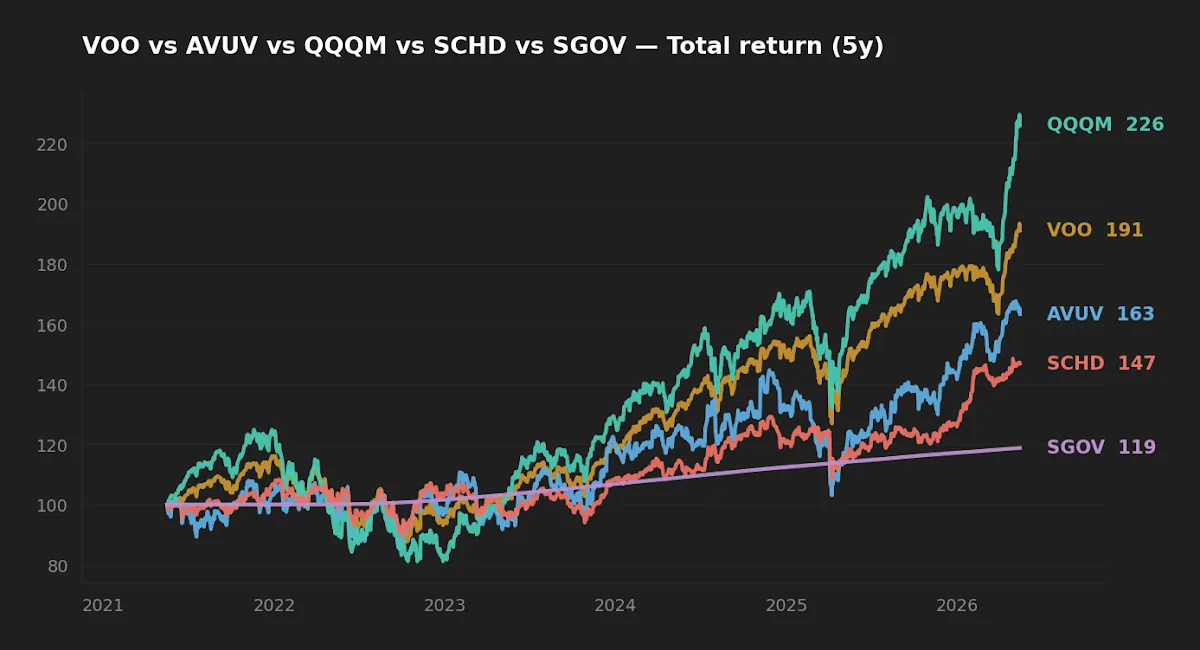
- Across the trailing five years (2021-2026), a defensive blend (VOO 50 / SCHD 30 / SGOV 20) produced a roughly 10.1% blended CAGR, while a growth-tilted blend (VOO 40 / QQQM 35 / AVUV 20 / SGOV 5) reached roughly 14.1% — a 4-point realized wedge driven by QQQM's 17.6% run.
- That wedge sits inside a single regime (low-rate finish, mega-cap tech leadership, sub-20% VIX); rotating away from it could compress the gap quickly.
- The right allocation question isn't "what would have won?" — it's which allocation a specific investor can hold through the next -30% drawdown without selling.
Most allocation arguments collapse into one sentence: "shift 10% toward the higher-return asset and your terminal wealth changes by hundreds of thousands of dollars." The math is correct. It is also nearly useless on its own, because the inputs are unknowable in advance and the realized path includes drawdowns no spreadsheet shows you. The more useful question is how much a 10-point weight shift actually moved a portfolio over the five years yfinance can show us, and what that implies for the decisions an investor controls.
The five building blocks, sized honestly
The original case for this comparison rests on five ETFs that map cleanly to distinct factor and term-structure exposures: VOO (US large-cap beta), QQQM (Nasdaq-100, heavily large-cap growth and tech-concentrated), SCHD (US large-cap dividend value with a quality filter), AVUV (US small-cap value with a profitability tilt), and SGOV (0-3 month Treasury bills, effectively cash). They are not interchangeable wrappers around the same thing — their factor loadings, drawdown profiles, and yield compositions differ materially. That is the entire point of using them as separate sleeves.
Here are the live numbers as of mid-May 2026, pulled directly from yfinance with issuer fact sheets used for expense ratio and AUM:
| Ticker | Expense ratio | AUM | 30-day yield | 5Y CAGR | 10Y CAGR | 5Y vol | 5Y max drawdown |
|---|---|---|---|---|---|---|---|
| VOO | 0.03% | $1,600.2B | 1.1% | 13.9% | 15.6% | 16.8% | -24.5% |
| QQQM | 0.15% | $82.9B | 0.5% | 17.6% | n/a | 22.3% | -35.0% |
| SCHD | 0.06% | $91.1B | 3.3% | 8.2% | 12.7% | 14.4% | -16.8% |
| AVUV | 0.25% | $26.2B | 1.3% | 10.8% | n/a | 22.8% | -28.8% |
| SGOV | 0.09% | $85.2B | 3.9% | 3.5% | n/a | 0.2% | ~0.0% |
Source: yfinance (price/return), issuer fact sheets (expense ratio, AUM). Data pulled 2026-05-16. 10Y data unavailable for QQQM (inception 2020-10), AVUV (2019-09), and SGOV (2020-05). For context: the 10-year US Treasury yields 4.47% and the Fed funds rate is 3.64% as of mid-May 2026 (FRED, asof 2026-05-14 / 2026-04-01) — SGOV's 3.9% yield reflects the front-end of that curve.
Three illustrative portfolios — what the last five years actually delivered
Rather than project a 20-year hypothetical, hold the analysis to a window the data actually covers. Using the 5Y CAGRs above as building blocks, three weight schemes produce the following blended realized returns:
| Portfolio | Weights | 5Y blended CAGR | Realized vol (est.) | Worst component DD |
|---|---|---|---|---|
| A. Defensive | VOO 50 / SCHD 30 / SGOV 20 | ~10.1% | ~12.5% | -24.5% (VOO) |
| B. Balanced | VOO 50 / QQQM 20 / SCHD 15 / AVUV 10 / SGOV 5 | ~13.0% | ~16.5% | -35.0% (QQQM) |
| C. Growth-tilted | VOO 40 / QQQM 35 / AVUV 20 / SGOV 5 | ~14.1% | ~18.5% | -35.0% (QQQM) |
Blended CAGR = weighted sum of component 5Y CAGRs. Realized vol estimated as weighted sum (overstates true portfolio vol because cross-correlations < 1 — actual realized vol would be modestly lower). "Worst component DD" reports the deepest single-fund drawdown in the sleeve, not the portfolio's blended drawdown.
The realized spread between Portfolio A and Portfolio C is about 4 percentage points of CAGR. Mechanically extended at those rates over 20 years on a $1,000/month contribution, A finishes near $770k and C near $1.31M — a gap on the order of $540k. That projection is arithmetic, not a forecast. The five-year window contains exactly one macro regime (the post-2022 rate cycle finish and the AI-led mega-cap rally) and applying that single-regime CAGR forward for two decades is the textbook definition of overfitting to one sample path.
Where the realized risk actually showed up
The headline CAGR gap is what investors notice. The drawdown gap is what makes them sell. Across the same five-year window, QQQM drew down 35.0% peak-to-trough, AVUV 28.8%, VOO 24.5%, SCHD 16.8%, and SGOV essentially nothing (-0.03%). A 35% peak-to-trough decline on the 35% QQQM sleeve of Portfolio C contributes roughly -12.3 percentage points to total portfolio drawdown from that sleeve alone — before VOO and AVUV's own drawdowns are added.
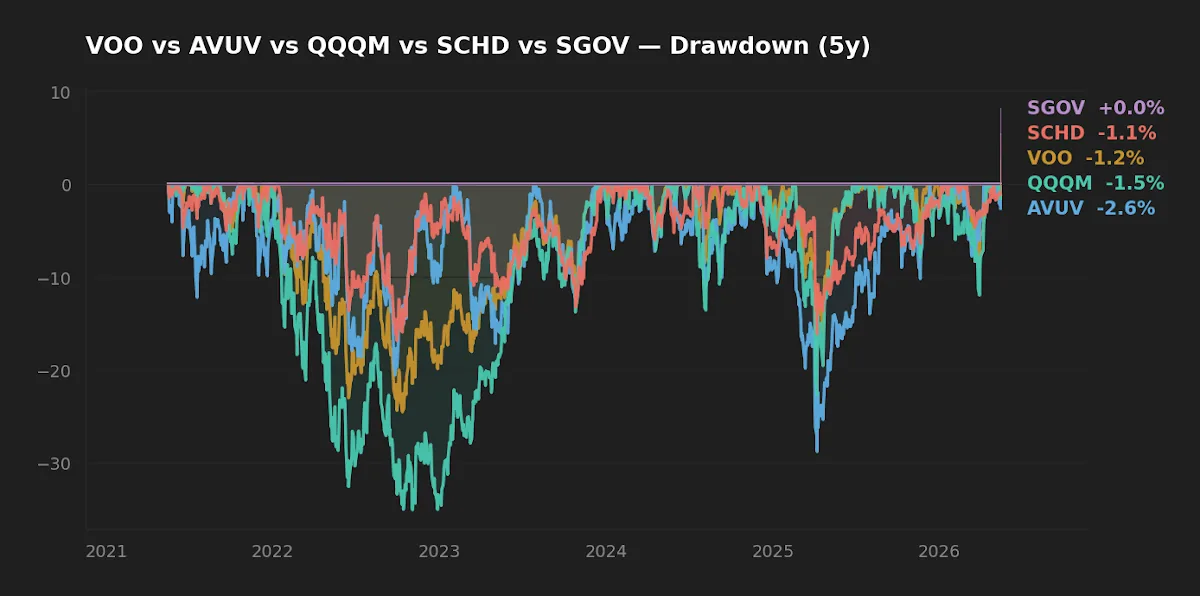
The realized return wedge between a defensive and growth-tilted allocation is real. The behavioral wedge — whether the investor actually stays invested through a 30%+ drawdown — usually decides whether either number gets harvested.
The non-obvious effect: SGOV's role has changed
The interesting structural shift in this five-fund opportunity set is that SGOV is no longer a pure return drag. At a 3.9% trailing yield against ~0% realized drawdown, SGOV's risk-adjusted profile in the current rate regime is materially different from what cash looked like in 2018-2021, when 0-3 month T-bills yielded under 0.5%. An investor who sized SGOV at 20% in 2019 was making a behavioral trade (optionality, sleep-at-night buffer) and paying for it with foregone return. An investor sizing SGOV at 20% in 2026 is collecting roughly 80 bp of incremental portfolio yield versus the prior regime, with the same near-zero drawdown profile. If the Fed cuts substantially over the next 18 months, that math reverts. The point is that "cash drag" is a regime-dependent statement, not a permanent one — and the right cash weight should re-anchor to the current front-end yield rather than to a 2019 reflex.
Why AVUV earns a tilt for some investors, not all
Small-cap value's academic case rests on the Fama-French small and value premia, refined by Asness, Frazzini, and Pedersen with a quality screen — which AVUV's profitability filter operationalizes. The realized 10.8% 5Y CAGR underperforms VOO's 13.9% in the same window, but that gap is not the relevant comparison. The relevant comparison is whether AVUV's return stream is incrementally diversifying against US large-cap beta. Over the trailing five years its correlation to VOO has been meaningfully below 1, which means a 10-20% AVUV sleeve modestly reduces blended portfolio vol relative to its return contribution — even when AVUV underperforms in raw CAGR terms. That is the entire structural argument for the tilt: not "AVUV will beat VOO," but "AVUV's path is partially independent of VOO's." Investors looking for a deeper walk-through of evidence-based factor construction may find the master guide to evidence-based ETF portfolios useful as a methodology reference.
The geometric mean point, restated more carefully
Volatility drag is real: the geometric mean of a return series is always below its arithmetic mean, and the gap widens with vol. But the implication is not "always pick the lower-vol sleeve." It is that comparing two strategies on arithmetic mean returns alone overstates the high-vol strategy's edge. Portfolio C's ~14.1% blended CAGR already incorporates its volatility drag, because CAGR is itself a geometric measure. The honest framing is: at realized 5Y vol of ~18.5% (Portfolio C) versus ~12.5% (Portfolio A), the higher-vol portfolio needs a meaningfully larger arithmetic return to deliver the same compounding benefit — and over the trailing five years it did. There is no guarantee the next five years preserve that relationship.
Scoreboard — winner by category
| Category | Winner | Why |
|---|---|---|
| Cost | Portfolio A | Blended ER ~0.05% vs ~0.11% for C |
| Realized 5Y return | Portfolio C | ~14.1% blended vs ~10.1% |
| Realized 5Y risk | Portfolio A | ~12.5% vol, no sleeve drew down past -25% |
| Behavioral durability | Portfolio A or B | Drawdowns shallow enough for most investors to hold |
| Tax efficiency | Portfolio A or C | SCHD's qualified-dividend tilt vs higher unrealized-gain deferral in growth-tilted |
FAQ
Q: Why not just hold 100% VOO?
That is a defensible choice and outperformed every blend above on raw 5Y CAGR alone if one excludes QQQM. The argument for diversifying away from 100% VOO is not "VOO is bad" — it is that single-fund concentration in US large-cap beta makes the portfolio's realized path entirely a function of one factor's regime. Adding SCHD, AVUV, or SGOV introduces partially independent return streams that reduce path dependence at some cost to expected return.
Q: Is QQQM safe to hold at 35%?
"Safe" is the wrong word — QQQM has drawn down 35% in the last five years and concentrates roughly half its NAV in seven companies. It is appropriate for an investor who has thought through that single-issuer concentration, has a long horizon, and has demonstrated (in actual prior drawdowns, not in self-assessment) that they will not sell at the trough. For investors who have not lived through a -35% portfolio move, sizing closer to 15-20% is more defensible.
Q: What about international exposure?
The portfolios above are deliberately US-only to keep the comparison clean. International developed and emerging exposure (typically via VXUS or similar) is a separate decision; its case rests on currency diversification and the structural drag of US-only concentration over very long horizons. Adding a 10-20% VXUS sleeve to any of the three portfolios is reasonable and worth a separate analysis.
Q: How often should these weights be rebalanced?
The academic rebalancing literature (Daryanani 2008; Vanguard 2024) supports tolerance-band rebalancing — typically ±20% relative drift on any sleeve — over rigid calendar rebalancing. Calendar quarterly checks combined with band-triggered trades minimize unnecessary turnover and capture more of the rebalancing premium.
Q: Does the 4-point CAGR gap really compound to $500k+ over 20 years?
Arithmetically yes; predictively no. The 4-point gap is a single-regime realization, not a forward expectation. The right way to read it is "this is what the wedge looked like in the last cycle" — not "this is what to expect in the next cycle." Forward-looking expected returns for US large-cap growth over the next decade are debated and significantly lower than the trailing 5Y CAGR in most major-house capital market assumptions.
What this comparison can and can't tell you
- It can show what the realized return and drawdown wedge between three weight schemes looked like over a single five-year window using live ETF total returns.
- It cannot tell you what the next five years will deliver. The 2021-2026 window covers exactly one rate cycle finish and one factor regime (mega-cap growth dominance).
- It cannot evaluate sequence-of-returns risk in retirement, tax-lot-level harvest behavior, or the impact of contribution patterns that deviate from steady DCA.
- It does not account for the SGOV yield regime change — at 3.9%, SGOV's role differs materially from 2019 cash drag, and that math reverses if the Fed cuts deeply.
Scenarios where each portfolio fits
- Reader in their 50s, within 10 years of drawdown → Portfolio A. The lower expected terminal wealth is the price of a shallower drawdown profile, which matters increasingly as sequence-of-returns risk dominates.
- Reader in their 30s-40s, 20+ year horizon, has held through a real drawdown → Portfolio B or C. The QQQM and AVUV sleeves require horizon and behavioral capacity that newer investors should not assume they have.
- Reader who has never seen a -25% account move → start closer to Portfolio A and add growth/value tilts gradually after observing one's own behavior in stress.
Editor's read
If forced to pick one for the long-term core, the editor leans toward something closer to Portfolio B — the QQQM and AVUV sleeves are sized small enough to contribute factor diversification without making the portfolio's realized path a single-factor bet. The 4-point CAGR wedge that Portfolio C earned over the trailing five years is real but came with a 35% peak-to-trough drawdown on its largest growth sleeve, and that is a behavioral cost most investors underestimate until they are sitting inside it. The interesting calibration in the current regime is not "more growth versus less" — it is "what does a 3.9% SGOV yield change about how much cash optionality is worth holding?"
Disclosure: the editor holds positions in several of the funds discussed at the time of writing; specific weights and dollar amounts are not disclosed.
Methodology
Price and total-return data pulled from yfinance on 2026-05-16. Five-year CAGR, volatility, and maximum drawdown computed from daily adjusted close over the trailing 5-year window. Expense ratios and AUM cross-checked against issuer fact sheets (Vanguard, Invesco, Schwab, Avantis, iShares) on the same date. Macro context (10Y Treasury, Fed funds, VIX, CPI) sourced from FRED, asof dates as cited. Blended portfolio CAGRs are weighted sums of component CAGRs and do not adjust for cross-correlation effects on realized portfolio volatility. Multi-decade projections in the body are mechanical extensions of trailing 5Y CAGR and should be read as scenario analysis, not forecast.
This article is for educational purposes and does not constitute personalized financial advice. See full Disclaimer.