
The short version
- A -30% drawdown requires a +43% return to break even; -50% requires +100%. The asymmetry is the whole story.
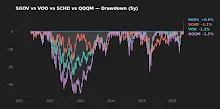
- Across the 2021–2026 window, realized maximum drawdowns ranged from roughly 0.0% (SGOV) to -35.0% (QQQM) — allocation, not stock-picking, did most of the work in determining what each portfolio actually felt.
- The contrarian half of survival is mechanical: rebalancing bands force you to sell the asset that held up and buy the one that fell, without requiring a forecast.
The headline number in any market downturn is the percentage lost. The number that actually matters is the percentage needed to recover, which is always larger. A 10% decline needs 11.1%. A 30% decline needs 42.9%. A 50% decline needs 100%. This convex relationship is not a behavioral observation; it is arithmetic, and it governs every long-horizon plan whether the investor is aware of it or not.
The practical question for a long-term ETF holder is therefore narrower than it looks. It is not "how do I avoid drawdowns?" — markets do not let anyone opt out — but "how do I design a portfolio whose realized drawdowns sit inside a range I can sit through, and whose recovery time does not consume the years I was counting on for compounding?" That question has answers, and most of them are mechanical rather than predictive.
Context: what a -30% portfolio drawdown actually means
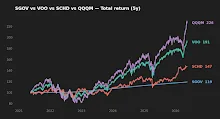
A -30% drawdown on a balanced ETF portfolio is not rare. The S&P 500 itself, via VOO, posted a peak-to-trough decline of -24.5% over the last five years, and that is a single index in a relatively benign macro window. A concentrated tech-heavy holding like QQQM drew down -35.0% over the same period (yfinance, asof 2026-05-16). Add factor tilts, smaller-cap exposure, or single-country bets and the realized number widens further.
What changes the felt experience is not the headline index move but the weighted-average drawdown of the full portfolio — including the sleeve that stayed flat. That is where allocation does its quiet work.
The data: cost, yield, and realized risk by holding
| Ticker | Role | ER | AUM | Yield (TTM) | 5Y CAGR | 10Y CAGR | 5Y Vol | 5Y Max DD |
|---|---|---|---|---|---|---|---|---|
| VOO | US large-cap core | 0.03% | $1,600.2B | 1.1% | 13.9% | 15.6% | 16.8% | -24.5% |
| SCHD | Dividend / quality tilt | 0.06% | $91.1B | 3.3% | 8.2% | 12.7% | 14.4% | -16.8% |
| QQQM | Growth / tech satellite | 0.15% | $82.9B | 0.5% | 17.6% | n/a | 22.3% | -35.0% |
| SGOV | Short-duration cash | 0.09% | $85.2B | 3.9% | 3.5% | n/a | 0.2% | -0.03% |
Source: yfinance for price-based returns, volatility, and drawdowns (window: 2021-05 to 2026-05); issuer fact sheets for expense ratio, AUM, inception, and distribution yield (asof 2026-05-16). 10Y figures unavailable for funds with shorter live histories (QQQM inception 2020-10-13; SGOV inception 2020-05-26).
1. The arithmetic of recovery
Required gain to recover from a drawdown d is 1 / (1 - d) - 1. The function is convex: small drawdowns are nearly symmetric, large ones are punishing.
- -10% → needs +11.1%. Roughly one good month in equities.
- -20% → needs +25.0%. Roughly one year of average S&P returns at the long-run mean.
- -30% → needs +42.9%. Historically two to three years for the S&P 500 to recover, not counting inflation.
- -50% → needs +100%. The 2000–2002 and 2007–2009 cycles required roughly five to seven calendar years to recover in nominal terms.
- -70% → needs +233%. This is the regime where individual stock and concentrated single-factor bets quietly become permanent capital impairment.
The second-order effect is what this does to time. Compounding is multiplicative: years spent recovering are years not spent compounding above the prior high. A 30% drawdown that takes three years to recover does not just cost the 30% — it costs the foregone compound return on the entire balance during those three years. For a 30-year-old with a 30-year horizon, this is the difference between two and three doublings by retirement.
2. Allocation, not selection, set the realized drawdown
The 5-year realized drawdowns above are the input that matters. A portfolio held entirely in QQQM lived through -35.0%. A portfolio held entirely in SGOV lived through essentially zero. Every intermediate mix produces an intermediate result, and weighted-average drawdown is a close-enough first approximation when correlations are not extreme.
Consider three illustrative mixes during the same window:
- 100% VOO: -24.5% trough, 13.9% 5Y CAGR.
- 70% VOO / 30% SGOV: approximate weighted trough roughly -17%, 5Y CAGR roughly 10.8%. Roughly 3 points of return given up; roughly 7 points of trough avoided.
- 50% VOO / 20% SCHD / 20% QQQM / 10% SGOV: approximate weighted trough roughly -22%, 5Y CAGR roughly 12.7%. The growth satellite raises both return and worst-case loss; the cash sleeve dampens both.
These are rough first-order numbers, not regression-fit estimates. The point is simply that the lever moving realized drawdown most reliably is the allocation slider — not the selection of any specific dividend, factor, or sector fund.
Required recovery is convex in drawdown size, which is why protecting against -50% matters categorically more than smoothing out -10%. The same dollar of risk reduction is not equally valuable in every tail.
3. Rebalancing bands: the contrarian half of survival
Rebalancing is the part of the plan that does the emotionally difficult work for you. The academic literature on threshold-based bands (Daryanani 2008; Vanguard rebalancing research, 2024) suggests that wide drift bands — roughly ±15% relative for core sleeves and ±25% for satellites — capture most of the rebalancing premium while minimizing transaction frictions and tax drag.
The mechanics during a -30% equity decline are straightforward and unsentimental:
- Equity sleeve falls below its band. A 70% VOO target sitting at, say, 56% after a sharp decline has breached the ±15% relative band (70% × 0.85 = 59.5%).
- Cash or bond sleeve drifts above its band. The SGOV sleeve held its value while equities fell, so it is now overweight.
- The mechanical action is to sell the overweight and buy the underweight. This is buying equities precisely when the screen is uncomfortable to look at.
This is not a forecast. It is bookkeeping that happens to be contrarian. The investor does not need to know whether the market has bottomed; the bands fire when drift is large enough to matter, and they fire again on the way back up in the opposite direction. Sequence-of-returns risk — the case where a deep drawdown arrives in the years closest to a withdrawal need — is exactly the scenario where this discipline has the largest expected payoff (see the sequence-risk article for the long-form treatment).
4. Behavior: what the investor actually does in the drawdown
The most expensive errors in a downturn are not portfolio errors. They are behavioral. Three observations from looking at retail brokerage data and one's own past mistakes:
- Watching unrealized P&L every day inflates perceived loss. Daily checking turns one large drawdown into many small painful events. Weekly or monthly review captures the same information with materially less emotional load.
- Share-count framing is more honest than price framing during accumulation. For an investor still adding to positions, the relevant question is "how many shares of the core funds do I now own?" not "what is the screen value today?" Share count is monotonic; screen value is not.
- Pre-committed rules outperform real-time decisions. Writing the rebalancing rule down before the drawdown is the difference between executing and freezing. The decision is hard in the moment because it is supposed to be — the asset is falling for reasons that feel persuasive.
For readers in the accumulation phase specifically, the foundational behavioral framing is covered in the long-term ETF beginner guide; for those rotating in the current regime, see the 2026 portfolio rotation note.
5. Macro overlay: the cash sleeve is not free this cycle
Holding cash equivalents has a real opportunity cost in most decades. In the current one, less so. SGOV's 3.9% trailing yield sits against a 10-year Treasury at 4.47% and a Fed Funds rate of 3.64% (FRED, asof 2026-05-14 and 2026-04-01 respectively). CPI YoY of 3.95% (FRED, asof 2026-04-01) means the real yield on short-duration Treasuries is roughly flat to mildly positive — the cash sleeve is paying close to inflation while doing its job of dampening drawdowns. VIX at 17.26 indicates a relatively calm regime, which historically is when allocation discipline matters most: nothing feels urgent, and bands drift unnoticed.
Scoreboard: which fund wins by category
| Category | Winner | Reason |
|---|---|---|
| Lowest cost | VOO (0.03%) | Half the next-cheapest fund on the list; structural advantage at scale. |
| Lowest realized drawdown | SGOV (-0.03%) | By construction; the trade-off is the lowest CAGR. |
| Highest realized return (5Y) | QQQM (17.6%) | Earned at the cost of -35.0% trough and 22.3% volatility. |
| Suitability as a long-term core | VOO | Broadest base, lowest fee, most academic support; satellites optional. |
FAQ
Q: How much cash should sit in the portfolio?
A: There is no universally correct answer. As a starting point, a sleeve sized to cover 6–24 months of needed withdrawals (or fixed expenses) is common, with the upper end of that range during the years closest to a withdrawal phase. The cash sleeve's job is to remove the need to sell equities during a drawdown, not to time the market.
Q: Is SCHD a substitute for bonds or cash in a drawdown?
A: No. SCHD's 5-year max drawdown of -16.8% is lower than VOO's -24.5%, but it is still an equity fund and correlated with the broader market in stress. It is a quality/yield tilt, not a defensive sleeve.
Q: Should I move to cash before the next downturn?
A: The data on market timing by retail and professional investors alike does not support it as a net-positive activity over long horizons. The more defensible decision is to size the cash sleeve up front so that the question never has to be asked under stress.
Q: How often should I rebalance?
A: The Vanguard 2024 rebalancing study and earlier Daryanani 2008 work both suggest that threshold-based bands (e.g. ±15% relative for core, ±25% for satellites) checked monthly, with rebalancing only when a band is breached, is roughly as good as calendar rebalancing while reducing turnover and tax drag.
Q: What about gold as a defensive sleeve instead of short-duration Treasuries?
A: Gold has historically diversified equity drawdowns but carries its own large volatility and no yield. Short-duration Treasuries currently yield close to inflation with negligible price risk. The case for each is discussed in the gold vs SGOV note.
What this analysis can and cannot tell you
The 5-year window covers one large drawdown (2022), a sharp recovery, and a relatively benign 2024–2026 regime. It does not cover a 2008-scale credit event, a prolonged stagflation, or a true lost decade for US equities. The realized drawdowns above should therefore be treated as a lower bound on what these funds can deliver, not a representative sample of long-term tail risk. Volatility and CAGR figures are price-based and may understate total return for the dividend funds slightly.
Scenarios where each allocation fits
- Reader in their 30s, fully employed, 25+ year horizon, no near-term withdrawals: a core-heavy mix (e.g. predominantly VOO with optional QQQM satellite) tolerates the wider drawdown range because time is the rebuilder. A small SGOV sleeve still earns its keep by enabling rebalancing without new cash.
- Reader within 5–10 years of a withdrawal need: the cash sleeve should be sized so that 1–2 years of needed outflow never requires selling equities at a trough. SCHD's lower drawdown profile starts to matter more relative to QQQM here.
- Reader already drawing down the portfolio: sequence risk dominates. A meaningfully larger SGOV / short-duration sleeve plus a quality-tilted equity sleeve (SCHD-like) reduces the probability that any single year forces a sale into a drawdown.
Editor's read
The data keeps returning the same conclusion: the lever that matters most for whether a long-term plan survives is allocation, and the second is whether rebalancing actually executes when it is supposed to. Fund selection within a sleeve is third-order. If forced to pick the single most under-appreciated discipline, the editor would name pre-committing the rebalancing bands in writing — not because the rule is clever, but because writing it down before the drawdown is what makes it executable inside one. Faithfulness in small, boring steps is what compounds.
Editor's holdings disclosure: the editor holds VOO, SCHD, and SGOV at the time of writing; does not hold QQQM directly.
Methodology. Price-based returns, volatility, and maximum drawdown computed from daily adjusted-close data via yfinance over the window 2021-05-16 to 2026-05-16. Expense ratio, AUM, distribution yield, and inception dates from each issuer's fact sheet (Vanguard, Schwab, Invesco, iShares), asof 2026-05-16. Macro figures from FRED: 10Y Treasury asof 2026-05-14, Fed Funds Rate asof 2026-04-01, VIX asof 2026-05-14, CPI YoY asof 2026-04-01. Required-recovery math is closed-form: r = 1 / (1 - d) - 1.
This article is for educational purposes and does not constitute personalized financial advice. See full Disclaimer.