
The short version
- Sequence-of-returns risk is path-dependent: identical 30-year averages produce wildly different outcomes once withdrawals start, because losses early in decumulation are funded by selling shares at depressed prices.
- The defense is structural, not predictive — a short-duration cash sleeve (e.g. SGOV) sized to cover 1-2 years of spending, a stable-income sleeve (e.g. SCHD), and a growth sleeve (VOO, QQQM, VXUS) given the full horizon to recover.
- Rebalancing bands (Daryanani 2008; Vanguard 2024) turn the structure into a behavior — you spend from cash when equities are down and refill cash from equities when bands are breached.
Most 30-year planners optimize for one number: the long-run average return. That number is necessary but not sufficient. Once the portfolio enters decumulation, return order starts to matter as much as return magnitude — and order is something no investor can forecast. The question that follows is not "what is my expected return?" but "what structure makes my plan robust to a bad first decade?"
Context: why path matters once you start withdrawing
During accumulation, sequence of returns is largely irrelevant. A 7% average across 30 years compounds to the same terminal value regardless of which years carry the gains and which carry the losses, because there are no withdrawals to crystallize a bad print. Decumulation breaks that symmetry. Selling shares to fund living expenses while prices are depressed permanently removes those shares from the future recovery — a loss the average return calculation never sees.
This is not a 2026-specific problem. The 2000-2002, 2008, and 2020 drawdowns each produced a cohort of retirees who experienced identical long-run averages but very different real outcomes. What is specific to 2026 is the macro backdrop: 10-year Treasury yield 4.47%, fed funds 3.64%, CPI YoY 3.95%, VIX 17.26 (FRED, as-of 2026-05-14 and 2026-04-01). Cash and short-duration Treasuries are paying real positive yields for the first time in over a decade, which changes the cost of holding a defensive sleeve.
The instruments: realized risk and return, five-year window
Before discussing structure, look at the actual numbers on the five tickers most retail readers reach for. All figures are computed from yfinance daily total-return data for the trailing five years through 2026-05-17 unless otherwise noted. Expense ratios and AUM are from each issuer's product page.
| Ticker | Role | ER | AUM | Yield (TTM) | 5Y CAGR | 10Y CAGR | 5Y Vol | 5Y Max DD |
|---|---|---|---|---|---|---|---|---|
| SGOV | Cash sleeve | 0.09% | $85.2B | 3.9% | 3.5% | n/a | 0.2% | -0.0% |
| SCHD | Income sleeve | 0.06% | $91.1B | 3.3% | 8.2% | 12.7% | 14.4% | -16.8% |
| VOO | Core growth | 0.03% | $1,600.2B | 1.1% | 13.9% | 15.6% | 16.8% | -24.5% |
| QQQM | Growth tilt | 0.15% | $82.9B | 0.5% | 17.6% | n/a | 22.3% | -35.0% |
| VXUS | Ex-US diversifier | 0.05% | $629.1B | 2.8% | 8.5% | 9.7% | 16.0% | -29.4% |
Sources: yfinance (NAV and total-return series, pulled 2026-05-17); iShares, Vanguard, Schwab, Invesco issuer pages (ER, AUM, inception, distributions).
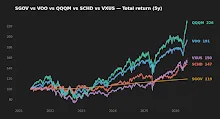
How sequence risk actually compounds — the mechanic, not the metaphor
Consider two retirees, both starting with the same balance, both withdrawing the same real dollar amount each year, both earning the same arithmetic mean return over 30 years. Retiree A faces a -25% drawdown in years 1-2 and modest gains thereafter. Retiree B faces strong gains in years 1-2 and the same -25% drawdown 10 years in. Identical averages, identical contributions, identical withdrawals. The portfolios diverge by tens of percent in terminal value, and Retiree A's failure probability — the chance of running out of capital before death — is several multiples higher.
The reason is that the early drawdown forces the sale of more shares per dollar of spending. Those shares are not available to participate in the recovery that the average return implicitly assumes. In quant terms, geometric return is path-dependent under cash flows; arithmetic return is not. Bengen's original safe-withdrawal work and every Monte Carlo study since has converged on the same conclusion: the worst real-world outcomes cluster in cohorts that retired into the first leg of a bear market.
This is why a planner who only optimizes expected return — picking the highest-CAGR fund in the table above — is solving the wrong problem at the wrong life stage. QQQM's 17.6% five-year CAGR is real, but so is its 35.0% drawdown, and a 35% drawdown in year one of withdrawals is mathematically very different from the same drawdown in year fifteen of accumulation.
Realized drawdowns: the data the average doesn't show you
Trailing five years covers a single market regime — post-COVID stimulus, the 2022 rate-shock drawdown, and the subsequent AI-driven rally. It is not a complete sample of what equities can do, and a 1929 or 2000-style multi-year compression is not in this window. Even so, the drawdown profile is instructive.
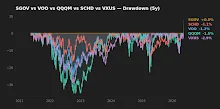
SGOV's max drawdown rounds to zero — it is a duration-controlled Treasury vehicle and behaves like cash with a coupon. SCHD's 16.8% maximum drawdown reflects its quality-and-dividend screen, which mechanically excludes the most volatile growth names. VOO at -24.5% and VXUS at -29.4% are typical of broad-cap and ex-US equity, respectively. QQQM at -35.0% is the cost of concentrated tech-growth exposure.
For a retiree, the relevant question is not "what is each fund's drawdown?" but "what does the portfolio drawdown look like in the realized year I have to start spending?" A 100% QQQM retiree drawing 4% real in 2022 would have sold near the bottom of a 35% decline. A retiree with an SGOV buffer covering two years of expenses would have spent from the buffer and left the equity sleeve untouched to recover.
Sequence risk is not solved by predicting the next bear market. It is solved by building a structure that makes the next bear market financially survivable without selling equities into it.
The defensive structure: cash sleeve, income sleeve, growth sleeve
The three-sleeve approach is not novel — variants appear in the bucket-strategy literature going back decades, and the underlying logic is consistent with the time-segmentation work in retirement-income research. The editor's framework treats it as a behavioral structure first and an asset-allocation structure second.
Cash sleeve (1-2 years of spending). Short-duration Treasuries — SGOV is the cleanest expression — pay a real positive yield in the current macro regime (3.9% TTM yield against 3.9% headline CPI YoY) and carry essentially zero mark-to-market risk. The purpose is not to outperform; the purpose is to be the funding source when equities are down so that the equity sleeve is never the marginal seller.
Income sleeve (3-7 years of spending). Dividend-quality strategies like SCHD provide a relatively stable cash flow that does not require selling principal when prices are depressed. SCHD's distribution growth track record is the relevant variable here, not its capital appreciation. Treat distributions as a secondary spending source that bridges between the cash sleeve and the growth sleeve.
Growth sleeve (10+ year horizon). Broad-cap equity (VOO), ex-US equity (VXUS), and optionally a quality-growth tilt (QQQM) carry the long-horizon return engine. Their drawdowns are larger and more frequent, which is exactly why this sleeve must not be touched in years one or two of a bear market. The case for diversifying beyond VOO rests on factor and geography exposures the headline US large-cap index does not provide.
Rebalancing bands: how the structure becomes a behavior
Static allocation drifts. Without a rule, the cash sleeve gets refilled at the wrong time — usually after the equity drawdown is already underway. Daryanani (2008) showed that opportunistic rebalancing using tolerance bands (typical bands ±15% to ±25% of target weight) outperforms calendar rebalancing on a risk-adjusted basis. Vanguard's 2024 research note on rebalancing strategies reaches a compatible conclusion: rules-based bands, not predictions, drive most of the realized benefit.
Applied to the three-sleeve structure: when the equity sleeve drifts more than its band below target (because of a drawdown), the cash sleeve funds spending without refill, and the planner waits. When the equity sleeve drifts above its band (because of strong returns), excess gains rotate into the cash and income sleeves, mechanically restoring the buffer at high prices. The behavior is not "buy low, sell high" as a slogan — it is "refill cash when equity is high, spend from cash when equity is low," which is the same thing expressed as a rule a tired human can execute. Related reading: when to stop adding to the growth sleeve and the 4% rule under 2026 conditions.
Scoreboard: which sleeve each fund fits
| Category | Best fit | Why |
|---|---|---|
| Cash sleeve | SGOV | 0.2% realized vol, ~0% max DD, 3.9% TTM yield. Behaves like cash; pays like a coupon. |
| Income sleeve | SCHD | 3.3% yield, 12.7% 10Y CAGR, max DD held to -16.8%. Quality-and-dividend screen damps drawdowns vs. broad market. |
| Core growth sleeve | VOO | 0.03% ER, $1.6T AUM, 15.6% 10Y CAGR. The lowest-friction expression of US large-cap equity. |
| Growth tilt | QQQM | 17.6% 5Y CAGR comes with -35.0% drawdown. Reasonable as a tilt; structurally wrong as a retiree's only equity sleeve. |
| Ex-US diversifier | VXUS | Single ticker for ~8,500 ex-US names. Materially different factor and currency exposure than VOO; 9.7% 10Y CAGR. |
FAQ
Q1. Does sequence-of-returns risk affect investors still in the accumulation phase?
Largely no. Without withdrawals, return order does not change terminal value for a given arithmetic mean. The case for a cash buffer during accumulation is liquidity and behavioral, not sequence-risk-driven.
Q2. Why short-duration Treasuries (SGOV) instead of an aggregate bond fund?
Aggregate bond funds carry duration risk. In 2022, a popular intermediate aggregate bond ETF posted a drawdown of roughly -17%, which is not the behavior wanted from the cash sleeve. SGOV's effective duration is under three months; its 5Y max drawdown is essentially zero.
Q3. How large should the cash buffer be?
The retirement-income literature converges on 1-3 years of spending. Two years is a reasonable default in the current macro regime where SGOV pays 3.9% TTM yield against 3.9% headline CPI YoY (FRED, as-of 2026-04-01) — the opportunity cost of carrying cash is small.
Q4. Doesn't SCHD's lower CAGR cost too much over a 30-year horizon?
SCHD's 10-year CAGR is 12.7% versus VOO's 15.6%. Over a long horizon, that is a real gap. The argument for SCHD in the income sleeve is not return maximization — it is distribution stability, which reduces forced selling. A retiree with adequate buffer + income sleeves can afford to leave the growth sleeve untouched during drawdowns.
Q5. What does the five-year sample not capture?
Two things matter. First, the sample does not include a multi-year secular bear like 2000-2002 — the worst-case sequence is not in the window. Second, QQQM's 5Y CAGR reflects a regime in which growth concentration was rewarded; the next decade need not look like the last one.
What this analysis can and cannot tell you
It can tell you, with reasonable confidence, how each of these five instruments behaved over a specific five- or ten-year window, what their realized drawdown profile looks like, and how a three-sleeve structure responds to drawdowns mechanically. It can also frame the rebalancing literature accurately.
It cannot tell you what the next 30 years will look like. Five years is a single regime sample. Ten years is two. The worst sequences in the historical record — 1929-1932, 1973-1974, 2000-2002 — are not in either window. A robust plan does not rely on the next decade resembling the last.
Scenarios where each instrument fits
- Reader 15+ years from retirement, accumulation phase, single-account: sequence risk is not yet the binding constraint. A growth-heavy mix (VOO + VXUS + optional QQQM tilt) with a small SGOV slice for liquidity is structurally reasonable.
- Reader 3-5 years from retirement: begin building the cash sleeve from new contributions rather than by selling appreciated equity. SCHD added incrementally to start the income sleeve.
- Reader in first year of withdrawals: the cash sleeve should already be funded for 1-2 years; the equity sleeve should not be the marginal seller. Rebalance only on band breaches, not on a calendar.
Editor's read
Sequence-of-returns risk is one of the few problems in personal finance where the cleanest solution is structural rather than predictive. A well-sized SGOV sleeve and a rebalancing rule purchase real optionality: the right to not sell equities at the worst moment. The five-year numbers in the table above are interesting, but the editor would weight the rebalancing-band literature (Daryanani 2008; Vanguard 2024) more heavily than any single CAGR figure when designing a 30-year decumulation plan.
Editor's holdings: the editor holds positions in SGOV, VOO, SCHD, and VXUS at the time of writing and does not hold QQQM.
Methodology: NAV and total-return series pulled from yfinance on 2026-05-17, trailing five-year window. Expense ratio, AUM, and inception data from issuer product pages (iShares, Vanguard, Schwab, Invesco). Macro figures from FRED, as-of dates 2026-05-14 (10Y Treasury, VIX) and 2026-04-01 (fed funds, CPI). All CAGR, volatility, and drawdown figures are computed from daily total-return series and rounded for display. The analysis covers a single market regime; do not extrapolate it as a forecast.
This article is for educational purposes and does not constitute personalized financial advice. See full Disclaimer.