
The short version
- "When should I stop investing?" almost always loses to "what rebalancing rule did I write down when I wasn't anxious?" The empirical record on indicator-driven retail timing is consistently unkind to the question's premise.
- With the 10-year Treasury at 4.47% and headline CPI at 3.9% (FRED, May 2026), short-duration cash earns only a sliver of positive real yield, but the carrying cost is the lowest it has been since 2007.
- The disciplined version of "stopping" is mechanical: a drift-band rebalance trims overweights toward target without requiring a market call. It is boring on purpose.
The question "when should I stop investing?" almost always arrives in the wrong tense. By the time it shows up — usually deep in a bull market, after a colleague has explained why the next move is obvious — the asker has already accepted that timing is the right frame for a multi-decade horizon. The harder work is to replace the frame, not to answer the question on its own terms.
What follows is the replacement: a pre-committed rule, written down before the next stress event, and applied without a market view. The macro backdrop matters here only as context, not as trigger. As of mid-May 2026, the 10-year Treasury sits at 4.47%, the federal funds rate at 3.64%, the VIX at 17.3, and headline CPI at 3.9% year-over-year (FRED, as-of dates cited inline below). Those are normalized-cycle numbers, not crisis numbers. The point of this article is what they imply for the structure of a long-horizon allocation — not what they predict about the next twelve months.
The CAPE indicator and the ETF that tries to operationalize it
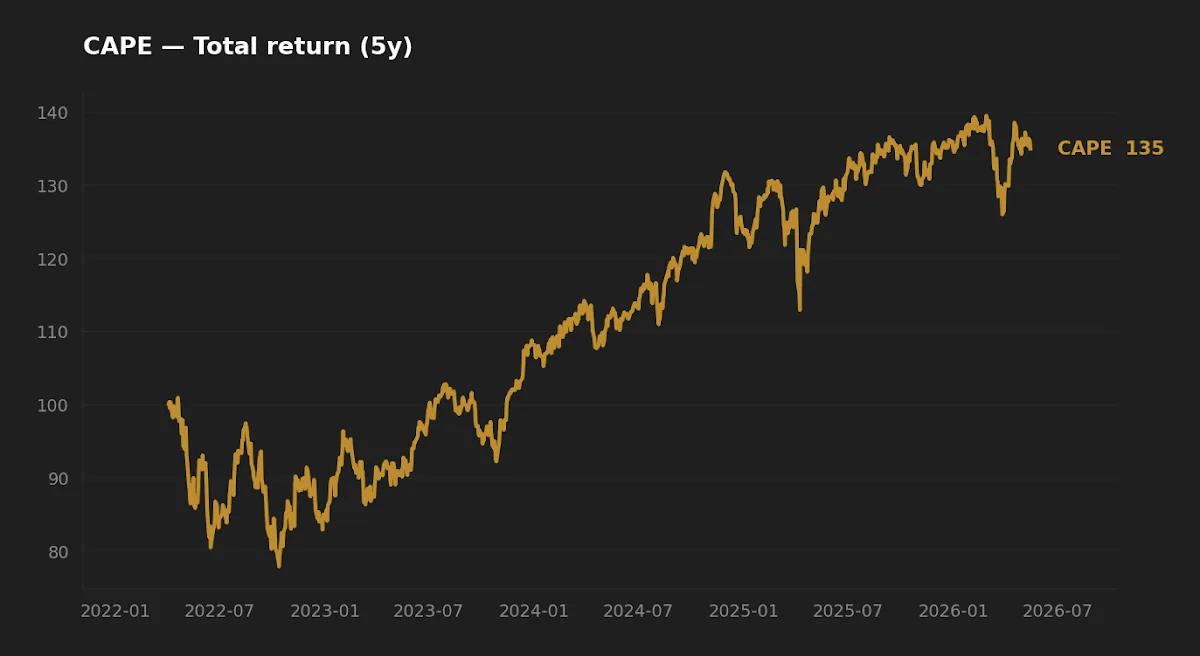
The most-cited piece of evidence in "is the market expensive?" debates is Robert Shiller's Cyclically Adjusted Price-to-Earnings ratio (CAPE) — a smoothed valuation measure that has reliably negatively correlated with subsequent 10-year equity returns. Some investors take the next logical step and ask: can a fund operationalize that signal? DoubleLine and Barclays built one. It is a useful concrete example to anchor a more abstract discussion.
| Field | CAPE — DoubleLine Shiller CAPE U.S. Equities ETF |
|---|---|
| Expense ratio | 0.65% |
| AUM | $0.27B |
| Inception | 2022-03-31 |
| Dividend yield | 1.4% |
| NAV | $32.15 |
| Issuer fact sheet | doublelineetfs.com/cape |
Data: yfinance and DoubleLine, fetched 2026-05-16. CAPE rotates among the four U.S. equity sectors trading at the largest discount to their long-run CAPE — a rules-based attempt to harvest the same insight Shiller's research articulates. The track record is too short to draw confident conclusions (less than four years since inception), and the 0.65% expense ratio compounds against the strategy. The relevant point for this article is that the indicator itself is real, durable, and well-evidenced on a 10-year horizon — but acting on it tactically, even via a purpose-built fund, is a meaningfully different problem.
Where the timing impulse is honest, and where it stops being so
The instinct is not stupid. Forward P/E ratios on US large-caps drift above long-run averages in late cycles. Implied volatility compresses to levels that historically precede stress. The financial press finds an audience for "this looks like 1999" essays at almost any S&P 500 level above its long-term moving average. None of this is wrong as observation. It is wrong as actionable signal, and the gap between those two is wider than most retail content treats it.
Sharpe's 1991 essay "The Arithmetic of Active Management" framed the core problem: timing is zero-sum before fees and negative-sum after them. For every investor who exits before a drawdown, another holds the bag, and the cost of being wrong — missing a 20% recovery, sitting in cash through a multi-year run — compounds asymmetrically against the timer. Vanguard and DALBAR studies have repeatedly measured a multi-hundred-basis-point gap between fund returns and the actual returns earned by retail investors in those same funds. That gap is the price of letting indicators drive the contribution decision.
Long-horizon valuation work — Shiller's CAPE, Vanguard's 10-year capital market assumptions — does suggest high starting valuations correlate with lower decade-forward returns. But "valuations matter on a 10-year horizon" is a long way from "sell today because forward P/E is 22x." The second requires you to know what comes next over the following eighteen months, and the historical hit rate on that approximates a coin flip with friction added. For the underlying definition of what risk actually measures, see What Is Risk in ETF Investing?.
The rule that replaces the call
Mechanical rebalancing is the disciplined alternative, and the academic version is well-documented. Daryanani's 2008 paper on opportunistic rebalancing argued for rebalancing when an asset's weight drifts a chosen percentage from target — not on a fixed calendar — because the calendar misses real drift in volatile markets and trades unnecessarily in quiet ones. Vanguard's 2024 update on rebalancing methodology found that ±15% to ±25% relative deviation from target weight (a 60% target sleeve trips a rebalance at roughly 51% or 69%) captures most of the risk-management benefit without the taxable-account churn that tighter bands generate.
The important property of these rules is that they do not require a market call. If your equity allocation is target 70% and has drifted to 76% because the rally pulled it there, the rule says trim back to target. If it drifts to 64% in a sell-off, the rule says buy back to target. In both cases you are doing exactly what indicator-driven timing thinks it is doing — selling expensive, buying cheap — except on a pre-committed rule, where the cost of being wrong is a small turnover instead of a 24-month sit-out. For the recovery arithmetic during drawdowns, see Buy the Dip or Wait and See? The Brutal Math Behind Market Crashes, which shows why drawdown depth dominates timing precision in long-horizon outcomes.
A drift-band rebalance trims your overweights for you when you are calm. Indicator-driven exits ask you to act when you are anxious. Almost every long-run study suggests the first beats the second by a margin you can measure.
Realized risk: what drawdowns look like in practice
Below is CAPE's drawdown profile since inception — a small, short window, but a useful visual reminder that even a quantitatively rules-based equity strategy with academic backing experiences ordinary equity drawdowns. The shape of the line is the point; the magnitudes are sample-dependent.
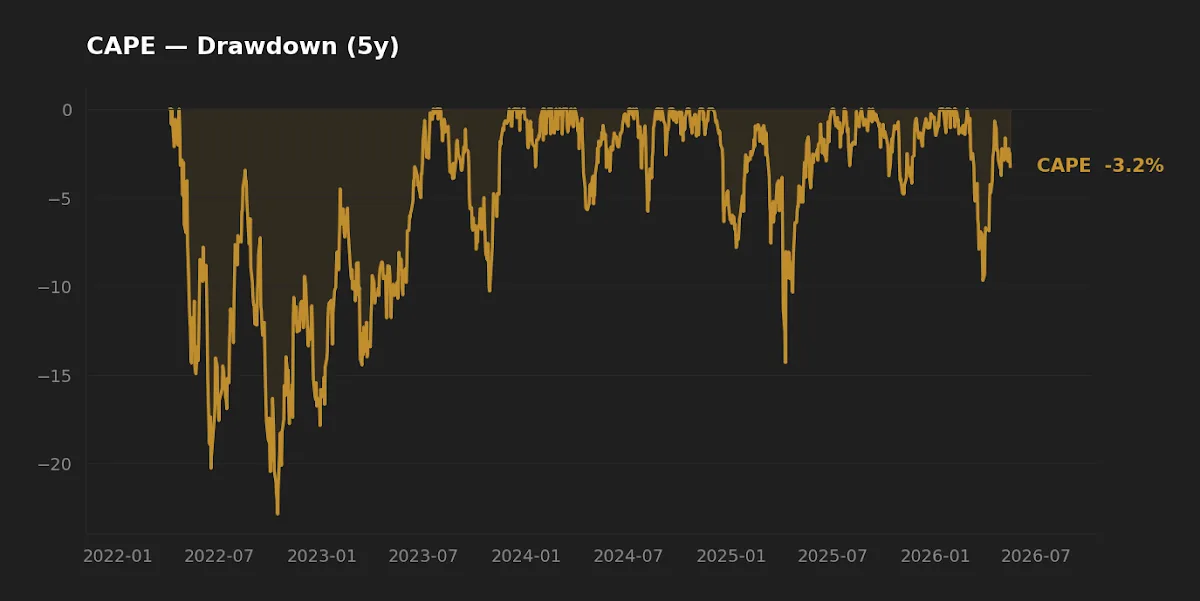
A pre-committed rebalance band does not predict where the next drawdown trough sits. It just means a 30% equity drawdown does not require a 30% behavioral decision. The rule has already specified what to do; execution becomes mechanical, and the conversation in the household becomes shorter.
Cash math has changed — but the principle hasn't
Through most of the 2010s, the case against holding cash inside a long-horizon allocation was straightforward. Short Treasuries paid 0–0.5% nominal, inflation ran roughly 2%, and the real yield on a cash sleeve was meaningfully negative. A 10% buffer cost something visible every year.
That regime has shifted, though not as dramatically as 2023-era headlines suggested. The 10-year Treasury yields 4.47% (FRED, as of 2026-05-14). The federal funds rate sits at 3.64% (FRED, as of 2026-04-01). Headline CPI ran 3.9% year-over-year (FRED, as of 2026-04-01). Subtracting headline CPI from the 10-year leaves a real yield around 0.5% — small, positive, and meaningfully different from the deeply negative real yields of the 2010s, but well below the 1.5–2% real yields that prevailed before 2008.
The implication is not "go to cash." It is that the marginal cost of holding a 5–10% short-duration sleeve as part of a structured allocation has compressed materially. A buffer that once leaked roughly 1.5% real per year now leaks close to nothing real, while preserving its function: it is the part of the portfolio that does not move when equities draw down, and the part that funds rebalancing buys without requiring fresh contributions or selling other holdings. Cash held inside an allocation, sized to a target, with a redeployment rule, is not "out of the market." It is part of the structure.
"Pause" vs "exit" — what stopping actually looks like
Most readers asking the timing question are not actually asking about exit. They are asking whether to keep deploying new contributions into a market that feels late. That is a narrower question with a more tractable answer.
For tax-advantaged accounts (IRA, 401(k), Roth), redirecting contributions is essentially free. If your equity allocation is 6% above target, directing the next three months of contributions into the underweighted sleeve — international, small-cap, or fixed income, depending on what has lagged — accomplishes a partial rebalance without realizing gains. It has the underrated property of being psychologically easier than selling: you are not "exiting" anything, you are choosing where to add.
For taxable accounts, the calculus is different. A trim that crosses a long-term capital-gains threshold may cost more in taxes than the rebalancing benefit recovers, particularly for higher-bracket investors. Tax-aware rebalancing — using contributions, dividends, and tax-loss harvesting before triggering taxable sales — extends the mechanical rule into a tax-conscious version. In a taxable account, the bar to actively sell an overweight is higher, and the contribution-redirect approach is usually preferred until drift becomes severe. For a five-stage walkthrough of how the same discipline holds up when stress arrives, see Investing at the Worst Possible Time?.
What this framework can and cannot tell you
The honest limits matter, because skipping them is the move that turns a research blog into noise.
First, none of the rebalancing literature predicts what the next drawdown will look like — only that one will eventually arrive, and that pre-committed rules tend to outperform discretionary judgment when it does. The 2020 COVID drawdown lasted weeks. The 2008 drawdown took roughly five years to recover in real terms. The 1968–1982 sideways market had its own rhythm. A drift-band rule responds to all three reasonably; an indicator-driven exit needs a different correct answer for each, and the historical record on getting that right consistently is thin.
Second, rebalancing has a regret profile worth naming. In a sustained bull market — like the 2010s for US equities — bands trim winners that keep winning, which mathematically reduces realized return versus a no-rebalance baseline. The benefit shows up in risk-adjusted return and in drawdown survival, not in a total-return horse race. Even disciplined rules underperform a hypothetical perfect-timing strategy — they just outperform every achievable approximation of one, which is the comparison that matters for an investor with one life and one portfolio.
FAQ
Is the current macro environment (10Y at 4.47%, CPI 3.9%) a warning sign? The data describe a normalized rate environment with sticky inflation, not a crisis. The VIX at 17.3 (FRED, as of 2026-05-14) sits below its long-run mean of roughly 19–20. None of this argues for an exit; it argues for sizing fixed income to a yield that finally compensates for it.
If I'm 100% equities, am I doing it wrong? Not necessarily. For an investor with a 30+ year horizon, no anxiety about drawdowns, and stable income outside the portfolio, full equity exposure is defensible. The case requires that you actually behave that way through a 50% drawdown — rarer in practice than 100%-equity investors estimate in advance.
How do I pick a rebalancing band? The literature converges on ±15% to ±25% relative drift from target weight (Daryanani 2008; Vanguard 2024). Tighter bands reduce drift but increase tax friction; wider bands reduce friction but allow more risk migration. For most retail investors holding broad ETFs, ±20% relative is a reasonable starting point.
Should I add cash because I'm worried right now? If "worried right now" is doing the work, usually no — that is the timing impulse the rule is supposed to replace. If your target allocation includes a short-duration sleeve that has drifted underweight because equity outperformed, then yes, but for structural reasons rather than predictive ones.
Does a CAPE-rotation strategy like the DoubleLine fund solve the timing problem? Partially, on paper. It systematizes the valuation signal Shiller's research validates, which removes the behavioral problem of deciding when to act. The trade-offs are a 0.65% expense ratio, a sub-$0.3B AUM that constrains capacity and bid-ask economics, and a short live track record (inception 2022-03-31). It is a coherent satellite expression of a valuation tilt, not a substitute for a rebalancing rule on the broader allocation.
Key takeaways
- Indicator-driven timing has a poor empirical track record at the retail level. Pre-committed rebalancing rules are the disciplined replacement.
- Drift-band rebalancing (Daryanani 2008; Vanguard 2024) trims overweights and adds to underweights without requiring a market call.
- In 2026, with short Treasuries paying a small positive real yield post-CPI, a structural cash sleeve is closer to free than it was through the 2010s — which changes the math without changing the principle.
- For long-horizon investors, the right version of "stopping" is usually redirecting contributions, not exiting positions — particularly in taxable accounts.
- None of this predicts the next drawdown. It just makes one survivable.
Editor's read
The honest answer to "when should I stop investing" is "when your rule says to, not when your gut does." The editor runs an in-house weekly portfolio review against pre-set drift bands and treats discretionary deviation as something to be earned, not the default. The current macro picture — moderate inflation, slightly positive real short rates, a modest VIX — does not, on its own, argue for moving to cash. It argues for letting the allocation work, sizing the cash sleeve to a yield that now actually compensates for it, and being suspicious of any framework that claims to know what 2027 will look like. The honest position is that we don't.
The editor does not hold CAPE at the time of writing. The editor maintains a short-duration Treasury sleeve as part of a long-term core allocation with pre-committed drift bands.
Methodology
Macro context (10-year Treasury, federal funds rate, VIX, headline CPI year-over-year) sourced from FRED, fetched 2026-05-16 with individual as-of dates cited inline: 10Y Treasury and VIX 2026-05-14, federal funds and CPI 2026-04-01. CAPE ETF data (expense ratio, AUM, inception, dividend yield, NAV) from yfinance and the DoubleLine fact sheet, fetched 2026-05-16. Rebalancing literature: Daryanani, "Opportunistic Rebalancing," Journal of Financial Planning (2008); Vanguard Research, rebalancing methodology series (2024 update). Sharpe, "The Arithmetic of Active Management," Financial Analysts Journal (1991), is the foundational citation on the zero-sum nature of timing-driven activity. Article last updated 2026-05-16.
Disclaimer: This article is for educational purposes and does not constitute personalized financial advice.