The short version
- Duration, not credit, is the dominant risk in high-quality bond ETFs — and TLT carries roughly three times BND's.
- Convexity is real but it is a second-order term; over the last five years it did nothing to offset TLT's 43.7% drawdown, the deepest in its history.
- Bottom line: TLT is a rate-timing instrument, not a defensive core; BND is a lower-volatility ballast whose aggregate structure quietly dilutes the convexity a pure Treasury ladder would give you.
Most bond-ETF investors can recite the headline rule — when rates rise, bond prices fall — and stop there. The rule is true and almost useless, because it hides the two numbers that actually determine how much you lose or gain: duration, which sets the slope of that relationship, and convexity, which curves it. The gap between a fund with sixteen years of duration and one with six is not a matter of degree. Over the five years through July 2026 it was the difference between a 43.7% drawdown and a 17.9% one (yfinance, prices through 2026-07-16). This piece works through what those two Greek-letter concepts really do to a portfolio, and where the standard explanation of convexity misleads.
Context: two funds that are both "bonds" and nothing alike
TLT, the iShares 20+ Year Treasury Bond ETF, holds only long-dated U.S. Treasuries. BND, the Vanguard Total Bond Market Index Fund, holds the entire investment-grade U.S. bond market — Treasuries, agency mortgage-backed securities, and investment-grade corporates, weighted by market value. Both are high-quality; neither carries meaningful default risk. That is precisely why they make a clean laboratory for isolating rate sensitivity. When two funds share credit quality but differ this sharply in behavior, the explanation is duration and its curvature, not anything to do with who might not pay you back.
The macro backdrop frames why this matters right now. The 10-year Treasury yields 4.58% (FRED, asof 2026-07-14), the fed funds rate sits at 3.63% (FRED, asof 2026-06-01), and headline CPI is running at 3.7% year over year (FRED, asof 2026-06-01). We are in a regime where the market is pricing a slow, uncertain easing path — exactly the environment in which investors reach for long duration hoping to capture a rate-cut rally, and exactly the environment in which they most often misjudge the risk they are taking on to do it.
The data
| Metric | TLT (iShares 20+ Yr Treasury) | BND (Vanguard Total Bond) |
|---|---|---|
| Expense ratio | 0.15% | 0.03% |
| AUM | $41.1B | $397.9B |
| Inception | 2002-07-22 | 2001-11-12 |
| SEC / distribution yield | 4.5% | 4.0% |
| Effective duration (approx., issuer) | ~16 years | ~6 years |
| 5Y CAGR | -7.6% | -0.2% |
| 10Y CAGR | -2.4% | +1.4% |
| 5Y annualized volatility | 15.8% | 6.0% |
| 5Y max drawdown | -43.7% | -17.9% |
Expense ratios, AUM, yields, and duration are from the issuer fact sheets (iShares TLT; Vanguard BND). Return, volatility, and drawdown figures are computed from yfinance adjusted-close prices through 2026-07-16. Two things stand out before we say a word about theory: TLT's five-year volatility of 15.8% is in the neighborhood of a broad equity index, and its worst drawdown of 43.7% would not look out of place in an equity bear market. That is not what most people mean when they say "I moved to bonds to be safe."
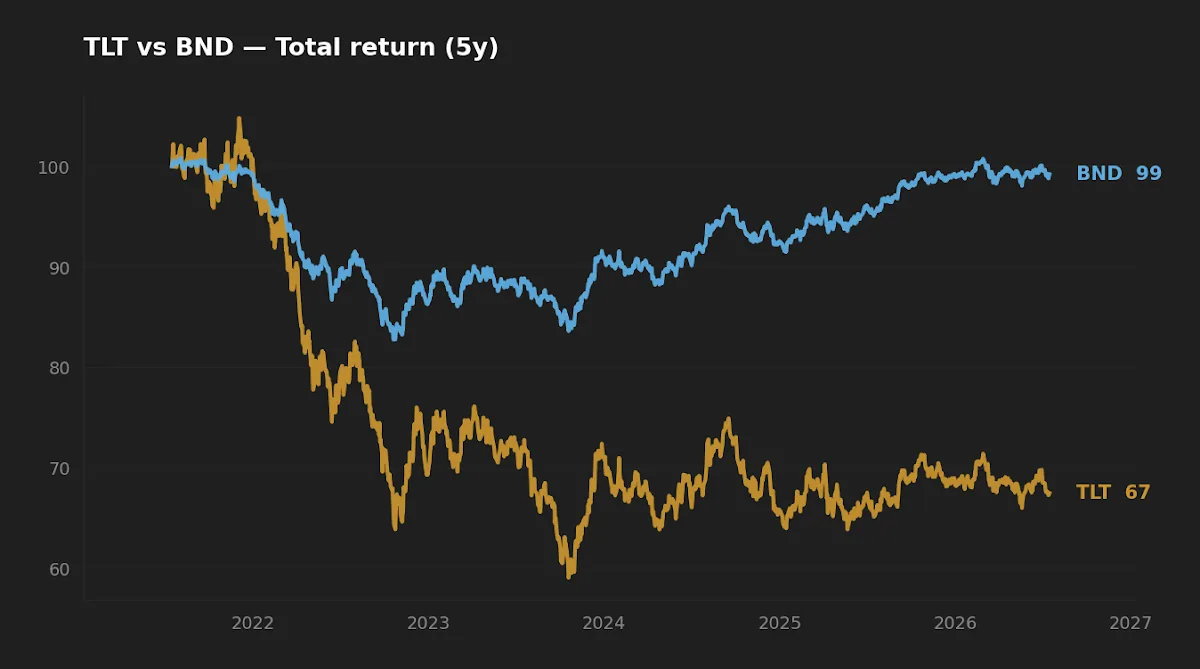
Duration: the slope you are actually buying
Effective duration is the approximate percentage change in price for a 1% (100 basis point) change in yield. TLT's roughly sixteen-year duration means a 100 bp rise in long-term yields costs about 16% of price; BND's roughly six-year duration costs about 6%. That single ratio — call it three-to-one — explains almost everything in the table above. The realized volatility gap (15.8% vs 6.0%) is close to the same ratio. So is the drawdown gap once you account for the path yields actually took.
Here is the point retail commentary skips. Duration is not a fixed property of "bonds"; it is a dial, and the fund's name tells you where the dial is set. "20+ Year Treasury" is a duration statement disguised as a maturity statement. When an investor buys TLT expecting the gentle, ballast-like behavior of a total-bond fund, the mismatch is not bad luck — it is a misread of the label. The difference between two total-bond funds is measured in tenths of a year of duration. The difference between BND and TLT is measured in a decade of it.
Convexity is sold as a free lunch — you gain more when rates fall than you lose when they rise. Over the last five years, that free lunch was a rounding error against a 43.7% drawdown driven by duration.
Convexity: the curvature that gets oversold
Convexity is the second-order correction to the duration estimate. Because the price-yield relationship curves, duration alone overstates losses when rates rise and understates gains when rates fall. For a plain Treasury bond, convexity is positive, and the standard sales pitch follows: long bonds give you an asymmetry in your favor. That is technically true and practically overstated.
The reason is one of magnitude. For the yield moves that dominate real portfolios — 50 to 150 basis points — the duration term swamps the convexity term. Convexity earns its keep only in large, fast rate moves, and even then it modifies the outcome rather than reversing it. TLT's investors between 2020 and 2023 held an instrument with textbook-positive convexity and still absorbed one of the worst fixed-income drawdowns on record, because the yield move was large, sustained, and in the wrong direction. Positive convexity made the loss modestly less bad than a naive duration estimate; it did not make the position defensive. Initially I assumed the convexity cushion would show up clearly in TLT's recovery path off the 2023 lows. It didn't — the five-year total return is still negative, because duration set the terms and convexity only trimmed the edges.
The non-obvious part: BND is not "TLT with less duration"
The comparison invites a tidy conclusion — same idea, smaller dose. It is wrong in a way worth understanding. BND holds a large slice of agency mortgage-backed securities, and MBS carry negative convexity. When rates fall, homeowners refinance, principal comes back early, and the bond's duration shortens exactly when a positively convex bond would extend to capture more gain. So the aggregate index does not simply dilute TLT's convexity — part of its structure works against you in a rally.
The practical implication: if your specific thesis is "I want convex exposure to falling long-term rates," BND is a poor expression of it, because its MBS sleeve caps the upside you are trying to buy. And if your goal is low-volatility ballast that behaves predictably, BND's shorter, income-cushioned profile is the better tool — its 4.0% yield and six-year duration produced a 17.9% drawdown against TLT's 43.7%, and a positive 1.4% ten-year CAGR against TLT's -2.4%. The two funds are answering different questions. Deciding which question is yours is the whole exercise — a point that sits underneath our broader work on what risk actually means for long-term investors.
Realized risk: what the drawdown path shows
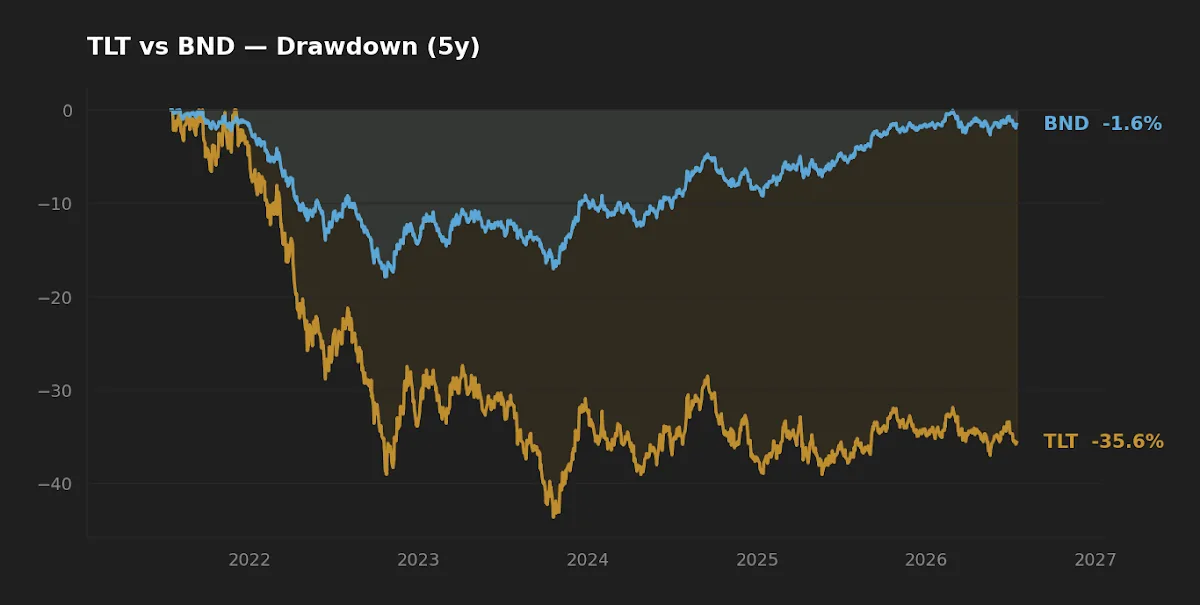
The drawdown chart makes the abstraction concrete. TLT's trough is more than twice BND's depth, and — the part that matters more for behavior — its drawdown duration is long. A holder did not just see a deep loss; they sat in it for years while the fund paid a distribution yield of 4.5% that was nowhere near enough to offset the price decline. That combination, deep and slow, is precisely the environment in which investors capitulate at the bottom. Volatility of 15.8% is a statistic; a multi-year underwater period is a test of temperament. The honest framing is that TLT's realized risk over this window looked more like a cyclical equity sleeve than a defensive one, which is worth remembering the next time long Treasuries are pitched as a flight-to-safety trade during a rate-cut cycle.
Scoreboard: winner by category
| Category | Winner | Why |
|---|---|---|
| Cost | BND | 0.03% vs 0.15% — a 0.12% gap that compounds over decades. |
| Realized risk (5Y) | BND | 17.9% drawdown, 6.0% volatility vs 43.7% and 15.8%. |
| Realized return (10Y) | BND | +1.4% CAGR vs -2.4%. |
| Suitability as a core holding | BND | Predictable ballast; TLT is a targeted duration bet, not a core. |
| Expressing a falling-long-rate view | TLT | Concentrated, positively convex long-duration exposure — the right tool if that is precisely your thesis. |
FAQ
Is TLT safer than the stock market because it holds Treasuries? It is free of default risk, but "safe" conflates credit risk with price risk. TLT's 5-year volatility (15.8%) and max drawdown (43.7%) are equity-like because of its ~16-year duration. Free of credit risk is not the same as free of loss.
Why did bond funds lose money at all — aren't bonds supposed to be defensive? Bond prices fall when yields rise, and yields rose sharply and stayed elevated. The longer a fund's duration, the larger the price hit. BND's shorter duration is why it lost far less than TLT over the same window (yfinance, through 2026-07-16).
Does convexity protect me in a rising-rate environment? Only marginally. Positive convexity makes losses slightly smaller than a duration-only estimate, but for realistic yield moves the duration term dominates. Convexity modifies the outcome; it does not reverse the direction.
If I expect rate cuts, should I hold TLT for the convexity? TLT gives concentrated, positively convex exposure to falling long-term yields, so it is a coherent expression of that specific view. But it is a timing instrument: if long yields stay high or rise, the same duration that powers the upside drives the downside. Size it as a satellite bet, not a core allocation.
Does BND give me the same convexity benefit as TLT, just smaller? No. BND's agency-MBS sleeve carries negative convexity — durations shorten as rates fall — so it partly works against a rate-rally thesis. BND is built for lower-volatility ballast, not for convex exposure to falling rates.
What this comparison can and can't tell you
The return, volatility, and drawdown figures cover a single five-to-ten-year window that was defined by one of the most aggressive rate-hiking cycles in modern history. That is a single regime. It tells you a great deal about how these funds behave when yields rise from a low base; it tells you almost nothing about how they would behave in a sustained disinflationary rally, where TLT's long duration would be the asset rather than the liability. Duration and convexity are structural and forward-looking; realized CAGR is backward-looking and regime-dependent. Do not read a negative TLT CAGR as a verdict on long duration for all time — read it as what long duration did in this particular rate environment. The sample also excludes any severe deflationary shock, the scenario in which long Treasuries have historically been most valuable.
Scenarios where each fund fits
Reader in their 30s, 401(k)-only, wants a single bond holding as ballast against equities: BND's broad, lower-duration profile and 0.03% cost make it the more predictable core; TLT's swings would work against the ballast role.
Reader with a specific, sized macro view that long-term yields will fall materially over the next 12–24 months: TLT is the cleaner expression of that thesis — but as a deliberate satellite position with a defined thesis and exit, not a permanent allocation.
Reader building a rebalancing-disciplined portfolio: a lower-volatility bond sleeve like BND is easier to hold to a target weight, whereas TLT's large swings can dominate a portfolio's rebalancing signals — a dynamic worth reading alongside our note on getting rebalancing bands right.
Editor's read
For the long-horizon bond sleeve, the editor leans clearly toward BND: over a full decade it delivered a positive real-of-nothing 1.4% CAGR while TLT sat at -2.4%, at one-fifth the cost and less than half the drawdown, and it behaves the way a core holding should — quietly. TLT is genuinely interesting, but as an instrument for a specific, sized view on long-term rates, not as a default. The mistake worth avoiding is treating sixteen years of duration as if it were the same asset class as six, differing only in dosage. It is a different tool for a different job, and the negative convexity buried in BND's MBS sleeve is the reminder that the two are not points on one line.
Editor's holdings disclosure: The editor holds a broad investment-grade bond position of the BND type; does not hold TLT at the time of writing.
Key takeaways
- Duration is the dial that matters: TLT's ~16 years versus BND's ~6 explains most of the difference in their realized volatility and drawdown (yfinance, through 2026-07-16).
- Convexity is a second-order effect. It trims losses in large yield moves but never reverses the direction duration sets — TLT drew down 43.7% with positive convexity fully intact.
- BND is not a scaled-down TLT: its agency-MBS sleeve carries negative convexity, so it is poor for expressing a falling-rate view but good as predictable ballast.
- Over ten years BND returned +1.4% CAGR at 0.03% cost; TLT returned -2.4% at 0.15% — regime-dependent, but decisive for this window.
- Match the instrument to the question: core ballast (BND) versus a sized, deliberate duration bet (TLT).
Methodology: Price, total-return, volatility, and drawdown figures computed from yfinance adjusted-close data pulled 2026-07-16, analyzing the trailing five- and ten-year windows. Expense ratio, AUM, distribution yield, and effective duration from issuer fact sheets (iShares, Vanguard). Macro figures from FRED (10-year Treasury and VIX asof 2026-07-14; fed funds rate and CPI asof 2026-06-01). Duration figures are issuer-reported approximations and vary modestly with rate levels.
This article is for educational purposes and does not constitute personalized financial advice. See our full Disclaimer.