
Photo by Water Journal on Unsplash
The short version
- A wide value spread tells you the price of the value trade, not its timing — it raises the odds without dating them.
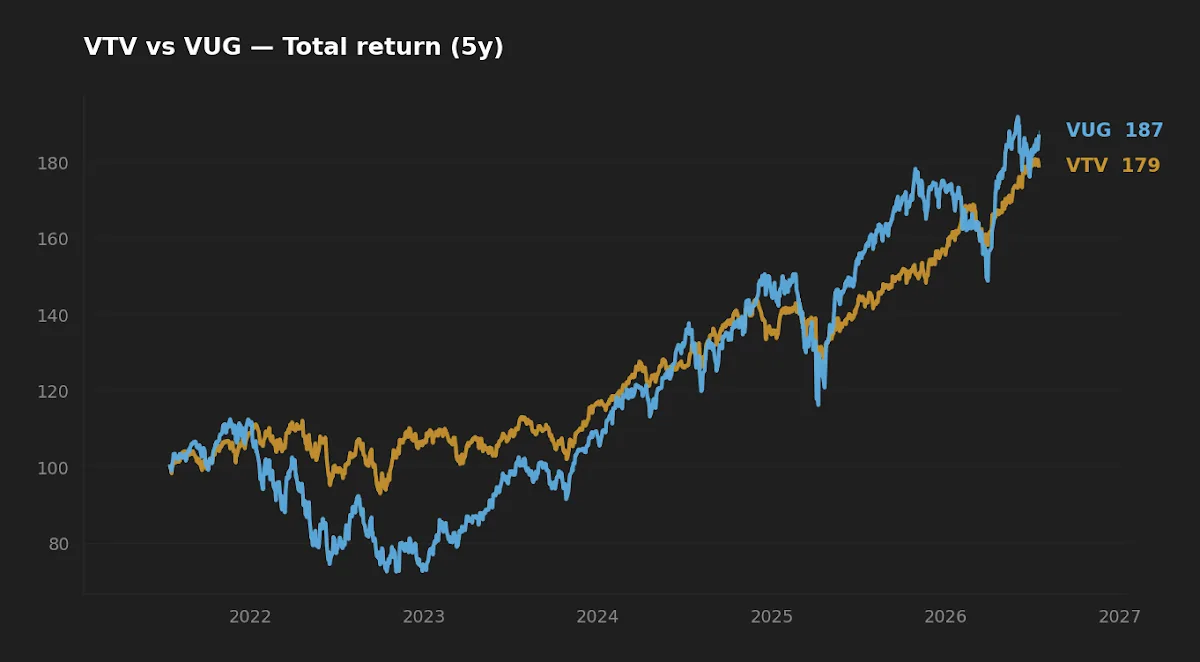
- Over the last five years VTV and VUG converged in total return (12.4% vs 13.2% CAGR), but VUG delivered it with roughly 60% more volatility and double the drawdown.
- Bottom line: value looks statistically cheap on the usual measures, yet "cheap" is a distribution of outcomes, not a signal to flip your core.
Every few years the question returns in the same shape: is value "due"? The honest answer is that being due is not a property markets have. What we can measure is the value spread — how cheap the cheap stocks are relative to the expensive ones — and use it to separate two things that get conflated: the expected return embedded in a factor, and the timing of when that return shows up. This piece reads the spread as a valuation gauge rather than a starting gun, using Vanguard Value (VTV) and Vanguard Growth (VUG) as the cleanest large-cap proxies for the two sides of the trade.
Context: what the value spread actually is
The value spread is the valuation gap between the cheap end and the expensive end of the market — most simply, the ratio of the growth basket's price-to-book (or price-to-earnings, price-to-sales) to the value basket's. Cohen, Polk, and Vuolteenaho formalized it in 2003, and it sits underneath the Fama–French HML factor: value is compensated, the theory goes, because you are buying the part of the market the crowd is least willing to hold. When the spread is wide, the market is paying an unusually large premium for perceived growth; when it is narrow, that premium has compressed.
The appeal of the spread is that it is forward-looking in a way trailing returns are not. A value strategy can underperform for a decade and end that decade cheaper than it started — which mechanically raises its expected forward return even as its recent track record looks terrible. That is the trap in "value is dead" narratives: they extrapolate the path and ignore the starting valuation. Arnott, Harvey, Kalesnik, and Linnainmaa made exactly this point in their 2021 work, decomposing value's long drought into a revaluation component (the spread widening) versus a fundamental one, and finding that most of the damage was re-rating rather than deteriorating business quality.
The two funds, side by side
VTV and VUG are useful here because they are the same issuer, the same 0.03% fee, the same inception date (2000-11-13), and they partition the CRSP US Large Cap universe by style — so the comparison isolates the value-versus-growth axis rather than manager or cost effects.
| Metric | VTV (Vanguard Value) | VUG (Vanguard Growth) |
|---|---|---|
| Expense ratio | 0.03% | 0.03% |
| AUM | $254.5B | $379.2B |
| Inception | 2000-11-13 | 2000-11-13 |
| Dividend yield | 1.9% | 0.4% |
| 5Y CAGR | 12.4% | 13.2% |
| 10Y CAGR | 12.6% | 18.1% |
| 5Y volatility (annualized) | 13.9% | 22.4% |
| Max drawdown (5Y) | -17.0% | -35.6% |
| NAV | $218.52 | $86.94 |
Source: yfinance for price, return, and risk fields (pulled 2026-07-16); Vanguard issuer profiles for fee, AUM, yield, and inception — VTV fact sheet and VUG fact sheet.
What the numbers say about the spread today
Look at the two horizons. Over ten years, VUG compounded at 18.1% against VTV's 12.6% — a 5.5-point annual gap that is almost the entire modern case that "growth won." Over the trailing five years, that gap collapses to 0.8 points: 13.2% versus 12.4%. The convergence is the interesting part. It is consistent with a spread that widened enormously through the 2010s and has partially normalized since — value did not need to "win" to close the recent gap; it only needed the growth premium to stop expanding.
A caveat I want to be explicit about: I do not have a clean, point-in-time price-to-book series for the two baskets in front of me, so I am reading the spread indirectly — through the relative return paths and the yield gap (1.9% versus 0.4%) rather than a single published spread number. That indirection matters, and I will come back to it under the limits section. What the return data can support is a narrower claim: the growth basket's relative advantage has decelerated sharply, which is what partial spread normalization looks like from the outside.
A wide value spread raises the expected return on the trade; it says nothing about the calendar on which that return arrives.
Realized risk is where the story diverges
The CAGR lines have nearly met, but the risk lines have not. VUG's five-year annualized volatility is 22.4% against VTV's 13.9%, and its worst peak-to-trough drawdown over the window was -35.6% versus VTV's -17.0%. That is not a rounding difference — it is roughly twice the maximum loss for a nearly identical return. On a crude return-per-unit-of-drawdown basis, the value side did materially more work per unit of pain.
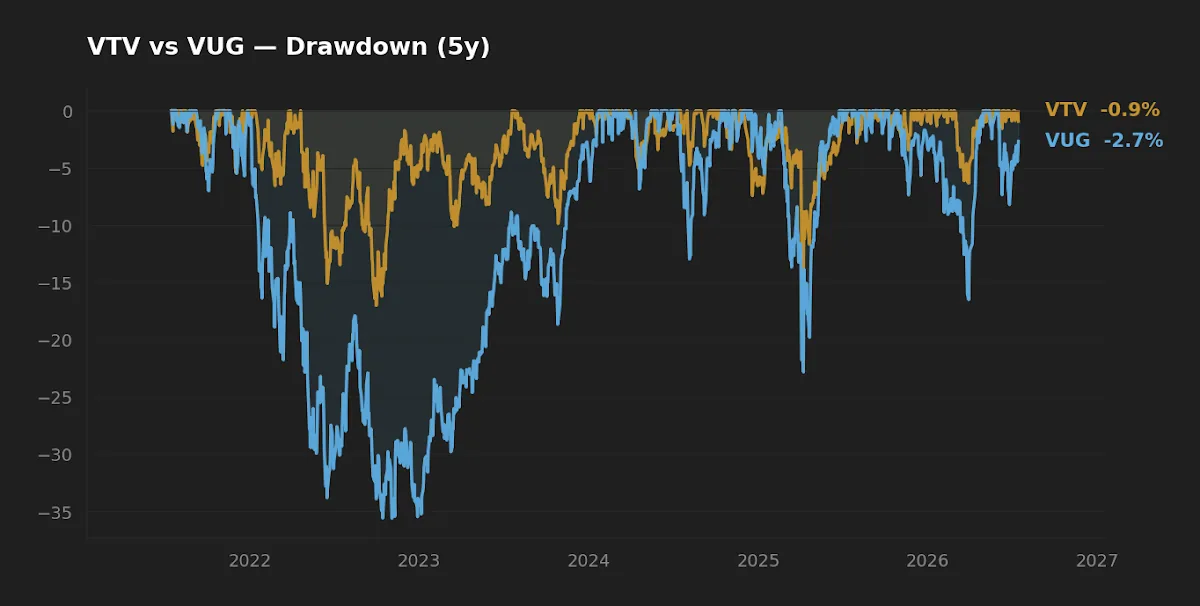
This is the second-order effect the headline CAGR hides. When two assets deliver the same compounded return but one does it with a deeper drawdown, the deeper-drawdown asset demands more from the investor's behavior — it is the one you are most tempted to sell at the bottom. A spread-based case for value, then, is not only about expected return; it is about buying that expected return inside a lower-variance, shallower-drawdown wrapper. The growth basket's higher beta cuts both ways, and the last five years happened to be a window where you paid for that beta in volatility without being fully compensated in return.
Why "cheap" is not a timing signal
Here is where I have to check my own instinct. Initially I read the converging five-year CAGRs as evidence that value's turn had arrived and momentum was on its side. Then I looked at the dispersion of forward outcomes that the value-spread literature actually reports, and it does not support a timing read. The spread has decent explanatory power for long-horizon relative returns and almost none for the next twelve months. A wide spread is like buying an asset at a low valuation: it improves your odds over five-to-ten years and tells you nothing about the next quarter. Treating it as a rotation trigger is a category error — you would be using a valuation measure to answer a timing question it was never built to answer.
The macro backdrop reinforces the humility. With the 10-year Treasury near 4.58% and the fed funds rate at 3.63% (FRED, asof 2026-07-14 and 2026-06-01), the discount rate on long-duration growth cash flows is no longer near zero — which is part of why the growth premium stopped expanding. But rates are not a value catalyst you can schedule either. CPI is still running at 3.7% year-over-year (FRED, asof 2026-06-01) and the VIX sits at a calm 16.5, so nothing in the regime signals an imminent style rotation. The spread is a statement about starting conditions, not about the trigger.
If the factor axis interests you, the same "measure the exposure, don't guess the comeback" discipline runs through our look at why factor investing still works, and it shows up in miniature down the cap scale in the case for small-cap value patience. For readers weighing the growth side specifically, SCHG vs VUG covers how the index construction actually diverges.
Scoreboard: winner by category
| Category | Edge | Why |
|---|---|---|
| Cost | Tie | Both 0.03%; no separation. |
| Realized risk | VTV | 13.9% vol and -17.0% drawdown vs 22.4% and -35.6%. |
| Realized return | VUG | Wins on 10Y (18.1% vs 12.6%); the 5Y gap is nearly closed. |
| Suitability (drawdown discipline) | VTV | Shallower losses are easier to hold through stress. |
What this comparison can and can't tell you
It can tell you that the two baskets have converged in return while staying far apart in risk, and that the growth premium's expansion has stalled — both consistent with a spread that has partially normalized. It cannot tell you the spread's exact current level, because I am inferring it from returns and yield rather than a published point-in-time price-to-book series; treat the directional read as stronger than any precise number. It also cannot tell you when value realizes its embedded premium — the five- and ten-year windows here cover one broad regime (a long growth-led bull with two sharp corrections), so they under-sample the environments, like sustained high inflation, where value has historically done its best relative work. Single-regime samples flatter whichever style led that regime, and look-ahead is easy to smuggle in when you already know how the decade ended.
Scenarios where each fund fits
Reader in their 30s, long horizon, broad-market core already in place: a modest VTV tilt is a valuation-aware satellite, not a bet on a dated comeback — you are buying a lower-drawdown expression of the market at a relatively better starting spread.
Reader who already holds a total-market or S&P 500 fund: note that a cap-weighted core already contains both baskets. Adding VUG on top concentrates the exposure you are most heavily weighted to already; adding VTV diversifies the style axis.
Reader sensitive to drawdown behavior: the -35.6% versus -17.0% gap is the operative number. If you know you sell in deep drawdowns, the value basket's shallower path is worth more than a fraction of a point of CAGR.
Editor's read
The spread makes a real, evidence-based case that large-cap value is priced for a better forward outcome than its ten-year track record implies — and it does so inside a lower-variance wrapper, which is the part I weight most. But I would not read the converging five-year CAGRs as a timing signal to rotate; the spread earns its keep over a decade, not a quarter. If forced to choose one for a long-horizon core sleeve, the editor leans VTV on risk-adjusted grounds, while treating a cap-weighted total-market fund — which owns both baskets — as the more defensible default.
Holdings disclosure: The editor does not hold either VTV or VUG as a standalone position at the time of writing; large-cap exposure sits in a broad total-market fund.
FAQ
What is the value spread in plain terms?
It is how cheap the market's cheap stocks are relative to its expensive ones — typically the ratio of the growth basket's valuation multiple to the value basket's. A wide spread means the market is paying an unusually large premium for growth.
Does a wide spread mean value will outperform soon?
No. The spread has meaningful explanatory power for long-horizon relative returns and very little for the next year. It improves the odds without dating them, which is why using it as a rotation trigger is a mistake.
Why did VUG beat VTV so badly over ten years but barely over five?
Most of the ten-year gap (18.1% vs 12.6% CAGR) came from the growth premium expanding through the 2010s. Over the trailing five years that expansion stalled, so the CAGRs converged to 13.2% versus 12.4%.
Is the lower drawdown on VTV reliable or just this sample?
Lower volatility and shallower drawdowns are a persistent structural feature of value versus growth baskets, driven by beta and duration differences — but the specific -17.0% versus -35.6% figures reflect one five-year window and should not be treated as fixed.
Should I just hold both?
A cap-weighted total-market fund already holds both baskets, so many investors get balanced style exposure without buying either fund. VTV or VUG make sense mainly as a deliberate, valuation-aware tilt around that core.
Key takeaways
- The value spread measures the price of the value trade, not its timing — a wide spread raises expected return over a decade, not next quarter.
- VTV and VUG have converged on return (12.4% vs 13.2% 5Y CAGR) while staying far apart on risk (13.9% vs 22.4% volatility; -17.0% vs -35.6% drawdown).
- The growth basket's ten-year lead (18.1% vs 12.6%) was largely spread expansion, which has since decelerated.
- Both funds cost 0.03%, so the decision is about factor exposure and drawdown tolerance, not cost.
- A cap-weighted core already owns both; VTV or VUG are tilts, not replacements for the core.
Methodology: Return, volatility, and drawdown fields computed from yfinance daily total-return data pulled 2026-07-16; expense ratio, AUM, dividend yield, and inception from Vanguard issuer profiles. Macro figures from FRED (10-year Treasury and VIX asof 2026-07-14; fed funds and CPI asof 2026-06-01). Windows analyzed: trailing 5-year and 10-year through mid-2026.
This article is for educational purposes and does not constitute personalized financial advice. See our full Disclaimer.