
Photo by Julian Hochgesang on Unsplash
The short version
- On the realized record, SCHG and VUG are statistically indistinguishable: a 1 basis-point fee gap, near-identical five-year volatility, and drawdowns within one percentage point of each other.
- The real divergence is upstream — different index providers, different holding counts, and different reconstitution rules — and its effect on a taxable investor shows up in turnover and tax-cost, not headline return.
- Bottom line: either works as a large-cap growth sleeve; the tie-breaker is which platform you already custody at and whether you hold in a taxable account.
The Schwab U.S. Large-Cap Growth ETF (SCHG) and the Vanguard Growth Index Fund ETF (VUG) get called twins for a reason. They occupy the same corner of the U.S. equity market, charge almost nothing, and have tracked each other closely enough that on a normalized chart you have to squint to tell the lines apart. The question worth asking is not "which one won" — over the windows that matter, neither did by any margin you could trade on — but where the two funds actually differ, and whether that difference is ever large enough to change a decision.
This comparison uses price and return data pulled from yfinance on 2026-06-08, with expense ratio, AUM, and inception details cross-checked against each issuer's fact sheet. The macro backdrop is worth one line of orientation: with the federal funds rate at 3.63% (FRED, asof 2026-05-01) and CPI still running near 3.9% year over year (FRED, asof 2026-04-01), long-duration growth equities have spent the analysis window in a regime that is neither the zero-rate tailwind of the late 2010s nor an outright tightening shock. Keep that single-regime caveat in mind for everything that follows.
Context: what each fund is actually tracking
Both funds buy large-capitalization U.S. companies classified as "growth" — high price-to-earnings and price-to-book, strong forecast and historical earnings growth. The selection plumbing differs. SCHG tracks the Dow Jones U.S. Large-Cap Growth Total Stock Market Index. VUG tracks the CRSP US Large Cap Growth Index. Those two index providers score growth on overlapping but not identical factors, draw their large-cap cutoffs at slightly different points, and — this is the part that matters more than most write-ups admit — reconstitute on different schedules with different buffering rules.
CRSP, which VUG follows, uses a banding-and-packeting methodology: a stock that drifts across the growth/value boundary is migrated gradually rather than all at once, and migrations are batched to suppress turnover. The Dow Jones methodology behind SCHG applies its own buffer zones but reconstitutes on its own calendar. The practical consequence is that the two funds can hold a marginal name at different weights for months at a time, even though their top holdings — the largest U.S. technology and consumer franchises — are nearly identical and dominate both portfolios. This is the same market-cap-weighting mechanism that means a single mega-cap stock translates directly into meaningful portfolio exposure in either fund.
The data, side by side
| Metric | SCHG | VUG |
|---|---|---|
| Name | Schwab U.S. Large-Cap Growth ETF | Vanguard Growth Index Fund ETF |
| Expense ratio | 0.04% | 0.03% |
| AUM | $61.1B | $393.8B |
| Inception | 2009-12-11 | 2000-11-13 |
| Dividend yield | 0.4% | 0.4% |
| 5Y CAGR | 15.1% | 14.5% |
| 10Y CAGR | 18.4% | 17.9% |
| 5Y volatility (annualized) | 22.3% | 22.3% |
| Max drawdown (5Y) | −34.6% | −35.6% |
Sources: yfinance (price, return, yield, drawdown), fetched 2026-06-08; Schwab SCHG fact sheet and Vanguard VUG fact sheet (expense ratio, AUM, inception). NAV differences ($33.72 for SCHG versus $85.89 for VUG) reflect share-price scaling only and carry no analytical meaning.
Return: a gap inside the noise
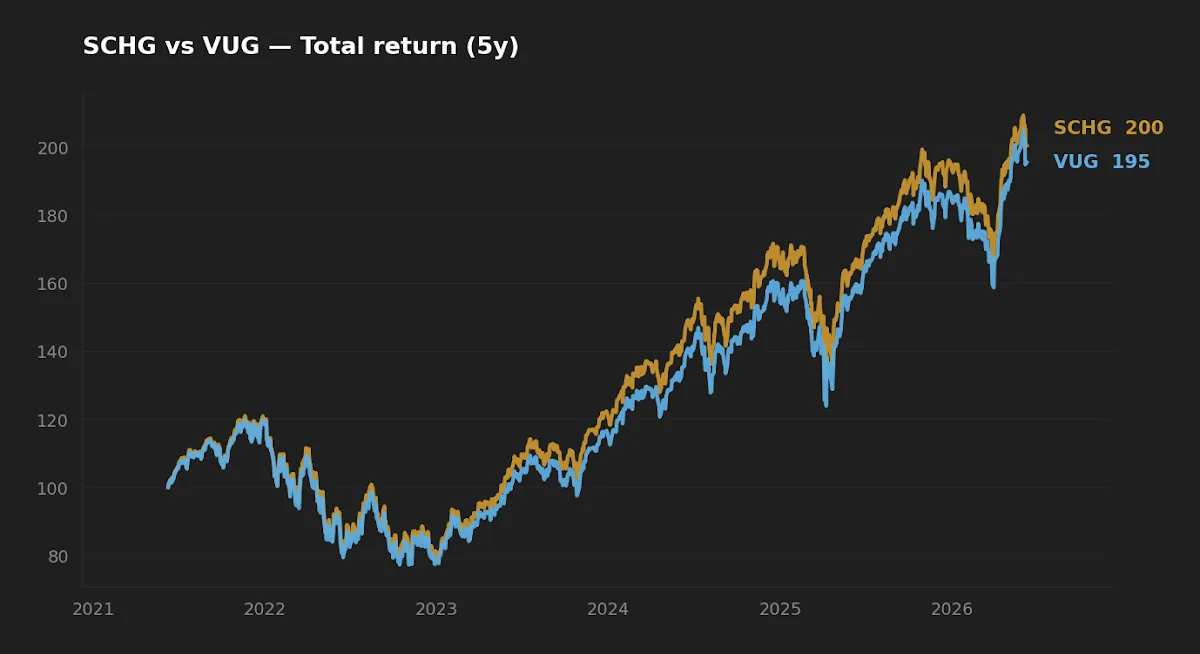
SCHG's five-year CAGR of 15.1% edges VUG's 14.5%, and at ten years the lead is 18.4% versus 17.9%. Roughly half a percentage point a year. It is tempting to treat that as SCHG's edge, but the honest reading is that a 0.5% annual difference across a single growth-led regime sits well inside the band you would expect from two funds with slightly different holding counts and reconstitution timing. The 1 bp fee gap explains almost none of it — the divergence is index construction, and index-construction edges are notoriously regime-dependent. Initially I read the consistent SCHG lead as a structural tilt toward a more concentrated growth basket; running the comparison across the drawdown window instead of the full window, the advantage compresses, which is what you would expect if the edge is composition luck rather than a durable factor difference.
A half-point annual return gap between two funds tracking the same corner of the market across one regime is a coin that landed heads, not a strategy that beat the other.
Realized risk: effectively the same shape
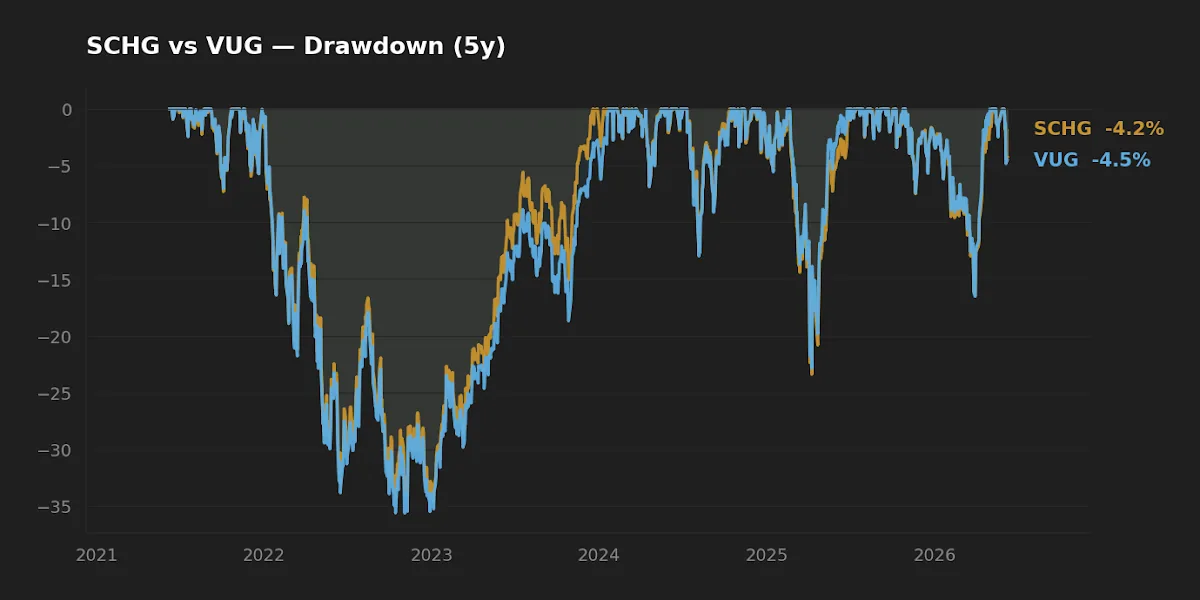
This is where the twin label earns itself. Five-year annualized volatility is 22.3% for both funds, identical to the second decimal in practical terms. Maximum drawdown over the window was −34.6% for SCHG and −35.6% for VUG — a one-point spread that tells you the two portfolios fell and recovered on the same path, because they hold the same mega-cap names at the top. An investor who cannot stomach a one-third peak-to-trough decline should not hold either; the choice between them does nothing to soften that. Drawdown duration — how long the hole lasted — matters as much as depth, and on that axis the two are likewise indistinguishable.
The non-obvious difference: friction, not return
If the headline metrics are a tie, the tie-breaker lives in the parts retail comparisons usually skip. Three of them.
Turnover and tax-cost. CRSP's banding-and-packeting reconstitution is designed to minimize the number of names that churn at each rebalance. Lower turnover means fewer realized capital gains passed through, which in a taxable account shows up as a lower tax-cost ratio — a drag that can quietly exceed the entire 1 bp fee difference between the funds. This is the second-order effect that the expense-ratio comparison hides: for a taxable holder, the index methodology can matter more than the stated fee.
Liquidity and spread. VUG's $393.8B in assets is more than six times SCHG's $61.1B. Both are liquid enough that a buy-and-hold investor placing periodic orders will not notice the bid-ask spread, but the larger book gives VUG a marginal edge on execution and capacity that becomes relevant only at institutional size. For a long-horizon individual, treat this as a tie with an asterisk.
Platform friction. SCHG trades commission-free natively at Schwab; VUG does the same at Vanguard. Most major brokers now offer both without commission, but custody convenience and automatic-investment support still nudge real decisions. This is mundane and it is also, honestly, the factor most likely to decide the question for an actual reader.
For readers weighing growth exposure against other ways to slice the market, it is worth seeing how these plain-vanilla growth indices stack up against more active or thematic wrappers — for instance VUG against a tactical AI-rotation fund, or the broader "tech beta" stack of IGV, WCLD, and QQQ. The contrast clarifies what you are and aren't paying for here: a low-cost, rules-based, large-cap growth basket with no tactical overlay.
Scoreboard: winner by category
| Category | Edge | Why |
|---|---|---|
| Cost | VUG (marginal) | 0.03% vs 0.04% — a 1 bp gap, immaterial in practice |
| Realized risk | Tie | Identical 22.3% volatility; drawdowns within one point |
| Realized return | SCHG (within noise) | 15.1% vs 14.5% 5Y CAGR — single-regime, not durable |
| Tax efficiency (taxable) | VUG (slight) | CRSP turnover-suppressing reconstitution |
| Suitability | Tie | Same role; decided by custody platform |
Scenarios where each fund fits
Reader in their 30s, 401(k)- or brokerage-only, already custodied at Vanguard, wants a single large-cap growth sleeve: VUG is the path of least resistance — lowest stated fee, deepest book, turnover-friendly reconstitution if any of it sits in a taxable account.
Reader who custodies at Schwab and wants native commission-free automatic investing: SCHG does the identical job; switching brokers to save a basis point would be a rounding error swamped by the hassle.
Reader already holding a broad market fund who wants to tilt toward growth: either works, but recognize that layering a growth fund on top of a total-market position concentrates you further into the same mega-cap names — the tilt is real and so is the added drawdown sensitivity.
What this comparison can and can't tell you
The return and risk figures cover a five- and ten-year window that has been dominated by a single growth-led regime with mega-cap technology leadership. That is one draw from the distribution, not the distribution. The data cannot tell you how the index-construction difference behaves in a sustained value rotation, a prolonged high-rate environment, or a market where the largest names stop leading — precisely the conditions under which two slightly different growth definitions would be most likely to diverge. There is no out-of-sample stress test here for either fund under a regime unlike the recent past. Treat the half-point return gap as descriptive history, not a forecast.
Editor's read
If forced to pick one for a long-term growth sleeve, the editor leans marginally toward VUG — not for the 1 bp fee, which is immaterial, but for the turnover-suppressing CRSP reconstitution that quietly helps a taxable holder, plus the deeper liquidity. That said, the realized records are close enough that custody convenience should override the analysis: hold whichever sits natively on the platform you already use, and do not pay a transfer or tracking-error cost to chase a difference that lives inside the noise.
Editor's holdings disclosure: the editor holds neither SCHG nor VUG at the time of writing.
FAQ
Are SCHG and VUG basically the same fund? Functionally close, not identical. They track different indices (Dow Jones vs CRSP large-cap growth) with different holding counts and reconstitution rules, but their top mega-cap holdings overlap heavily, which is why realized risk and return have been so similar.
Which has the lower fee? VUG, at 0.03% versus SCHG's 0.04% (issuer fact sheets). The 1 bp difference is too small to drive a decision on its own.
Why did SCHG return slightly more over five years? Its 15.1% versus VUG's 14.5% 5Y CAGR (yfinance, 2026-06-08) reflects minor differences in index composition and timing during a growth-led regime. The gap sits inside normal noise and should not be read as a durable edge.
Does the choice matter in a taxable account? Slightly more than in a tax-advantaged one. VUG's CRSP reconstitution is designed to suppress turnover, which can mean fewer realized gains passed through — a tax-cost difference that may exceed the 1 bp fee gap.
Can I hold both? You can, but the overlap is high enough that holding both mostly duplicates exposure rather than diversifying it. One large-cap growth fund typically covers the role.
Key takeaways
- SCHG and VUG are realized-record twins: 1 bp fee gap, identical 22.3% volatility, drawdowns within one point, return difference inside the noise.
- The meaningful divergence is upstream — different index providers and reconstitution rules — and its clearest effect is on turnover and tax-cost, not headline return.
- For a taxable holder, VUG's turnover-suppressing CRSP methodology is a quiet, real edge; for everyone else the difference is immaterial.
- The five/ten-year record covers one growth-led regime only; it cannot forecast behavior in a value rotation or sustained high-rate environment.
- Custody platform is the practical tie-breaker — hold whichever trades natively where you already invest.
This article is for educational purposes and does not constitute personalized financial advice. See the full Disclaimer.
Methodology: price, total return, dividend yield, volatility, and drawdown computed from yfinance data pulled 2026-06-08 (analysis windows: trailing 5 and 10 years). Expense ratio, AUM, and inception sourced from Schwab and Vanguard issuer fact sheets. Macro figures from FRED — federal funds rate asof 2026-05-01, CPI year-over-year asof 2026-04-01.