
Photo by Nejc Soklič on Unsplash
The short version
- VEA (developed) and VWO (emerging) are the two halves of total international exposure; held together at market weight they approximate a single all-world-ex-US fund.
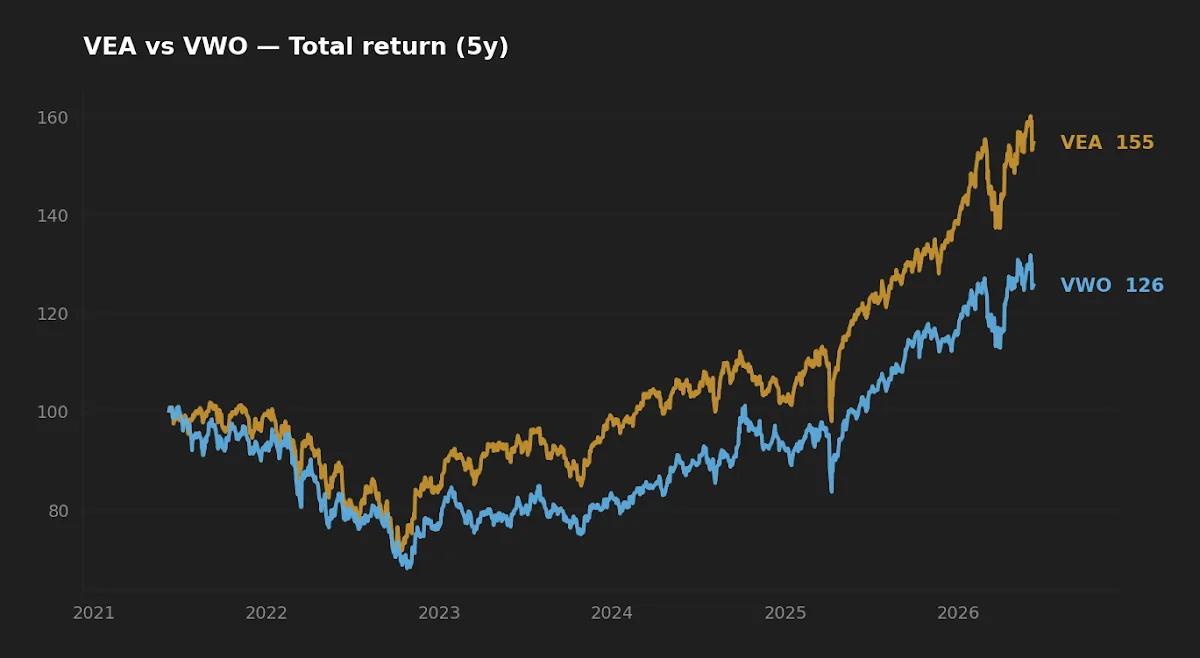
- Over the trailing five years VEA returned 9.1% annualized versus VWO's 4.4% — but the ten-year gap narrows to 10.0% vs 8.7%, which says more about the recent regime than about either asset class permanently.
- Bottom line: the split is a deliberate tilt, not a free lunch — realized volatility was nearly identical, so the 5Y return gap was not compensation for proportionally more risk.
If you have decided to hold international equities at all, the next decision is how to split that allocation between developed markets and emerging markets. Vanguard's VEA and VWO are the most common building blocks for that decision, and the central question is whether emerging markets deserve a deliberate overweight, an underweight, or simply their market-cap share. The answer matters because the two sleeves have behaved very differently over the most recent five years — and because the size of that difference depends heavily on which window you measure.
Context: what each fund actually holds
VEA — the Vanguard FTSE Developed Markets ETF — tracks developed economies outside the United States: Japan, the United Kingdom, the eurozone, Canada, Australia, and, under FTSE's classification, South Korea. VWO — the Vanguard FTSE Emerging Markets ETF — tracks emerging economies, with China, Taiwan, and India as the largest country weights. One methodological detail worth flagging up front: FTSE classifies South Korea as developed, so Korean equities sit in VEA, not VWO. MSCI-based competitors keep Korea in emerging markets. That single classification choice moves a meaningful slice of large-cap technology exposure from one fund to the other, and it is the kind of construction difference that gets lost when funds are treated as interchangeable. For a broader primer on whether non-US exposure belongs in a portfolio at all, see Do You Really Need International Exposure? (VXUS Explained).
Held in proportion to their market capitalization, VEA and VWO together roughly reconstruct a total-international fund. The decision to hold them separately is really a decision to control the developed-versus-emerging ratio yourself rather than accept the market's.
The data side by side
The table below uses price and return figures from yfinance (pulled 2026-06-08); expense ratio, AUM, and inception come from the Vanguard fund pages for VEA and VWO.
| Metric | VEA (Developed) | VWO (Emerging) |
|---|---|---|
| Expense ratio | 0.03% | 0.06% |
| AUM | $317.3B | $162.8B |
| Inception | 2001-01-04 | 2006-06-23 |
| Distribution yield | 2.6% | 2.4% |
| NAV (approx.) | $69.21 | $58.28 |
| 5Y CAGR | 9.1% | 4.4% |
| 10Y CAGR | 10.0% | 8.7% |
| 5Y volatility (annualized) | 16.6% | 17.4% |
| 5Y max drawdown | -29.7% | -32.8% |
The fee gap: real, but the smallest part of the story
VWO costs 0.06% against VEA's 0.03% — double, but in absolute terms a three-basis-point difference. On a $10,000 position that is $3 a year. Basis points compound and they deserve respect, but here the fee gap is dwarfed by the return gap, and it would be a mistake to let the cost comparison drive the allocation. Both funds are large enough — $317.3B and $162.8B in AUM — that bid-ask spreads and closure risk are non-issues for a buy-and-hold investor. The implementation friction that actually matters in emerging markets is not the headline expense ratio but the underlying cost of trading and taxing securities in dozens of jurisdictions, which is already embedded in the fund's tracking and return figures rather than shown as a separate line.
Realized return: the 5-year gap is mostly a recent-regime story
This is where most comparisons stop too early. Over five years VEA compounded at 9.1% and VWO at 4.4% — a 4.7-percentage-point annual gap that looks like a decisive verdict for developed markets. But extend the window to ten years and the gap collapses to 1.3 points: 10.0% for VEA, 8.7% for VWO. That divergence between the two windows is the single most important number in this article. It tells you that emerging markets did much of their work in the earlier half of the decade and lagged badly in the recent half. A five-year snapshot captures one regime — a strong dollar, concentrated US and developed-market leadership, and a difficult stretch for Chinese equities, which dominate VWO's weighting.
The five-year gap looks like a verdict on emerging markets; the ten-year gap suggests it is mostly a verdict on the last five years.
None of this tells you what the next five years hold. Extrapolating the trailing window forward is exactly the look-ahead and single-regime trap that the academic literature on international diversification keeps warning against. What the data does support is more modest: emerging markets have been a higher-dispersion asset whose relative performance swings with the dollar cycle and with the fortunes of a few large country weights. The concentration point connects directly to how cap-weighted indices translate a handful of large constituents into outsized portfolio exposure — a mechanic explored in Tesla Inside Your Index ETF.
Realized risk: similar volatility, so the return gap was not "paid for"
The standard intuition is that emerging markets are higher risk and therefore should deliver higher reward. The realized numbers complicate that. VWO's five-year annualized volatility was 17.4% against VEA's 16.6% — a gap of only 0.8 points. Maximum drawdowns were closer than the reputation suggests: VWO fell 32.8% at its worst, VEA 29.7%. So over this particular window emerging markets carried modestly more risk and delivered substantially less return — the opposite of the risk-premium narrative. The extra risk simply was not compensated in this sample.
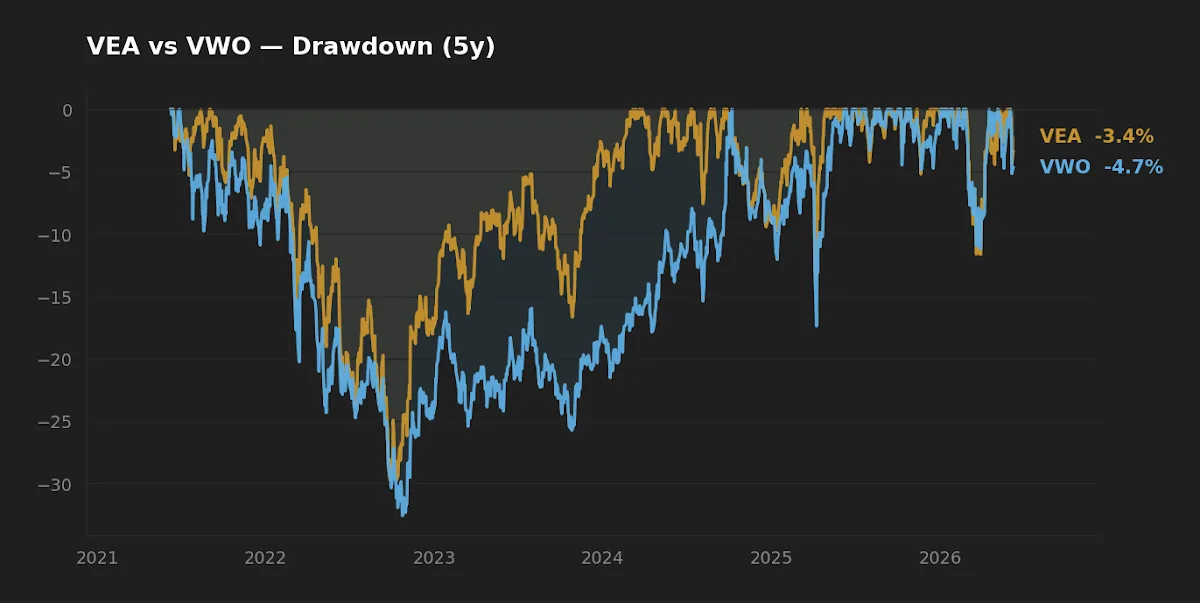
The honest reading is that volatility and drawdown were close enough that risk is not the deciding variable between these two funds. The deciding variable is your view — held humbly — on whether the recent return gap mean-reverts. The diversification case for owning some VWO does not rest on it being safer or even higher-returning; it rests on its return stream not moving in perfect lockstep with developed markets, which is a separate property from either risk or return in isolation.
How to split: three defensible approaches
There is no single correct ratio, but there are coherent ones. Market weight currently places emerging markets at roughly a quarter of international equity; holding VEA and VWO in that proportion (or simply owning a combined ex-US fund) is the lowest-conviction, lowest-maintenance choice. A deliberate underweight reflects a view that governance, currency, and concentration risks in emerging markets warrant a haircut below market weight. A deliberate overweight is a contrarian, valuation-based tilt — buying the laggard on the expectation of mean reversion, which is precisely the bet the trailing five-year numbers make uncomfortable and the ten-year numbers make defensible. Whichever you choose, the discipline that matters more than the starting ratio is rebalancing: letting bands rather than forecasts trigger the trades. For how even modest weight changes propagate over decades, see Asset Allocation in Practice: How 10% Weight Shifts Reshape Long-Term Outcomes.
One macro note for context, not for timing: with the federal funds rate at 3.63% and CPI running at 3.9% year over year (FRED, asof 2026-05-01 and 2026-04-01 respectively), real short rates are only mildly positive. The dollar path from here — not directly forecastable — is the single biggest swing factor for unhedged emerging-market returns, since a weakening dollar historically flatters VWO and a strengthening one penalizes it.
| Category | Winner | Why |
|---|---|---|
| Cost | VEA | 0.03% vs 0.06%, though the gap is small in dollars |
| Realized return (5Y) | VEA | 9.1% vs 4.4% over the trailing five years |
| Realized return (10Y) | VEA, narrowly | 10.0% vs 8.7% — far closer than the 5Y gap |
| Realized risk | VEA, marginally | 16.6% vol / -29.7% drawdown vs 17.4% / -32.8% |
| Diversification role | VWO | Adds a distinct, less-correlated return stream |
FAQ
Do I need both VEA and VWO, or is VXUS enough?
A single total-international fund like VXUS already holds both developed and emerging markets at market weight. Splitting into VEA and VWO only adds value if you want to control the ratio deliberately. If you have no view, the combined fund is simpler and rebalances itself internally.
Why is South Korea in VEA and not VWO?
Both funds follow FTSE indices, and FTSE classifies South Korea as a developed market. So Korean equities appear in VEA. MSCI-based emerging-market funds classify Korea as emerging, which is one reason VWO's country weights differ from an MSCI EM fund.
Is emerging markets' recent underperformance a reason to avoid VWO?
The five-year gap (9.1% vs 4.4%) is real but window-dependent; the ten-year gap is only 1.3 points. Trailing performance is a weak predictor of forward returns, and chasing or avoiding an asset purely on its recent record is exactly the behavior the rebalancing literature cautions against.
Is VWO riskier than VEA?
Modestly, by the realized numbers: 17.4% vs 16.6% annualized volatility and a -32.8% vs -29.7% maximum drawdown over five years. The gap is smaller than emerging markets' reputation implies, and in this window the extra risk was not rewarded with extra return.
How do the dividends compare for a taxable account?
The distribution yields are close — 2.6% for VEA and 2.4% for VWO. International funds often generate a mix of qualified and non-qualified income and may carry foreign tax that can sometimes be claimed as a credit; the exact split varies year to year, so check each fund's tax documents rather than assuming.
What this comparison can and can't tell you
It can tell you how these two funds behaved over the trailing five and ten years on cost, realized return, volatility, and drawdown. It cannot tell you which will lead next. The five-year sample covers a single, dollar-strong regime; the ten-year sample is still only one overlapping decade. Neither window includes a sustained dollar-weakening cycle of the kind that has historically favored emerging markets, so the data is silent on the scenario where the contrarian case pays off. Country-concentration risk inside VWO — particularly China — is not captured by any single summary statistic here.
Scenarios where each fits
Reader in their 30s, 401(k)-only, no current international exposure → the simplest coherent step is a single ex-US fund or VEA-plus-VWO at market weight, then leave the ratio alone and rebalance on a band. Reader who already holds a total-international fund and wants a deliberate tilt → a satellite VWO position is the cleanest way to overweight emerging markets without disturbing the core. Reader uncomfortable with single-country concentration → leaning toward VEA, with VWO held at or below market weight, keeps China's index weight from dominating the international sleeve.
Editor's read
If the goal is a long-horizon core international sleeve, the editor leans toward holding both at roughly market weight rather than making a large directional bet either way: the five-year gap is real but regime-driven, the ten-year gap is small, and realized volatility was close enough that overweighting developed markets is not the obvious risk reduction it appears to be. VWO earns its place as a diversifier, not as a conviction call — its value is a return stream that does not move in lockstep with VEA, and that property survives even a weak performance window.
The editor holds broad international exposure including both developed and emerging markets at approximately market weight; positions are managed by rebalancing band rather than forecast.
Methodology: Price, return, volatility, and drawdown figures from yfinance, pulled 2026-06-08; trailing 5-year and 10-year windows ending June 2026. Expense ratio, AUM, distribution yield, and inception from Vanguard issuer fund pages. Macro figures from FRED (federal funds rate asof 2026-05-01; CPI year-over-year asof 2026-04-01).
This article is for educational purposes and does not constitute personalized financial advice. See our full Disclaimer.