Photo by Laura Chouette on Unsplash
The short version
- QRFT and AMOM share an issuer, an inception date, and an identical 0.75% expense ratio — so this is a clean test of factor tilt, not cost or structure.
- Over five years QRFT returned slightly more (11.9% vs 11.3% CAGR) while taking meaningfully less risk (17.4% vs 23.9% volatility; -28.2% vs -40.0% max drawdown). The momentum sleeve paid more for less.
- Bottom line: on this single live window the quality-tilted fund won on every risk-adjusted measure, but both funds carry small-AUM closure risk that matters more than the factor debate.
Two ETFs from the same issuer, launched the same day, charging the same fee, both branded as machine-learning-driven strategies on U.S. large caps. One leans toward a multi-factor "quality" read; the other concentrates on momentum. The central question is narrow and therefore answerable: when the cost and structure are held constant, what did the factor choice actually deliver over a real, live five-year window — and was the extra risk in the momentum sleeve compensated?
Context: what these two funds actually are
QRFT (QRAFT AI-Enhanced U.S. Large Cap ETF) and AMOM (QRAFT AI-Enhanced U.S. Large Cap Momentum ETF) both use a machine-learning model to reweight a U.S. large-cap universe. QRFT targets a broad multi-factor signal that includes quality characteristics; AMOM tilts the same machine toward price momentum. Both launched on 2019-05-20, both carry a 0.75% expense ratio, and both are actively managed in the sense that the model rebalances holdings rather than tracking a published index. If you are new to either, the deeper single-fund pieces — QRFT Explained and AMOM Explained — cover holdings and methodology in more detail.
One framing note before the numbers. With dividend yields of 0.3% (QRFT) and 0.1% (AMOM), neither is an income vehicle — against a federal funds rate of 3.63% (FRED, asof 2026-05-01), the distributions are a rounding error. These are pure total-return growth plays, and they should be judged on price return and risk, not yield.
The data side by side
| Metric | QRFT | AMOM |
|---|---|---|
| Name | QRAFT AI-Enhanced U.S. Large Cap | QRAFT AI-Enhanced U.S. Large Cap Momentum |
| Expense ratio | 0.75% | 0.75% |
| AUM | $0.016B ($15.8M) | $0.033B ($33.0M) |
| Inception | 2019-05-20 | 2019-05-20 |
| Dividend yield | 0.3% | 0.1% |
| 5Y CAGR | 11.9% | 11.3% |
| 5Y volatility (annualized) | 17.4% | 23.9% |
| 5Y max drawdown | -28.2% | -40.0% |
| NAV | $67.83 | $57.49 |
Price and return figures are from yfinance (pulled 2026-06-08); expense ratio, AUM, dividend yield, and inception are from the QRAFT issuer fact sheets (QRFT, AMOM). The 10-year column is intentionally blank: both funds are roughly six years old, so a 10Y CAGR does not exist yet.
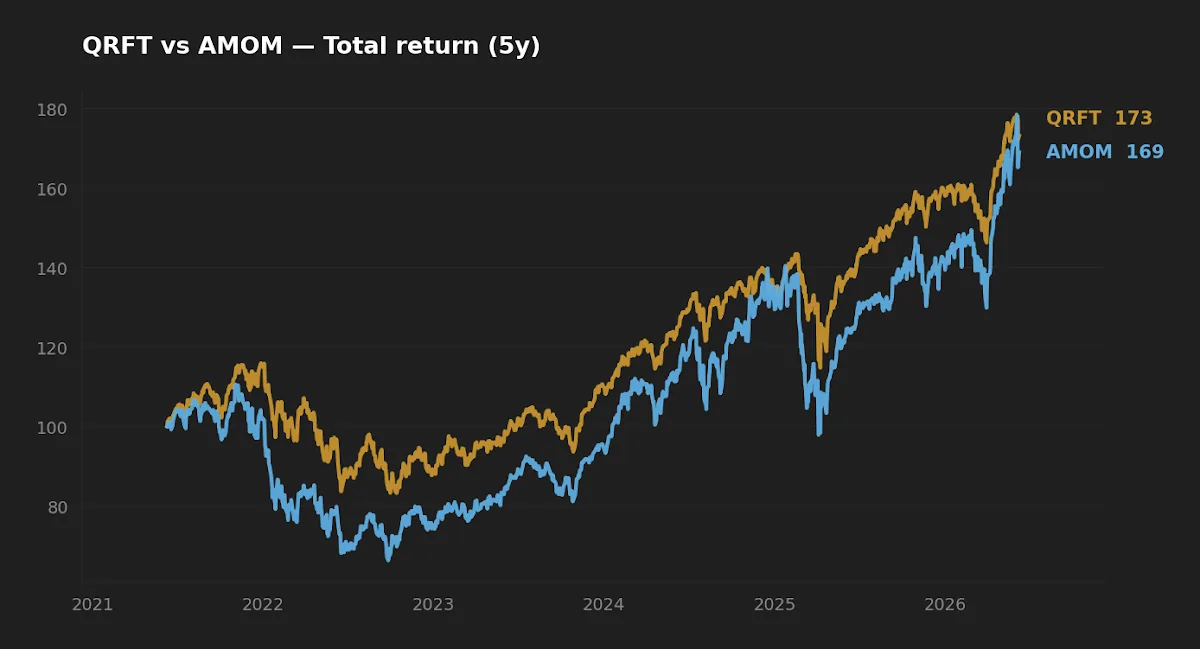
Same machine, divergent risk: what the factor choice cost
Because cost and structure are identical, the gap between these two funds is the cleanest factor-attribution experiment a retail investor is likely to find. And the result is asymmetric in an instructive way. QRFT produced a marginally higher five-year CAGR (11.9% vs 11.3%) while running about a third less volatility (17.4% vs 23.9%). The momentum tilt did not buy higher returns over this window — it bought a wider distribution of outcomes around a slightly lower mean.
A crude risk-adjusted read makes the point. Dividing CAGR by annualized volatility — not a true Sharpe ratio, since it ignores the risk-free rate, but a fair relative gauge — gives roughly 0.68 for QRFT and 0.47 for AMOM. That is a large spread for two funds from the same shop. Momentum as a factor has strong academic support (Jegadeesh and Titman's original work; Asness, Frazzini, and Pedersen on factor construction), but the literature also documents momentum's signature failure mode: sharp, violent crashes at market turning points. The drawdown data shows exactly that fingerprint.
Realized risk: the drawdown tells the real story
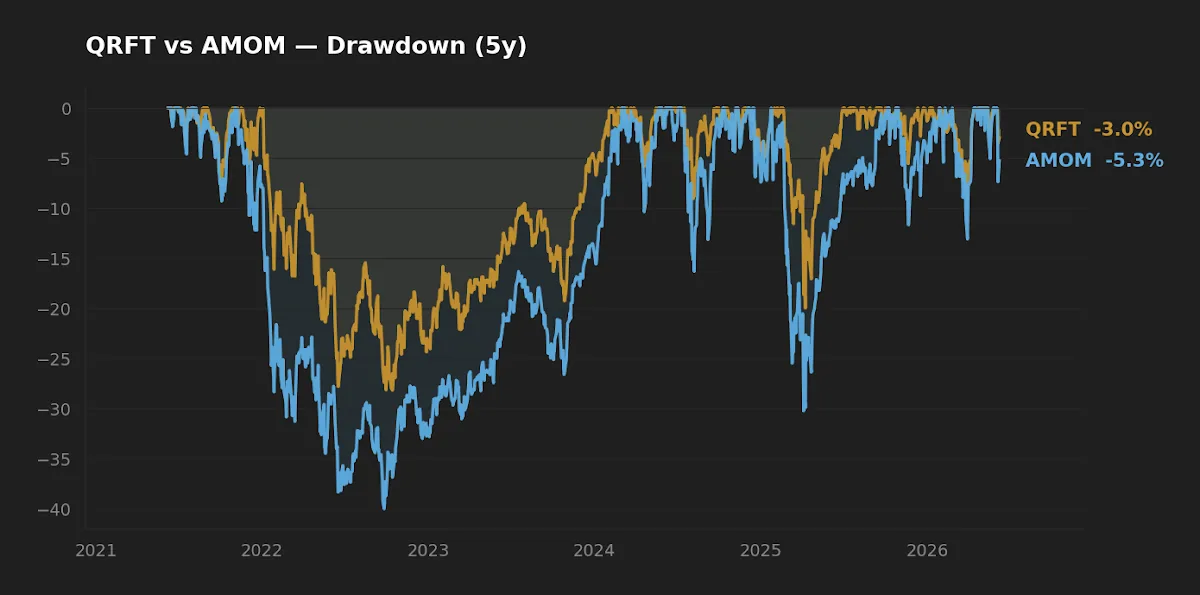
AMOM's worst peak-to-trough decline over the window was -40.0%, against -28.2% for QRFT — nearly 12 percentage points deeper. That is not a small difference in lived experience. A 40% drawdown requires a 67% gain just to break even; a 28% drawdown requires 39%. Momentum strategies tend to load up on whatever has been winning, which means at a regime turn they are maximally exposed to exactly the names that reverse hardest. The depth of AMOM's drawdown is the price of that concentration.
The behavioral consequence matters more than the arithmetic. Drawdown duration and depth are what drive investors to sell at the bottom. A fund that delivers a slightly lower return with a far gentler path is, for most real portfolios, the easier one to actually hold across a full cycle — and holding is where compounding happens.
AMOM carried roughly a third more volatility and a 12-point deeper drawdown to deliver a lower five-year return. Over this window, the momentum tilt was uncompensated risk.
The scale problem nobody markets
Here is the non-obvious observation, and it sits outside the factor debate entirely. AMOM holds about $33.0M in assets; QRFT holds about $15.8M. Both sit well below the rough $50–100M threshold at which an ETF is generally considered comfortably viable. At that size, two frictions compound: bid-ask spreads tend to be wider than the headline expense ratio suggests, and closure risk is real — small funds get shuttered, forcing an involuntary, potentially tax-inopportune liquidation on holders.
The second-order detail is the more interesting one. AMOM — the worse fund on every risk-adjusted measure here — has roughly twice the assets of QRFT. Momentum is the easier story to sell. "AI picks the winners and rides them" markets better to retail flows than "AI balances a quiet multi-factor blend," even when the quiet blend produced the better realized outcome. That is a scale-induced behavioral asymmetry, not an investment thesis, and it is worth naming because asset flows are not a quality signal. For how these AI-driven vehicles stack up against plain cap-weighted beta, the VOO vs AMOM read is the relevant companion, and QQQM vs QRFT frames the quality side against the Nasdaq 100.
The fee, against a thin edge
Both funds charge 0.75% — there is no fee gap to arbitrate between them, but the absolute level deserves scrutiny. A 0.75% expense ratio is roughly 25 times a plain S&P 500 index fund's cost. For an active model to justify that, it must generate persistent alpha net of fees, and it must do so across regimes, not just one. The live-versus-backtest gap is the recurring problem with model-driven funds: a signal that looks decisive in-sample often decays once it trades real money against real spreads. The honest read is that QRFT's edge over AMOM is visible, but neither fund's edge over cheap beta is established by this data alone. Cost compounds; faithfulness in small things — basis points — is not a slogan but the arithmetic of a multi-decade horizon.
| Category | Winner | Why |
|---|---|---|
| Cost | Tie | Both 0.75% |
| Realized risk | QRFT | Lower vol (17.4%), shallower drawdown (-28.2%) |
| Realized return | QRFT | 11.9% vs 11.3% 5Y CAGR |
| Suitability (long-term core) | QRFT | Better risk-adjusted path; easier to hold |
FAQ
Are QRFT and AMOM run by the same company? Yes. Both are QRAFT AI-Enhanced ETFs, launched 2019-05-20, with identical 0.75% expense ratios. They differ in factor tilt — QRFT broad multi-factor, AMOM momentum.
Why did the momentum fund underperform if momentum is a proven factor? Momentum has strong academic backing but is prone to sharp crashes at market turning points. Over this particular five-year window, AMOM's deeper -40.0% drawdown dragged its compounded return below QRFT's, despite higher volatility. One window is not a verdict on the factor itself.
Is the 0.75% fee worth it versus an index fund? That depends on whether the model produces durable alpha net of costs. This data shows QRFT beat AMOM, but does not establish that either beats a low-cost S&P 500 fund. The AI-managed ETF deep dive looks at that question across the category.
Should I worry about the small fund sizes? It is a legitimate concern. At $15.8M (QRFT) and $33.0M (AMOM), both face wider effective trading spreads and a non-trivial closure risk. Small-AUM funds can be liquidated, which may force an unwanted taxable event.
Do these funds pay meaningful dividends? No. Yields are 0.3% and 0.1% respectively — negligible against a 3.63% federal funds rate (FRED, asof 2026-05-01). They are total-return vehicles, not income holdings.
What this comparison can and can't tell you
It can tell you what happened over one continuous live window of roughly five years, with identical cost and structure isolating the factor tilt. It cannot tell you whether QRFT's edge persists — five years spans essentially one extended bull regime with a few sharp shocks, not a full sample of bear markets, rate cycles, and inflation regimes. With both funds under six years old, there is no 10-year record, no independent recession-versus-recession test, and a real look-ahead and single-regime risk in reading too much into the result. The drawdown figures are realized maxima over this window, not worst-case bounds.
Scenarios where each fund fits
A reader in their 30s, 401(k)-only, who wants a small AI-driven satellite tilt and prioritizes a smoother ride would find QRFT the more defensible of the two — better realized risk-adjusted return and a shallower drawdown to sit through. A reader explicitly seeking concentrated momentum exposure as a high-conviction satellite, who already understands and accepts crash risk, is the only profile for whom AMOM's wider distribution is a feature rather than a bug. For anyone treating either as a long-horizon core holding, the small AUM and 0.75% fee are the binding constraints — not the factor label.
Editor's read
If forced to choose one of these two, the editor leans toward QRFT: it delivered a higher five-year return with roughly a third less volatility and a 12-point shallower drawdown, which is the rare case where the lower-risk option also led on return. The more important caution sits above the factor debate — both funds are small enough that closure and spread risk outweigh the quality-versus-momentum question, and 0.75% is a steep toll for an edge that has not been demonstrated against cheap beta across a full cycle. Initially I expected momentum's higher volatility to come with a return premium; the rolling numbers over this window simply did not show one.
The editor does not hold QRFT or AMOM at the time of writing.
Methodology: Price, return, volatility, and drawdown figures from yfinance, pulled 2026-06-08, covering the trailing five-year window. Expense ratio, AUM, dividend yield, and inception from QRAFT issuer fact sheets. Macro figures from FRED (federal funds rate asof 2026-05-01; CPI YoY 3.9% asof 2026-04-01). Risk-adjusted ratios are CAGR divided by annualized volatility, a relative gauge that excludes the risk-free rate.
This article is for educational purposes and does not constitute personalized financial advice. See our full Disclaimer.