
Photo by Patriot Energy Drink on Unsplash
The short version
- Over the past five years, the rules-based iShares U.S. Equity Factor ETF (LRGF) returned 13.5% annualized; the AI-enhanced QRAFT U.S. Large Cap ETF (QRFT) returned 12.6% — at roughly nine times the expense ratio.
- LRGF also delivered the result with a shallower drawdown (-21.6% vs. -28.2%) and a fractionally lower realized volatility.
- QRFT's $14.9 million AUM, after almost seven years live, is a separate concern: small-fund closure risk is a real implementation friction that doesn't show up in trailing returns.
Over the past five years, the AI-enhanced QRAFT U.S. Large Cap ETF (QRFT) returned 12.6% annualized. The iShares U.S. Equity Factor ETF (LRGF), a transparent rules-based multi-factor portfolio, returned 13.5% — at roughly a ninth of the fee, with a meaningfully lower realized drawdown. The relevant question is not whether machine-learning-driven equity selection can ever beat a rules-based factor ETF; it's whether the gap, the cost structure, and the implementation friction make QRFT defensible for a long-horizon allocator at all.
This article walks through both funds on construction, cost, realized risk-adjusted return, and capacity. Price and return data is from yfinance, pulled 2026-05-16. Methodology and limits are at the bottom.
Context: what each fund actually is
QRFT (inception 2019-05-20) is QRAFT Technologies' AI-Enhanced U.S. Large Cap ETF. Per the issuer's product page, the strategy uses a proprietary machine-learning model to select U.S. large-cap equities, aiming to identify alpha that transparent factor models miss. Expense ratio is 0.75%. AUM sits at roughly $14.9 million as of mid-May 2026.
LRGF (inception 2015-04-28) is iShares' U.S. Equity Factor ETF. It tracks a published multi-factor index built on the BlackRock STOXX U.S. Equity Factor methodology, integrating value, quality, momentum, and low-volatility tilts within a U.S. large- and mid-cap universe. Expense ratio is 0.08%. AUM is roughly $3.26 billion.
Both funds operate in the same universe — U.S. large-cap equities — and both make non-cap-weighted selection decisions. The difference is in how those decisions are made: an opaque ML model in one case, a transparent rules-based factor index in the other. For background on the academic foundation behind LRGF-style construction, see Why "Factor Investing" Still Works: Applying Fama-French Models in the AI Era.
The data side by side
| Metric | QRFT | LRGF |
|---|---|---|
| Issuer | QRAFT Technologies | iShares (BlackRock) |
| Inception | 2019-05-20 | 2015-04-28 |
| Expense ratio | 0.75% | 0.08% |
| AUM | $14.9M | $3.26B |
| Distribution yield (TTM) | 0.3% | 1.1% |
| 5Y CAGR | 12.6% | 13.5% |
| 10Y CAGR | n/a (insufficient history) | 13.8% |
| 5Y annualized volatility | 17.4% | 17.1% |
| 5Y max drawdown | -28.2% | -21.6% |
Sources: yfinance (price and total return), QRAFT issuer product page for QRFT methodology and fee, iShares product page for LRGF methodology and fee. All return, volatility, and drawdown figures cover the trailing 5-year window ending 2026-05-14.
Five-year track record
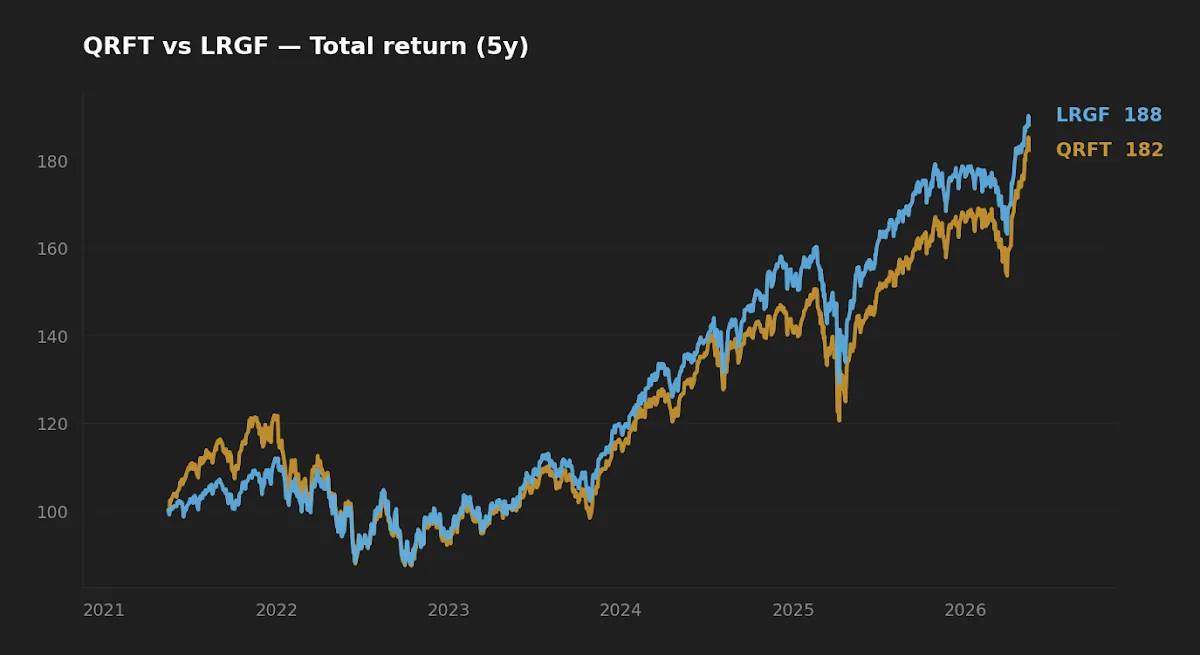
The cumulative return gap is about 90 basis points per year — meaningful but not overwhelming. What matters more is the shape: LRGF's path is consistently smoother through the 2022 drawdown and the 2024-25 recovery, with QRFT giving back more during stress and recovering at roughly the same pace. The fund marketed as the more sophisticated risk manager has, in the live record, posted the deeper drawdown.
The fee gap and what 67 basis points buys you
QRFT charges 0.75%. LRGF charges 0.08%. The gap is 67 basis points — larger than the entire expense ratio of most broad-market index ETFs.
To put it in dollar terms: on a $50,000 position held for 30 years at a 7% gross return, the LRGF position net of its 8 bp fee grows to roughly $377,000. The QRFT position at the same gross return but a 75 bp fee grows to roughly $310,500. The fee differential alone costs the investor about $66,500 — without the model needing to underperform at all. In the actual record, QRFT has also trailed by about 90 bp per year, which roughly doubles the gap.
What 67 bp does buy is access to a discretionary ML model that, in principle, could find non-linear patterns transparent factor indexes miss. The question is whether that optionality has actually shown up in live performance. So far it has not, and the burden of proof sits with the more expensive fund.
Realized risk
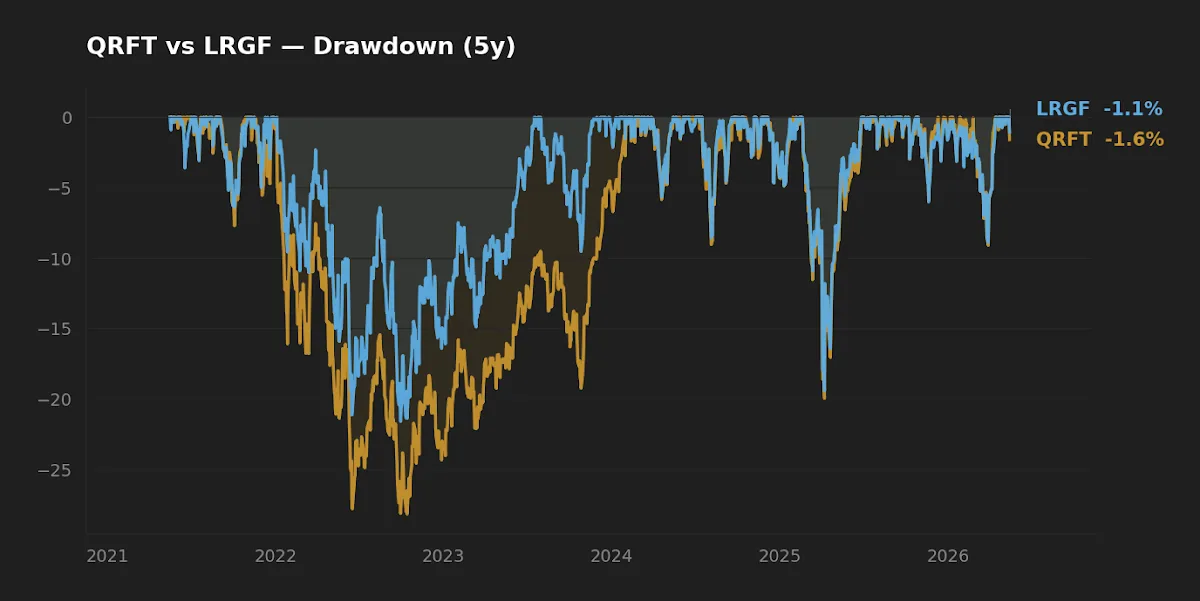
Five-year realized volatility is nearly identical — 17.4% for QRFT versus 17.1% for LRGF. That tells us the two funds carry comparable overall equity beta. But max drawdown diverges sharply: -28.2% for QRFT against -21.6% for LRGF. The 660 bp drawdown gap is the more interesting datapoint. It says QRFT is not simply more aggressive on beta; it is less efficient at managing the same beta. Whatever the model does during stress has not produced the left-tail protection that would justify an active fee.
LRGF's drawdown profile, by contrast, is roughly what a thoughtfully constructed multi-factor index should deliver: meaningful but not pathological participation in 2022's drawdown, with the low-volatility and quality tilts moderating the worst of it.
The AI label sold a thesis the live record has not yet validated. A rules-based multi-factor ETF charging nine basis points beat it by 90 basis points per year on a lower realized drawdown.
Capacity, scale, and closure risk
QRFT's $14.9 million AUM after almost seven years live is the quiet problem in this comparison. It sits well below the threshold most issuers consider economically self-sustaining for a single ETF — industry rule of thumb is roughly $50-100 million to cover listing, custody, and management costs without subsidy. QRAFT is a small specialist issuer, not a BlackRock or Vanguard with the balance sheet to subsidize a fund indefinitely.
This is not a prediction QRFT will close. It is a statement that closure risk is non-trivial and is not captured in any return-based metric. A long-horizon allocator buying QRFT today is implicitly betting AUM grows from here — because if the fund closes in five years, the allocator faces a forced taxable event in a taxable account plus reinvestment friction in either account type.
LRGF's $3.26 billion AUM is well past the point where capacity or closure is a concern. Bid-ask spreads are tight, premium/discount to NAV is small, and the institutional usage base is broad.
What "AI-enhanced" actually means in QRFT's live record
It is worth being precise about what the data does and doesn't say. We cannot conclude from one 5-year window that ML-driven equity selection doesn't work in general. We can conclude that this specific implementation, in this specific window, has not produced an after-fee edge over a transparent multi-factor alternative.
The 2021-2026 window covers a useful range of regimes: a low-rate inflation surge (2021-22), the most aggressive Fed tightening cycle in four decades (2022-23), and the AI-mega-cap concentration rally (2023-25). It is not single-regime. But it is also not a stress test on the order of 2008. Until QRFT survives a credit-driven downturn with measurable alpha, the verdict on the underlying strategy remains provisional — even though the verdict on the cost-versus-record tradeoff for this specific fund, at this AUM, is fairly clear.
Readers interested in how the broader category of AI-managed ETFs has fared may want to read the wider survey at Best AI-Managed ETFs for 2026: A Deep Dive into AIEQ and AMOM. For a narrower comparison of QRFT against straight Nasdaq-100 exposure, see QQQM vs. QRFT.
At-a-glance scoreboard
| Category | Winner | Margin |
|---|---|---|
| Cost | LRGF | Decisive — 67 bp |
| Realized return (5Y) | LRGF | Material — 90 bp/yr |
| Realized risk (5Y max drawdown) | LRGF | Material — 660 bp shallower |
| Track record length | LRGF | Decisive — 11 yr vs 7 yr |
| Capacity / closure risk | LRGF | Decisive — $3.26B vs $14.9M |
| Optionality on ML alpha discovery | QRFT | Theoretical only |
Scenarios where each fund fits
- Long-horizon investor building a US large-cap factor core (30-year frame, taxable or tax-advantaged): LRGF is the more defensible choice. Cost, realized record, drawdown profile, and capacity all point the same direction. The case for QRFT as core exposure is difficult to construct from the available data.
- Investor already holding broad market index exposure (VTI/VOO) and wanting a small factor tilt: LRGF as a 5-15% satellite is reasonable. The 8 bp fee makes it easy to size meaningfully without fee drag dominating the decision.
- Investor specifically wanting exposure to ML-driven equity selection as a research bet: QRFT is one available implementation, but the allocation should be sized as speculative — a 1-3% sleeve, not core — and closure risk should be priced in. The thesis being tested is not "does this fund beat the S&P 500" but "does ML-driven security selection produce after-fee alpha." The current answer from QRFT's live record is no.
- Non-US resident accessing US-listed funds via overseas brokerage: Withholding (typically 15% on US dividends under most tax treaties) applies to both. The fee differential and AUM gap are not jurisdiction-specific; they apply identically to non-USD investors after FX.
Editor's read
The case for LRGF in a long-horizon US large-cap factor sleeve is straightforward — 8 bp expense, eleven-year live record, shallower drawdown, $3.26B AUM, transparent factor methodology well-documented in the academic literature. The case for QRFT requires believing the model will produce future alpha the live record has not yet shown, while also accepting closure risk on a $14.9 million fund. If forced to pick one for a long-horizon US factor core, the editor leans toward LRGF without much hesitation — the asymmetry runs in only one direction.
Frequently asked questions
Q: Why has QRFT underperformed LRGF despite the AI marketing?
The 5-year data shows QRFT roughly 90 bp/yr behind on return and 660 bp worse on max drawdown. Without QRFT's full holdings disclosure we can't pinpoint cause, but the 67 bp expense ratio mechanically explains a large portion of the gap; the rest is residual model performance. The "AI-enhanced" label has not translated into measurable after-fee alpha in this window.
Q: Is QRFT's $14.9M AUM a real risk?
Yes. A fund this small after almost seven years live is below the threshold most issuers treat as economically self-sustaining. Closure isn't certain, but it is materially more likely than for LRGF, and closure forces a taxable event for shareholders in non-tax-advantaged accounts.
Q: Does LRGF's 1.1% yield versus QRFT's 0.3% yield create tax drag in a taxable account?
Marginally. LRGF's distributions are largely qualified dividends, taxed at long-term capital gains rates (0/15/20% in the US). For most US investors in a 24% marginal bracket, the after-tax difference from the yield gap is a few basis points per year — far smaller than the 67 bp expense gap that favors LRGF.
Q: How does this comparison hold up against current macro conditions?
With the 10-year Treasury at 4.47% (FRED, asof 2026-05-14), CPI YoY at 3.9% (FRED, asof 2026-04-01), and VIX at 17.3 (FRED, asof 2026-05-14), the 5-year window already includes the most recent tightening cycle. Neither fund's record was built only in a low-rate, low-vol regime. The factor exposures in LRGF — value, quality, momentum, low-vol — are well-suited to environments where cross-sectional dispersion is elevated, which a 17-handle VIX regime broadly supports.
Q: What would change the editor's view?
A sustained period — say, 3-5 years from now — where QRFT produces a measurable after-fee alpha over LRGF, particularly through a credit-driven drawdown. The current verdict is tied to a window that does not contain that kind of stress. Growth in QRFT's AUM past the $100M closure-risk threshold would also reduce the implementation friction concern, independent of returns.
Key takeaways
- LRGF wins on every measurable dimension over the 5-year window: cost (-67 bp), return (+90 bp/yr), drawdown (660 bp shallower), AUM (220x larger), and track record length (eleven years versus seven).
- The "AI-enhanced" thesis behind QRFT remains theoretical optionality. It has not yet shown up in after-fee performance.
- QRFT's $14.9M AUM is a real implementation friction, not a cosmetic concern. Long-horizon allocators should price closure risk into the position size.
- The fee math alone — 67 bp/yr compounded over 30 years — costs roughly $66,500 on a $50,000 position at a 7% gross return. The model needs to produce alpha well above that bar to justify the fee, and so far it has not.
What this comparison can and can't tell you
The 5-year window covers multiple regimes — a low-rate inflation surge, an aggressive tightening cycle, and an AI-mega-cap rally — but it is still one window. It does not contain a 2008-style credit shock. QRFT's seven-year live record is too short to evaluate behavior in a deep, prolonged drawdown. LRGF's eleven-year record at least includes the 2015-2016 industrial slowdown and the 2018-2020 cycle, giving it a modestly broader evidence base.
We also do not have QRFT's full holdings methodology in the public domain, so its factor exposures are inferred from realized return and risk rather than measured directly. A formal Fama-French 5-factor plus momentum regression would tighten the analysis, and the editor will revisit if QRFT's AUM grows enough to justify the work.
What this comparison can tell you: on cost, on capacity, on realized risk-adjusted return over the past five years, and on track-record length, the case for LRGF is straightforward, and the case for QRFT requires faith in a thesis the record has not yet validated.
Editor's holdings
The editor does not hold QRFT. The editor holds a long-term US large-cap factor sleeve that includes LRGF among similar implementations; no individual position size is disclosed.
Methodology
Price and return data sourced from yfinance, fetched 2026-05-16. Returns are total returns including reinvested distributions. CAGR is computed as annualized geometric return over the trailing 5-year window ending 2026-05-14. Max drawdown is the largest peak-to-trough decline over the same window. AUM, expense ratio, distribution yield, and inception date are taken from the respective issuer product pages (iShares LRGF product page; QRAFT QRFT product page). Macro context (10-year Treasury, fed funds rate, VIX, CPI) is from FRED, accessed 2026-05-16. The analysis reflects the same kind of cost, capacity, and risk-adjusted-return checks the editor applies in an in-house weekly portfolio review framework grounded in the rebalancing literature (Daryanani 2008; Vanguard 2024).
This article is for educational purposes and does not constitute personalized financial advice. See Disclaimer.
by the Mulden editor