
The short version
- Sequence-of-returns risk is not about the average return over 30 years — it is about which years the bad ones land in relative to when withdrawals begin.
- The "fragile decade" (roughly the five years before and five years after retirement) is where two identical 30-year average returns can produce one comfortable retirement and one ruined one.
- The 2022 bond drawdown was a reminder that the standard 60/40 shield can crack in exactly the regime where a pre-retiree most needs it to hold.
An investor with a 30-year working career and a 30-year retirement faces a peculiar arithmetic. Two people can finish their lives with identical lifetime average returns — say 7% nominal — and end up with very different outcomes based solely on when the bad years happened. The technical name for that asymmetry is sequence-of-returns risk, and it is the single largest preventable failure mode in long-horizon portfolio design.
This piece is not about predicting the next drawdown. It is about why the standard accumulation framework — buy broad equity, dollar-cost average, sit tight — quietly breaks down in the years closest to retirement, and what the past five years of data tell a long-term investor about the limits of the conventional "stocks-and-bonds" answer. The two reference tickers (SPY for broad US equity, BND for total US bond market) are not recommendations. They are the cleanest available proxies for the two asset classes that dominate retail retirement allocations, and their recent track record happens to illustrate the problem unusually well.
The two reference funds
| Metric | SPY | BND |
|---|---|---|
| Name | SPDR S&P 500 ETF Trust | Vanguard Total Bond Market ETF |
| Expense ratio | 0.09% | 0.03% |
| AUM | $735.1B | $389.7B |
| Inception (fund family) | 1993-01-22 | 2001-11-12 |
| Distribution yield (TTM) | 1.0% | 3.9% |
| 5Y CAGR | 13.8% | 0.1% |
| 10Y CAGR | 15.5% | 1.6% |
| 5Y annualized volatility | 17.1% | 6.0% |
| 5Y maximum drawdown | -24.5% | -17.9% |
Source: yfinance, pulled 2026-05-16. Methodology references: SPDR fact sheet (ssga.com/spy) and Vanguard fact sheet (investor.vanguard.com/etf/profile/BND). Macro figures used later are from FRED, with as-of dates noted in the methodology footer.
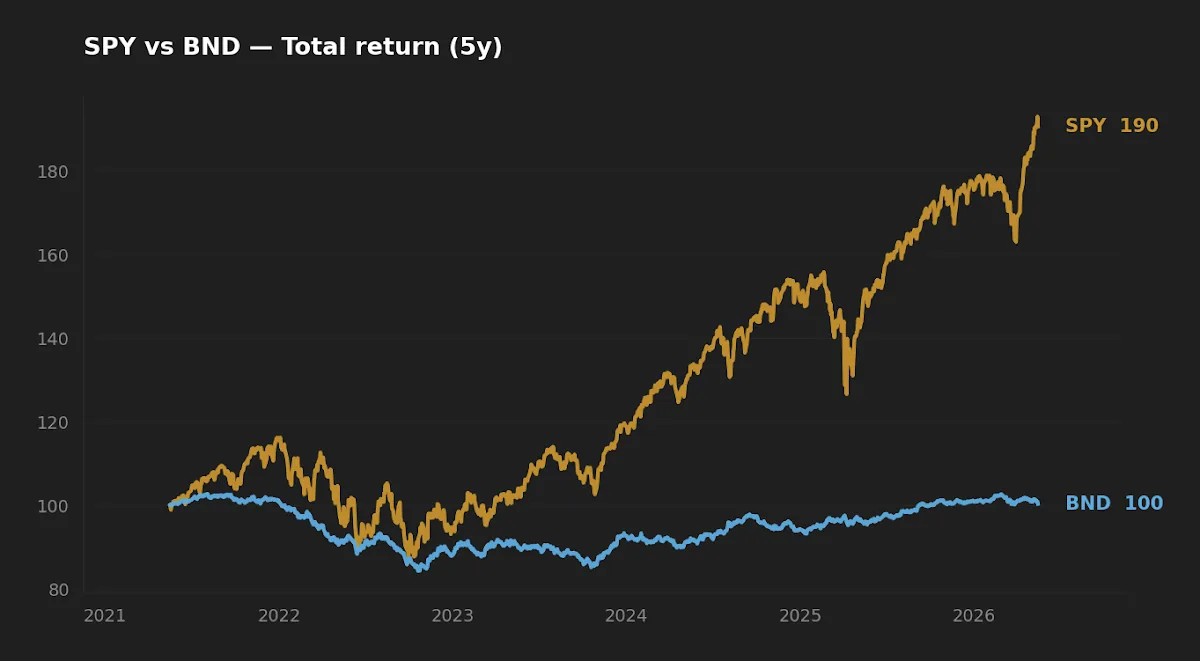
The fragile decade — where the math breaks
The standard retirement literature, from Bengen's original 4% paper through Pfau and Kitces's later refinements, converges on a single empirical observation: the path of returns in roughly the five years before and five years after the first withdrawal does more to determine the success or failure of a retirement plan than the path of returns over the surrounding decades. The mechanism is not subtle. When a portfolio is being depleted, a loss early in the withdrawal phase is taken from a larger dollar base than the same percentage loss a decade later. The shares sold to fund living expenses during a drawdown can never participate in the recovery. The arithmetic is one-way.
A worked example makes this concrete. Consider a 65-year-old retiring at the end of 2021 with $1,000,000 in SPY, withdrawing $40,000 a year — the textbook 4% rule. The 2022 drawdown carried SPY to a trough of roughly -24.5% (yfinance, 5Y window). After a $40,000 withdrawal taken from the depleted balance, the portfolio at the bottom was closer to $715,000. The retiree's effective withdrawal rate had climbed from 4.0% to roughly 5.6% — not because they spent more, but because the denominator collapsed. Every subsequent withdrawal compounds that disadvantage. The same drawdown, taken by a 35-year-old contributing to the same fund, would have been an opportunity to buy cheaper shares. For the retiree, the same percentage loss is a permanent step down in the funding ratio of the rest of their life. This is why the final five years of accumulation, and the first five of decumulation, decide so much.
What SPY's 5-year record actually shows
SPY's 13.8% five-year CAGR is, by historical standards, excellent. The 10-year figure of 15.5% is better. Read in isolation, those numbers paint US equity as the obvious answer to any question that begins "where should my retirement be?" The problem is what the smoothed CAGR hides. Over the same five-year window, SPY experienced a -24.5% peak-to-trough drawdown, a 17.1% annualized volatility, and a multi-quarter recovery period. For an investor still adding to the portfolio, those characteristics are immaterial. For an investor drawing from it, they are the only ones that matter.
Volatility is the wrong risk metric for the pre-retiree. The relevant metrics are maximum drawdown, drawdown duration, and the conditional probability of a drawdown coinciding with the onset of withdrawals. Standard mean-variance portfolio theory does not address any of these directly — it treats the investor's holding period as undifferentiated. The retirement literature treats it as the entire question.
The 2022 bond drawdown was a reminder that the standard 60/40 shield can crack in exactly the regime where a pre-retiree most needs it to hold.
The bond surprise — when the shield cracked
The reason a 60/40 portfolio became the textbook retirement allocation is straightforward: across most of the post-1981 era, Treasury bonds rallied when equities sold off. That negative correlation was the mechanism by which a fixed-income allocation cushioned an equity drawdown. The five-year window ending in 2026 is the first in two generations where that mechanism failed in a serious way. BND's five-year CAGR is 0.1% — essentially flat for half a decade — and its five-year maximum drawdown is -17.9%. The bond drawdown was not as deep as equity's, but it ran concurrent with it. A 60/40 investor in 2022 lost on both legs at once.
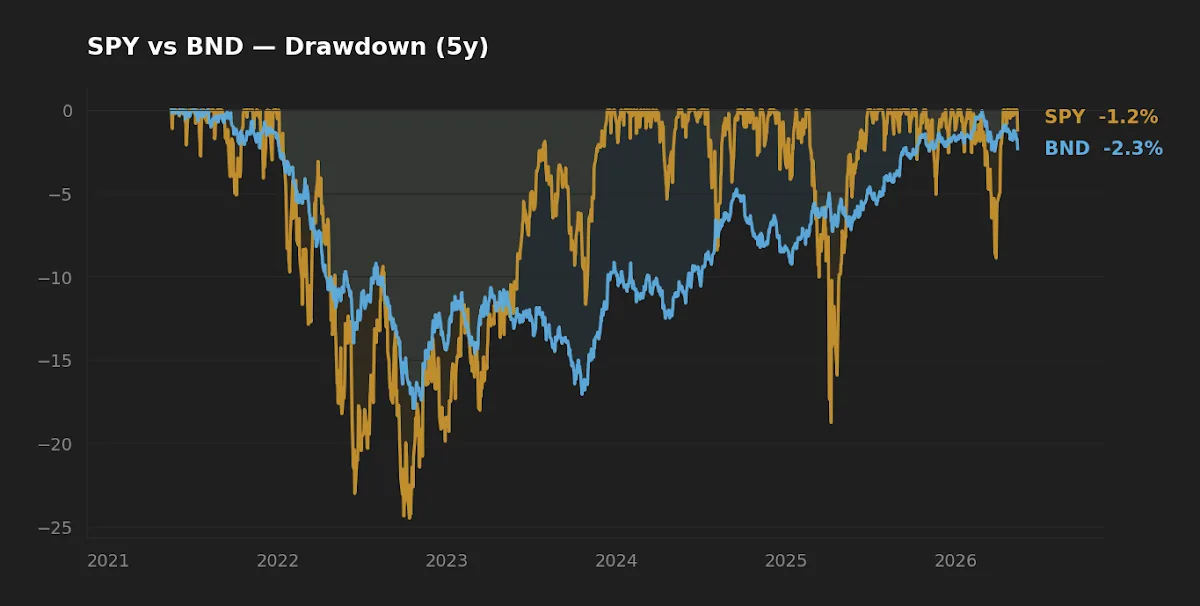
The reason is rate-regime-dependent. Bonds gain when discount rates fall; the 40-year tailwind that built the 60/40 reputation was the long descent from 1981's double-digit yields toward zero. Once the 10-year Treasury bottomed near 0.5% in 2020, there was no further room for prices to rally and considerable room for prices to fall. They did. The 10-year sits at 4.47% today (FRED, asof 2026-05-14), with the fed funds rate at 3.64% and CPI at 3.9% year over year. Bonds can function as a hedge again from this level — there is now room for yields to fall in a recession scenario — but a pre-retiree who built a plan on the 2010s correlation profile and the 2010s yield level should run the numbers again.
Glide paths and the bond tent
The traditional response to sequence risk is a glide path: progressively reduce equity weight as retirement approaches, on the theory that the investor cannot tolerate a deep drawdown in the final years before income begins. Target-date funds implement a version of this automatically. Pfau and Kitces's "bond tent" goes further: temporarily raise the bond and cash allocation in the years around retirement, then re-equity-ize through retirement once the fragile decade has passed. The empirical case is that sequence risk is concentrated, not uniform, and the asset mix should be heaviest in stable instruments precisely where the math is most punishing.
The unglamorous truth in both approaches is that the lower expected return of a bond-heavy mix in the fragile decade is the price of insurance. An investor who refuses to pay it is implicitly betting that no drawdown will coincide with their retirement date. That is a perfectly legitimate bet to make — markets have rewarded it more often than not — but it should be made consciously, not by default. When to step back from accumulation is exactly the question a pre-retiree should answer with intent.
What this five-year window cannot tell you
The five-year record contains exactly one significant stress event — the 2022 rate shock. It does not contain a 2008-style credit event, a 1970s-style stagflation, a Japan-style lost decade, or a 1987-style single-day crash. An investor calibrating their retirement plan on "what bonds did over the last five years" is calibrating to one regime, and the regime that produced BND's -17.9% drawdown is not the regime most likely to produce the next one. Single-window inference is the original sin of retail asset allocation. The literature on the 4% rule across multiple regimes exists precisely because no single window is representative.
At-a-glance scoreboard
| Question | Answer |
|---|---|
| Higher 5Y return | SPY (+13.7 percentage points per year) |
| Smaller 5Y maximum drawdown | BND (modest margin) |
| Lower 5Y volatility | BND (materially) |
| Better fit for fragile-decade core | A blend — neither alone is adequate |
| Functional hedge in a 2022-style regime | Neither held the line on its own |
Frequently asked questions
What exactly is sequence-of-returns risk? It is the dependence of a withdrawal plan's outcome on the order, not just the average, of investment returns. Two retirees with the same lifetime average return can finish with very different ending wealth if the bad years cluster near the start of withdrawals for one and near the end for the other.
Doesn't a long enough holding period average it out? During accumulation, largely yes. During decumulation, no. Each withdrawal sold during a drawdown is a permanent loss of shares from the portfolio. There is no recovery for the shares that were liquidated cheap.
Is the 4% rule still safe? The rule was derived from US data over a long historical window and has held up across most simulated retirement start dates. It is less robust to a regime in which both equities and bonds draw down together, which is the regime 2022 sampled. Most current research suggests 3.5%–4.0% as a conservative range, with the upper end reserved for portfolios that have explicit glide-path or bond-tent provisions.
Should a pre-retiree just hold more bonds? "More bonds" is the right direction but the wrong specificity. What matters is duration, credit quality, and the size of a near-term cash or short-Treasury sleeve. A standard recommendation is two to three years of expected withdrawals in instruments that will not draw down materially, so that equity sales during a drawdown are not forced.
How does the 2022 bond episode change the standard advice? It does not invalidate the role of bonds, but it disqualifies the assumption that any bond fund of any duration is automatically a hedge. With the 10-year now near 4.5%, bonds have room to function as a hedge again on the way down — but only if the next drawdown is led by growth weakness rather than by another inflation shock.
Scenarios where each asset fits
- Investor in their 30s, 30+ years to retirement: Heavy equity weight is rational. Sequence risk has not yet materialized; a deep drawdown is an opportunity to add at lower prices.
- Investor in their mid-50s, 10 years to retirement: The glide path should already be in motion. The cost of being wrong about the next 10 years' equity returns is asymmetric — a drawdown here is harder to recover from before withdrawals begin.
- Newly retired, drawing from the portfolio: The bond-tent literature points to a temporary peak in stable-asset weight at this point, with a 2–3 year cash or short-Treasury buffer. The goal is to never be forced to sell equity into a drawdown.
- 5+ years into retirement, fragile decade passed: If the buffer worked, the equity weight can creep back up to support the back end of a multi-decade retirement.
Editor's read
The single largest preventable failure mode the editor sees in retirement plans is treating accumulation-phase logic as if it still applies in the fragile decade. The math doesn't carry over: the same volatility that compounded gains during the working years can compound losses once withdrawals are running. The unglamorous answer — a deliberate, calendar-anchored shift toward stable instruments in the 5–10 years before retirement, accepting a lower expected return as the cost of that protection — has stood up across every regime study the editor has read. The 2022 episode adds a footnote: which bonds, of what duration, at what starting yield, matters. The category label "bond fund" is doing too much work in most allocation conversations.
The editor holds broad US equity exposure equivalent to SPY through a different ticker; does not currently hold BND. Position sizes and allocation percentages are not disclosed.
Key takeaways
- Sequence risk is concentrated in a narrow window around the retirement date — plan the allocation around that window, not around the 30-year average.
- The 5-year SPY record looks excellent in CAGR terms but contained a -24.5% drawdown that would have permanently impaired a new retiree drawing 4%.
- BND's -17.9% drawdown in the same window showed that the 60/40 shield is rate-regime-dependent, not a constant.
- With the 10-year Treasury at 4.47%, bonds have room to function as a hedge again — but only against growth-led drawdowns, not inflation-led ones.
- The bond-tent or glide-path approach is well-documented in the retirement literature and is the closest thing to a consensus answer to sequence risk.
Methodology
Price, return, volatility, and drawdown data were computed from yfinance total-return series pulled on 2026-05-16, over a five-year and ten-year trailing window respectively. CAGR figures are geometric. Maximum drawdown is the largest peak-to-trough decline within the window. Issuer-level facts (expense ratio methodology, distribution policy, AUM as of fund-reporting date) are sourced from the SPDR and Vanguard fact sheets linked above. Macro indicators — 10-year Treasury yield, fed funds rate, CPI year-over-year — are from FRED with as-of dates of 2026-05-14, 2026-04-01, and 2026-04-01 respectively. The reference to prior Mulden coverage of sequence risk is for the reader who wants the same idea framed historically rather than data-first.
This article is for educational purposes and does not constitute personalized financial advice. See full Disclaimer.