
The short version
- The arithmetic of a 30-year, $500/month plan at a 9% nominal CAGR has roughly 80% of the terminal balance coming from compounded returns, not from contributions — and the bulk of that growth concentrates in the last 5–7 years.
- Realized 5-year data (yfinance, fetched 2026-05-16) shows VOO at 13.9% CAGR, QQQM at 17.6%, SCHD at 8.2%, VXUS at 8.5% — a spread wide enough that fund selection matters less than time-in-market once horizons exceed 25 years.
- The fragile part of any long horizon is not the early grind but the sequence of returns near the end, when balances are largest and a single −25% drawdown moves more dollars than ten years of saving.
The question that gets framed as "can index funds make you a millionaire?" is, mathematically, trivially yes. The more useful question — and the one a long-term investor actually has to live with — is when the bulk of that wealth arrives, and how exposed the final balance is to what happens in the last decade rather than the first. The answer is uncomfortable: in a steady-contribution plan over 25–35 years, the majority of the terminal balance is created in the back third of the horizon, which is also the period when the portfolio is most vulnerable to a single bad drawdown.
This article works through that asymmetry using real ETF data (yfinance, fetched 2026-05-16), then asks what it implies for fund selection across VOO, QQQM, SCHD, and VXUS — four of the most common building blocks for a long-horizon equity sleeve.
The arithmetic of a long-horizon contribution plan
Take a stylized but defensible setup: $500 contributed monthly into an equity portfolio earning a 9% nominal CAGR (a number consistent with long-run US equity history, well below VOO's recent 5-year realized 13.9% and modestly below VOO's 10-year realized 15.6%). The future-value formula for a periodic contribution is:
FV = PMT × [((1 + r)n − 1) / r]
where PMT is the monthly contribution, r the monthly rate (annual ÷ 12), and n the number of months. Solving for a $1,000,000 target:
- $500/month at 9% reaches ~$1.0M in ~33 years. Contributions: $198,000. Compounded gain: $802,000 (~80% of terminal).
- $1,000/month at 9% reaches ~$1.0M in ~25 years. Contributions: $300,000. Compounded gain: $700,000 (~70%).
- $2,000/month at 9% reaches ~$1.0M in ~17 years. Contributions: $408,000. Compounded gain: $592,000 (~59%).
Two things are worth noticing. First, the higher the contribution, the smaller the relative role of compounding — at a 17-year horizon, you are mostly paying for the outcome with your own savings. Second, in all three cases the marginal year near the end produces far more terminal dollars than the marginal year near the beginning. For the $500/month case, the final 5 years account for roughly 40% of the ending balance even though they represent only 15% of the contributions. This is the asymmetry the title is pointing at, and it shapes everything downstream.
How the four candidate ETFs actually compare
The numbers below are pulled from yfinance on 2026-05-16; expense ratios and AUM are cross-checked against issuer fact sheets. PennyMac Mortgage Investment Trust (PMT) is excluded — it is a mortgage REIT, not an equity ETF, and was only present in the original title as the formula variable for monthly contribution.
| Ticker | Fund | ER | AUM | Yield | 5Y CAGR | 10Y CAGR | 5Y vol | 5Y max DD |
|---|---|---|---|---|---|---|---|---|
| VOO | Vanguard S&P 500 | 0.03% | $1,600B | 1.1% | 13.9% | 15.6% | 16.8% | −24.5% |
| QQQM | Invesco NASDAQ-100 | 0.15% | $82.9B | 0.5% | 17.6% | n/a* | 22.3% | −35.0% |
| SCHD | Schwab US Dividend Equity | 0.06% | $91.1B | 3.3% | 8.2% | 12.7% | 14.4% | −16.8% |
| VXUS | Vanguard Total International | 0.05% | $629.1B | 2.8% | 8.5% | 9.7% | 16.0% | −29.4% |
*QQQM inception was 2020-10-13, so a 10-year track is not yet available; the older QQQ series provides comparable exposure for longer-window analysis. Data: yfinance 2026-05-16; ER and AUM verified against issuer fact sheets (Vanguard, Invesco, Schwab).
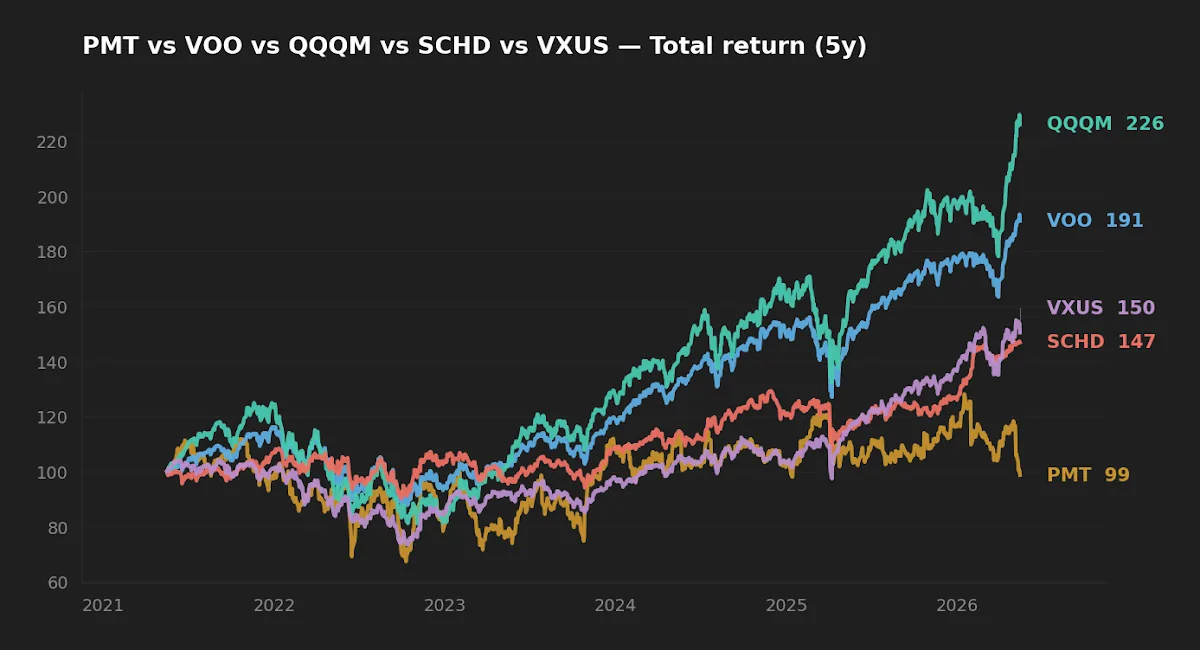
The 5-year window flatters the NASDAQ-100 exposure. From 2021 onward, the AI capex cycle drove cap-weighted concentration in a handful of mega-cap names, which QQQM holds with a heavier weight than VOO. That tailwind shows up cleanly in QQQM's 17.6% CAGR, but also in its 22.3% realized volatility and −35.0% peak drawdown — the cost of the return. Reading a single 5-year window as a permanent capability is the textbook recency-bias error, and the academic literature on factor returns (Fama & French, and the long line of work from AQR on factor cyclicality) is consistent on this point: factor and style premia are noisy over 5-year windows and only resolve over multiple regimes.
Why the final 5–7 years matter disproportionately
The intuition is mechanical. A 25% drawdown applied to a $50,000 portfolio in year 5 costs $12,500 — recoverable in roughly two years of saving at $500/month. The same 25% applied to a $900,000 portfolio in year 32 costs $225,000 — more than the investor's entire cumulative contribution over the prior decade. The dollars at risk scale with the balance; the human capacity to refill them does not.
A 25% drawdown in year 5 costs roughly two years of saving to repair. The same drawdown in year 32 costs more than the prior decade of contributions combined.
This is sequence-of-returns risk in its accumulation form, and it is the structural reason long-horizon investors are not simply "the equity people who can afford to ignore volatility." They can ignore early volatility cheaply; they cannot ignore late volatility cheaply. The realized 5-year drawdown profiles above are therefore not academic — they describe how much of a portfolio's terminal balance is exposed if a similar event lands inside the back third of the horizon.
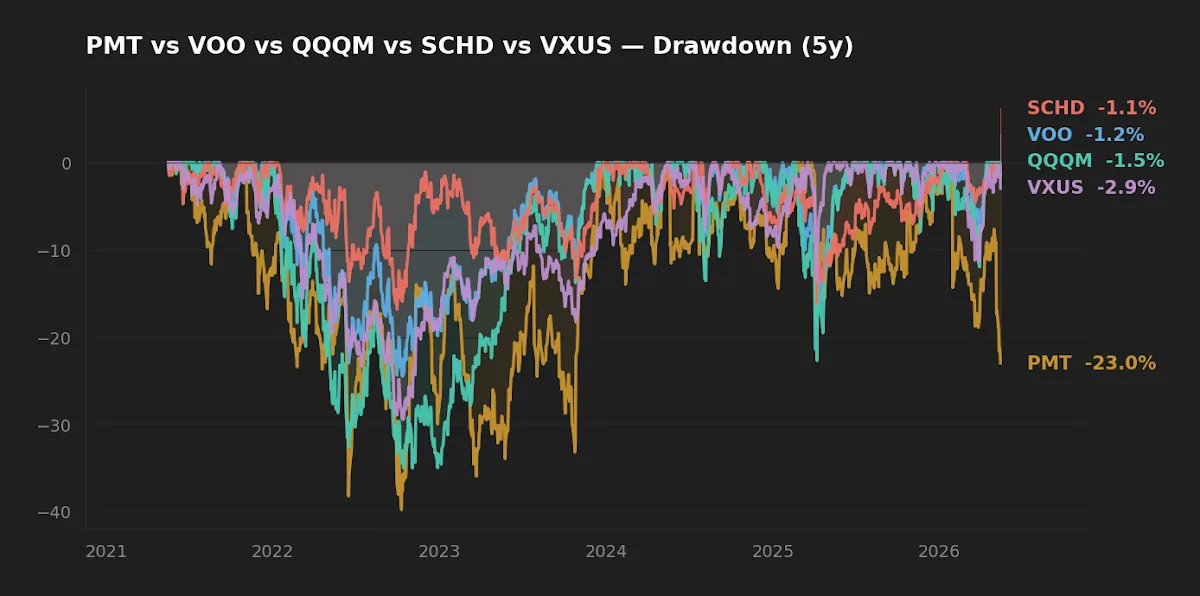
The drawdown chart is where SCHD earns the case for a late-cycle role. Its rules-based dividend screen — quality and payout durability — produces a realized 5-year max drawdown of −16.8%, materially shallower than VOO's −24.5%, VXUS's −29.4%, or QQQM's −35.0%. That is not a free lunch (SCHD also gave up roughly 570 bps of annualized return vs. VOO over the same window), but for an investor whose balance is large enough that drawdown magnitude dominates contribution arithmetic, the trade has measurable value.
What the rate environment changes in 2026
The macro backdrop is non-trivial here. As of mid-May 2026, the 10-year Treasury sits at 4.47% (FRED, asof 2026-05-14), the federal funds rate at 3.64% (FRED, asof 2026-04-01), VIX at 17.26 (FRED, asof 2026-05-14), and headline CPI YoY at 3.95% (FRED, asof 2026-04-01). With short and long rates this close to a dividend ETF's yield, SCHD's 3.3% yield no longer looks heroic on a relative basis — an investor comparing pure income against cash equivalents is in a different regime than the zero-rate era when SCHD launched. The asset still earns its keep on long-horizon total return and drawdown profile, but the "yield premium vs. cash" thesis has narrowed considerably. Honest framing matters here.
A note on contribution math and crashes
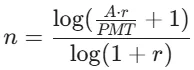
The popular framing — "a crash is good for accumulators because you buy more shares" — is half true and worth qualifying. It is true early in the horizon, when contributions dominate balance, and largely false late in the horizon, when balance dominates contributions. For the $500/month, 33-year plan, the inflection lies somewhere around year 18–22: before that, a 30% drawdown is a discount; after that, a 30% drawdown is a deferred retirement. The same investor needs different mental models at different ages, even with the same strategy on paper.
Scoreboard: who wins what
| Category | Winner | Reason |
|---|---|---|
| Cost | VOO | 0.03% ER, lowest in group. |
| Realized 5Y return | QQQM | 17.6% CAGR, driven by mega-cap tech concentration. |
| Realized 5Y drawdown | SCHD | −16.8%, materially shallower than peers. |
| Long-horizon core suitability | VOO | Scale ($1.6T), cost, and broad market beta with 15.6% 10Y CAGR. |
| International diversification | VXUS | Only fund in group with non-US exposure; 9.7% 10Y CAGR. |
FAQ
Q. Is 9% a realistic long-run assumption?
It is consistent with US large-cap history (roughly 9–10% nominal CAGR since 1928) but optimistic versus most "world equity" return forecasts from major shops, which cluster nearer 6–8% nominal for the next decade given starting valuations. Running the same future-value math at 7% rather than 9% adds about 5 years to a $500/month plan.
Q. Doesn't a heavier QQQM weight just dominate over 30 years?
It dominates in the window we measured. The realized 5-year return reflects a single regime — concentrated mega-cap tech leadership. Over 30 years the same NASDAQ-100 index has had multiple multi-year periods of underperformance versus the broader market, including a deep one in the early 2000s. The 5Y CAGR is not a forecast.
Q. Why include VXUS if international has underperformed for years?
Diversification is bought before it pays. The same data that shows VXUS's 9.7% 10Y CAGR trailing VOO's 15.6% also shows international leadership in several prior decades (1970s, 1980s, 2000s). The honest framing is that VXUS reduces single-country regime risk, not that it adds expected return.
Q. Where does SCHD's lower drawdown come from?
The Dow Jones US Dividend 100 Index screens for cash flow to debt, ROE, dividend yield, and 5-year dividend growth. The result is a portfolio tilted toward profitable, lower-beta companies — quality and yield factors. Empirically that produces shallower drawdowns and lower vol, at the cost of less participation in growth-led rallies.
Q. Should the allocation change as the horizon shortens?
Mechanically, yes. The argument above — that late drawdowns are far more costly than early drawdowns — is itself the case for shifting toward lower-volatility equity (and eventually fixed income) as the horizon shortens. The editor's in-house portfolio review framework, grounded in the rebalancing literature (Daryanani 2008; Vanguard 2024), uses ±15% / ±25% bands rather than calendar rebalancing for this reason: thresholds adapt to volatility regime, calendar rules do not.
What this analysis can and can't tell you
The 5-year window covers a single macro regime: post-COVID recovery, the 2022 rate shock, the 2023–2025 AI capex cycle, and the disinflation phase that followed. It does not contain a 1970s-style stagflation, a 2000–2002-style growth-stock unwind, or a 2008-style credit event. The 10-year window picks up 2015–2025, which includes COVID but not a structural growth-to-value rotation of multi-year duration. Both windows favor US large-cap concentration, and both end at a point of historically elevated US market cap weight in global indices. A reader extrapolating these CAGRs forward for 30 years is, in a real sense, betting on one regime continuing — which the academic literature consistently warns against.
Scenarios where each fits
For a reader in their 30s with a 30-year horizon and no current equity portfolio, a low-cost cap-weighted US index (VOO) plus an international sleeve (VXUS) is the textbook starting point — broad beta, minimum tracking error against a global equity benchmark, lowest total fee. A QQQM tilt is defensible as a satellite for an investor who has thought clearly about concentration risk and is comfortable with a −35% drawdown when (not if) it happens. SCHD becomes more interesting as the horizon shortens past 10–15 years, because that is when the drawdown asymmetry above starts to bite.
Adjacent reading on this site: the earlier piece on whether $1M is reachable with index funds, the sequence-risk analysis for the pre-retirement window, the case for adding AVUV and VXUS to a VOO core, and the factor-investing piece on Fama–French in the current cycle.
Editor's read
If forced to compress the argument: the early years of a long-horizon plan are about behavior — keep contributing, ignore the noise. The final years are about exposure — make sure a single late drawdown does not undo two decades of patience. The portfolios that succeed are not the ones that maximized return in year 5; they are the ones whose allocation reflected which problem they were solving in year 25.
Editor's holdings. The editor holds positions in US large-cap equity, broad international equity, and dividend equity ETFs in the categories discussed. Specific allocations and dollar amounts are not disclosed.
Methodology. Return, volatility, and drawdown statistics computed from daily adjusted-close prices via yfinance, pulled 2026-05-16. Expense ratios and AUM cross-checked against issuer fact sheets (Vanguard for VOO and VXUS; Invesco for QQQM; Schwab for SCHD). Macro inputs from FRED, asof dates cited inline. Future-value math uses the standard ordinary-annuity formula at a 9% nominal annual rate compounded monthly.
This article is for educational purposes and does not constitute personalized financial advice. See Disclaimer.