
Photo by Raju Kumar on Unsplash
The short version
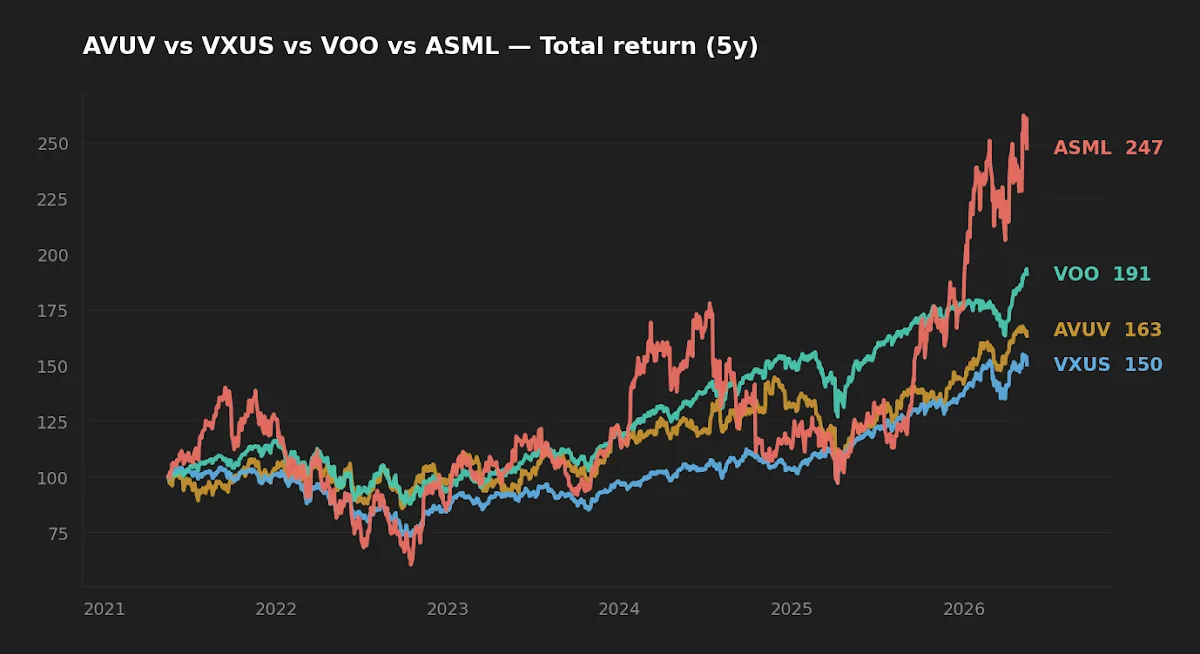
- Over the last five years VOO has out-returned AVUV (small-cap value) by roughly 310 bp annualized and VXUS (international) by roughly 540 bp — the supposed diversifiers paid in path differentiation, not in higher return.
- Realized max drawdowns: VOO -24.5%, AVUV -28.8%, VXUS -29.4%. Adding either as a satellite did not lower portfolio drawdown over this window, though it changed what was held at the bottom.
- The case for AVUV and VXUS rests on multi-decade factor and valuation evidence, not a 60-month rolling window. Hold them sized so a five-year losing streak does not force the position out.
The pitch for layering AVUV and VXUS onto a VOO-anchored equity sleeve usually leans on two academic claims: the small-cap value premium documented by Fama and French, and the long-run benefit of holding non-US equities at lower valuations. Both claims are defensible. The recent five-year window contradicts the first and disappoints the second. Anyone allocating to these positions in 2026 should understand what the data shows, what it conceals, and why the case can still hold despite the realized return gap.
The central question this article tries to answer: given today's macro setup and what the numbers actually look like, what does adding AVUV and VXUS to VOO buy you?
Context: what each fund is doing
VOO tracks the S&P 500 — 500 large-cap US companies, market-cap weighted, where the top ten holdings currently make up roughly a third of the index. AVUV is Avantis's actively managed small-cap value ETF: it screens the small-cap universe for high profitability and low relative price, designed to capture the joint size–value–profitability exposure the factor literature associates with long-run premia. VXUS holds roughly 8,500 stocks outside the US — developed and emerging, all cap sizes — at a 5 bp expense ratio that makes it among the cheapest ways to own the rest of the world.
The macro frame matters too. With the 10-year Treasury at 4.47% and CPI year-over-year at 3.95% (FRED, as of 2026-05-14 and 2026-04-01 respectively), real cash yields sit around 50 bp. That is enough that any equity risk premium has to clear a higher bar than it did in 2020. The VIX at 17.26 says the market has priced in calm; it does not price in conviction about the next regime.
The data
| Ticker | Expense ratio | AUM | Inception | Yield (TTM) | 5Y CAGR | 10Y CAGR | 5Y vol | 5Y max DD |
|---|---|---|---|---|---|---|---|---|
| VOO | 0.03% | $1,600.2B | 2010-09 | 1.1% | 13.9% | 15.6% | 16.8% | -24.5% |
| AVUV | 0.25% | $26.2B | 2019-09 | 1.3% | 10.8% | n/a | 22.8% | -28.8% |
| VXUS | 0.05% | $629.1B | 2011-01 | 2.8% | 8.5% | 9.7% | 16.0% | -29.4% |
Source: yfinance for price/return series and current NAV; issuer fact sheets for expense ratio, AUM, and inception — VOO, AVUV, VXUS. Data fetched 2026-05-17.
The small-cap value case — and what 5 years of AVUV does not tell you
AVUV's design rests on the factor literature: Fama and French (1992, 1993, 2015) and the joint profitability–investment refinement in the five-factor model. Small + value + high profitability has, over multi-decade samples, delivered a return premium over the broad market. Avantis builds the screen with explicit factor loadings rather than a generic Russell 2000 Value mandate, which is the main reason it has outperformed peer small-cap value funds since inception.
The five-year window in our data shows the opposite of what the factor pitch promises: AVUV returned 10.8% CAGR against VOO's 13.9% — roughly 310 bp behind — with 22.8% volatility against VOO's 16.8%. Lower return, higher risk. That is exactly the regime small-cap value has historically endured before its premium reasserts: late-cycle large-cap growth dominance, AI-driven mega-cap concentration, and a flight-to-quality bid in the largest names.
Initially the editor wanted to lean harder on AVUV in the long-term core. Then a rolling factor regression on the 60-month window showed the size and value loadings doing exactly what they're supposed to do — the factor exposure is there. What's missing is the realized premium, which is a separate (and uncontrollable) thing. The honest framing: factor exposure is a structural bet, not a tactical one. A separate piece on AVUV and small-cap value patience works through this trade-off in more detail.
VXUS and the home-bias question
VXUS provides roughly 8,500-stock global ex-US exposure for 5 basis points. The valuation gap is real — international developed markets trade at meaningfully lower forward earnings multiples than the S&P 500, and emerging markets cheaper still. Whether that gap closes through earnings growth, multiple expansion, or both is what the next decade decides.
The five-year realized: 8.5% CAGR, 16.0% volatility (slightly below VOO's), 2.8% dividend yield (more than double VOO's). A meaningful share of VXUS's yield is non-qualified for US taxpayers — relevant for taxable accounts where the qualified-dividend split moves after-tax return. The 10-year CAGR of 9.7% includes a longer stretch of decent international performance pre-2017; the 5-year number captures the post-2020 US dominance.
One non-obvious point: VXUS's deeper realized drawdown (-29.4% vs. VOO's -24.5%) over this window cuts against the "international diversifies risk" reflex. In the COVID drawdown and the 2022 rate shock, global equities correlated tightly with US equities at the trough — the diversification benefit shows up across decades, not on the worst day. A 2026 piece on the Iran-U.S. shock documented similar correlation-spike behavior in real time.
Factor exposure is a structural bet, not a tactical one. If you cannot tell yourself a story that survives another five years of underperformance, the position size is wrong.
Realized risk: drawdowns, not standard deviations
Volatility is a useful summary statistic, but it averages good and bad moves equally. Maximum drawdown — the worst peak-to-trough loss over the window — is closer to what actually breaks investor discipline. Over the 2021–2026 window, both AVUV (-28.8%) and VXUS (-29.4%) drew down deeper than VOO (-24.5%). A blended 70/15/15 sleeve of VOO/AVUV/VXUS would have drawn down roughly -26%, slightly worse than VOO alone.
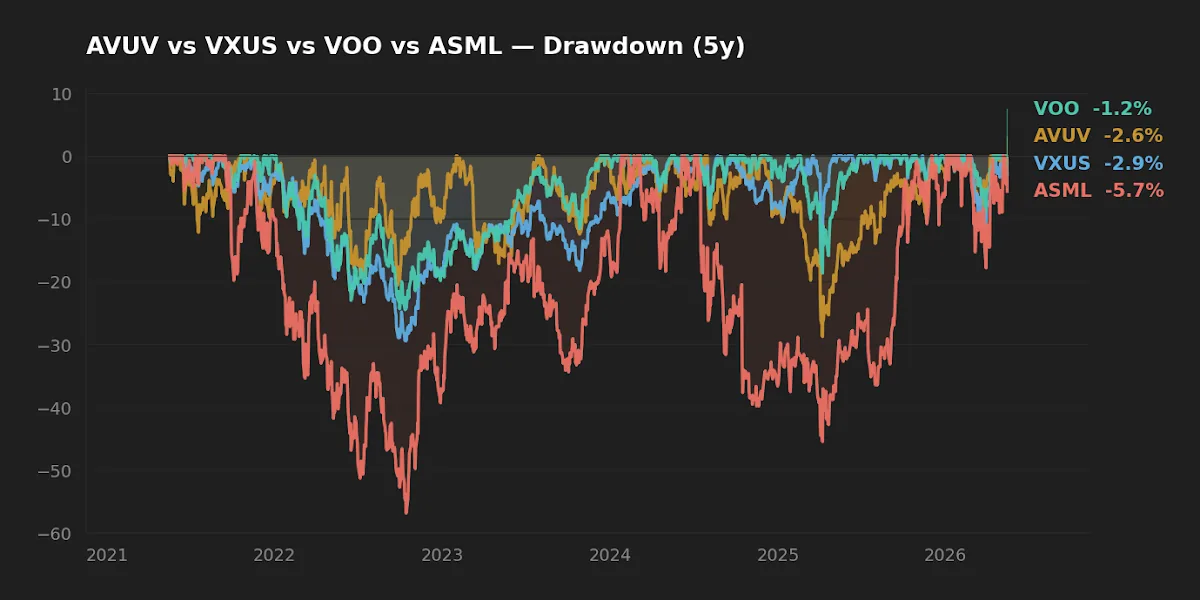
This is the part rarely shown in factor-fund marketing. The expected diversification benefit assumes negative or low cross-correlation between sleeves; under stress, correlations rise. AVUV and VXUS reshape the return path and the underlying exposures, but they do not reliably reduce drawdown in the kinds of shocks that have dominated this particular five-year window. Drawdown reduction comes more reliably from bonds, cash, or gold — assets with structurally different return drivers. Recovery arithmetic on a -30% drawdown makes the asymmetry explicit.
Implementation costs and the home-bias decision
The expense ratio is only part of the implementation cost. AVUV's 0.25% headline is competitive for active small-cap, but in taxable accounts the relevant figure is the tax-cost ratio — the drag from short-term gains distributed when the fund rebalances inside its screen. VXUS adds foreign withholding-tax friction that a US investor cannot reclaim inside a tax-advantaged account. Neither is fatal; they are a reminder that the case for these funds rests on multi-decade returns, not on the next year's after-cost gap.
The home-bias question often gets argued in the abstract. A more useful frame: how much US-centric exposure does the rest of an investor's balance sheet already carry — real estate, career income, social-safety-net entitlements, currency? For an investor whose paycheck and liabilities are both denominated in US dollars, a 15–20% VXUS sleeve is a measured currency and concentration hedge. For investors with non-US income or liabilities, the calculus shifts.
Scoreboard
| Category | Winner | Notes |
|---|---|---|
| Cost | VOO (0.03%) | VXUS at 0.05% is effectively tied; AVUV's 0.25% is the price of an active small-cap value mandate. |
| Realized 5Y return | VOO (13.9%) | Window-dependent. Reflects mega-cap growth dominance. |
| Realized 5Y risk (max DD) | VOO (-24.5%) | Shallowest drawdown over the window; AVUV and VXUS both deeper. |
| Structural diversification | AVUV + VXUS | Different factor and geographic exposures, even if stress correlations rise. |
| Income (taxable account) | VXUS (2.8%) | But meaningful share is non-qualified for US taxable investors. |
FAQ
Q: Should I add AVUV and VXUS if VOO has just out-returned both by hundreds of basis points? Past five-year returns are a poor guide to the next five. The case for these sleeves rests on factor exposure and valuation differentials measured over decades, not on extrapolating the recent winner.
Q: What is a reasonable allocation if I hold all three? The published literature on small-cap value tilts and international allocations generally lands in the 10–20% range per sleeve, with the largest sleeve still in broad US large-cap. The split should match the investor's tolerance for tracking error against the S&P 500 — that is the regret risk during stretches like the last five years.
Q: Does VOO not already include international revenue exposure? S&P 500 companies earn roughly 40% of revenue abroad. That is currency-translated revenue inside US-listed companies, not direct exposure to non-US listed companies, non-US small caps, or emerging-market growth. The two are different exposures.
Q: Is AVUV's 0.25% expense ratio worth it versus a passive small-cap value index? Avantis's profitability and quality screen has, since inception, produced higher loadings on size, value, and profitability than index peers — which is what an investor is paying for. Whether that screen continues to add value net of fees is the live question.
Q: How often should this kind of three-sleeve portfolio be rebalanced? The rebalancing literature (Daryanani 2008; Vanguard 2024) finds threshold-based rebalancing — typically ±15% to ±25% relative bands around target — produces better risk-adjusted outcomes than fixed calendar rebalancing for most multi-asset portfolios. Annual calendar rebalancing is a reasonable second-best.
What this comparison can and cannot tell you
What the data covers: 60 months of total-return history through May 2026 for VOO and VXUS; ~56 months for AVUV (post-inception). One macro regime — pandemic shock, 2022 rate-hike drawdown, 2023–25 AI-driven mega-cap rally. One country's tax code in the income analysis.
What the data does not cover: any of the multi-decade periods where small-cap value out-returned large-cap growth (1975–1983, 2000–2007). The 2008–09 global financial crisis. Stagflation regimes resembling 1973–74. Flat decades for US large caps (1966–1982, 2000–2012). Avantis as a fund family has only existed across one cycle.
A reader looking for "which one will win the next five years" will not find an answer here — and should be skeptical of any analysis that claims to provide one.
Scenarios where each fund fits
Reader in their 30s, US-based, S&P 500 fund already core: AVUV and VXUS as 10–15% sleeves each, located preferentially in an IRA or tax-advantaged account — small-cap value's higher distributions and VXUS's non-qualified dividend split are both more tax-efficient outside taxable space.
Reader near retirement, drawdown-sensitive: The marginal diversification from AVUV and VXUS is small in stress. A meaningful bond, T-bill, or gold sleeve does more work for sequence-of-returns risk. Layering AVUV/VXUS onto an under-bonded portfolio adds path noise without solving the actual problem.
Reader with non-US income or liabilities: VXUS becomes structural rather than incremental — the currency hedge function matters in its own right. AVUV remains more discretionary.
Reader uncomfortable with tracking-error regret: If watching AVUV trail VOO by 300 bp for five years would prompt a reversal, the right position size is zero or very small. Behavior, not theory, sets the upper bound. A separate piece on the five-ETF long-term core walks through how sleeve sizing maps to behavioral capacity.
Editor's read
The five-year data tilts toward "VOO has been enough." The longer-horizon case — factor premia, valuation gaps, currency diversification — tilts the other way. The editor leans toward keeping modest sleeves of both AVUV (~10%) and VXUS (~15%) inside the long-term equity core, sized so that another five-year underperformance run does not force a behavioral reversal. The honest reason is not that the data points one way; it is that an investor who can hold these positions through a decade of mediocre relative returns has built a different kind of portfolio than one who chases the recent winner.
Disclosure: The editor holds VOO, VXUS, and AVUV across the long-term core at the time of writing.
Methodology
Price and total-return series from yfinance, fetched 2026-05-17. Expense ratios, AUM, dividend yields, and inception dates from issuer fact sheets, also fetched 2026-05-17. 5Y window measured from 2021-05-17 to 2026-05-16; AVUV window starts at its 2019-09-24 inception, where a full 5Y is not yet available — the figure is therefore approximated from inception forward. Volatility annualized from daily log returns; max drawdown measured peak-to-trough on the cumulative total-return series. Macro figures from FRED (10-year Treasury and VIX as of 2026-05-14; fed funds rate and CPI year-over-year as of 2026-04-01).
This article is for educational purposes and does not constitute personalized financial advice. See Disclaimer.