
The short version
- Over a 30-year horizon, a 1-percentage-point reduction in annual tax drag compounds into roughly a one-third increase in terminal wealth — not because of better stock picks, but because of after-tax arithmetic.
- Tax-loss harvesting (TLH) is mechanical: realize a paper loss, redeploy into a non-substantially-identical fund, keep market exposure intact. The benefit is real but bounded by the wash-sale rule, the eventual basis reset, and your marginal rate.
- Recent five-year drawdowns in long-duration Treasuries (TLH the ETF, -35.4% max DD) and broad equity sleeves (VOO -24.5%, QQQM -35.0%) created genuine harvest windows. The harder problem is restraint, not opportunity.
Most retail commentary on tax-loss harvesting treats it as a clever trick. It is not. It is a small, repeatable structural adjustment that defers tax liability and, in a taxable account, mechanically raises after-tax compounding. The size of the benefit is bounded — by your marginal rate, by the wash-sale rule, by the basis reset at sale — but it is one of the few sources of after-tax alpha that does not require any prediction about the market.
This piece walks through the actual math, the implementation friction, and what real five-year ETF drawdown data implies about how often genuine harvest windows have appeared. The unifying question: in a taxable, long-horizon core, where does TLH earn its keep, and where is the published benefit overstated?
Context: where the tax drag actually comes from
In a taxable account, return is leaked through three channels: qualified dividend distributions, non-qualified income (often from bond funds and REITs), and realized capital gains from rebalancing or fund-level turnover. The published expense ratio is the smallest of these for most index ETFs. For a broad-market index sleeve, dividend distributions plus rebalancing capital gains commonly sit in the 0.5–1.5% range annually as a tax drag at typical brackets — larger than the fee itself.
TLH cannot eliminate that drag, but it can offset it. Each harvested loss reduces current-year taxable gains (and up to $3,000 of ordinary income); excess losses carry forward indefinitely. The deferred liability does not vanish — the new lower cost basis means a larger gain at eventual sale — but the IRS effectively gives you an interest-free loan on the deferred tax, and that loan compounds inside the portfolio at whatever your gross return is.
The 5-year evidence: data the table summarizes
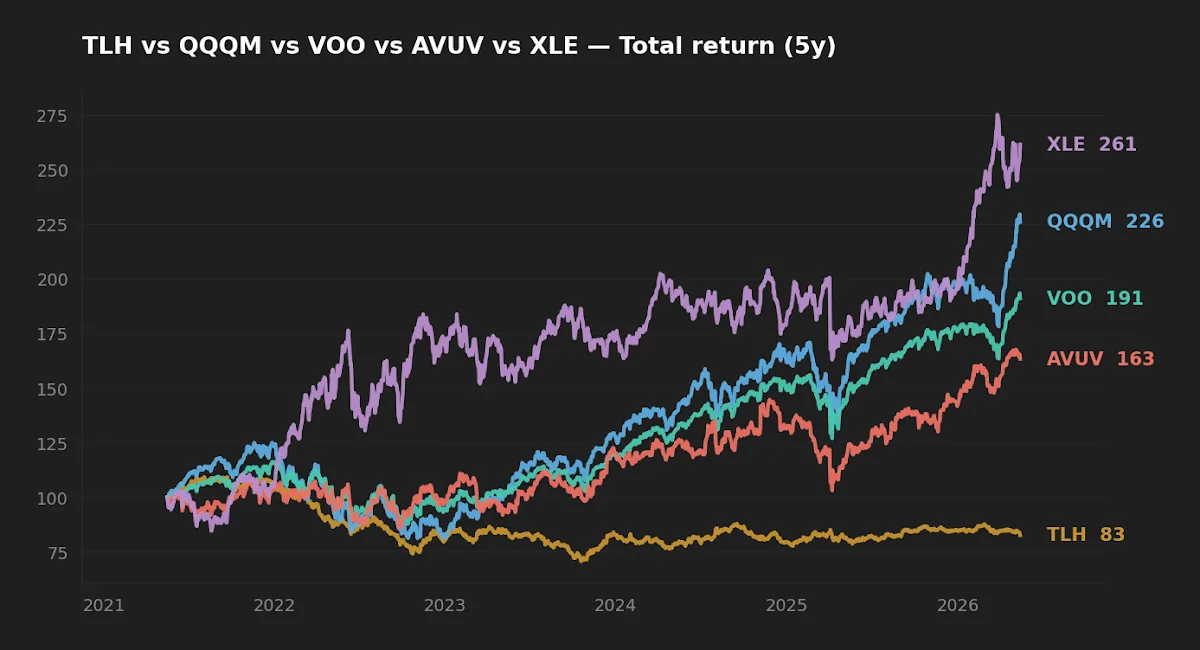
Below: realized statistics for the five tickers most often discussed alongside TLH workflows — long-duration Treasuries, broad large-cap, the NASDAQ-100 sleeve, US small-cap value, and energy. All numbers from yfinance, fetched 2026-05-17. Expense ratios and AUM from issuer fact sheets.
| Ticker | Fund | ER | AUM | Yield | 5Y CAGR | 5Y vol | 5Y max DD |
|---|---|---|---|---|---|---|---|
| TLH | iShares 10–20Y Treasury | 0.15% | $12.1B | 4.4% | -3.9% | 12.7% | -35.4% |
| VOO | Vanguard S&P 500 | 0.03% | $1,600.2B | 1.1% | 13.9% | 16.8% | -24.5% |
| QQQM | Invesco NASDAQ-100 | 0.15% | $82.9B | 0.5% | 17.6% | 22.3% | -35.0% |
| AVUV | Avantis US Small Cap Value | 0.25% | $26.2B | 1.3% | 10.8% | 22.8% | -28.8% |
| XLE | Energy Select Sector SPDR | 0.08% | $41.4B | 2.5% | 22.3% | 26.1% | -26.0% |
Source: yfinance, asof 2026-05-17; issuer fact sheets for ER and AUM. Yields are trailing twelve-month.
The arithmetic: what a 1 pp tax drag actually costs over 30 years
Take two otherwise identical portfolios, each compounding at a 8.0% gross annual return for 30 years. The first leaks 1.5% per year in current taxes (typical for a moderately-traded equity sleeve at higher brackets, with no harvesting). The second leaks 0.5% — the same gross return, with disciplined TLH offsetting roughly two-thirds of the drag.
Portfolio A compounds at 6.5% net: $1 grows to $6.61. Portfolio B compounds at 7.5% net: $1 grows to $8.75. The gap is 32% of starting capital, accumulated entirely from deferring — not avoiding — tax. Note carefully: this is not "alpha" in the Sharpe (1991) sense. It is the time value of a tax bill that has been pushed forward. When the position is eventually sold, the deferred liability is realized at the then-prevailing capital gains rate — which is why TLH's expected lifetime value is highest for investors who plan to hold to step-up at death, donate appreciated shares to charity, or retire into a lower bracket.
Realized risk and the harvest windows the data actually offered
Drawdown is where TLH gets its raw material. The chart below traces five-year drawdowns for the five funds in the table.
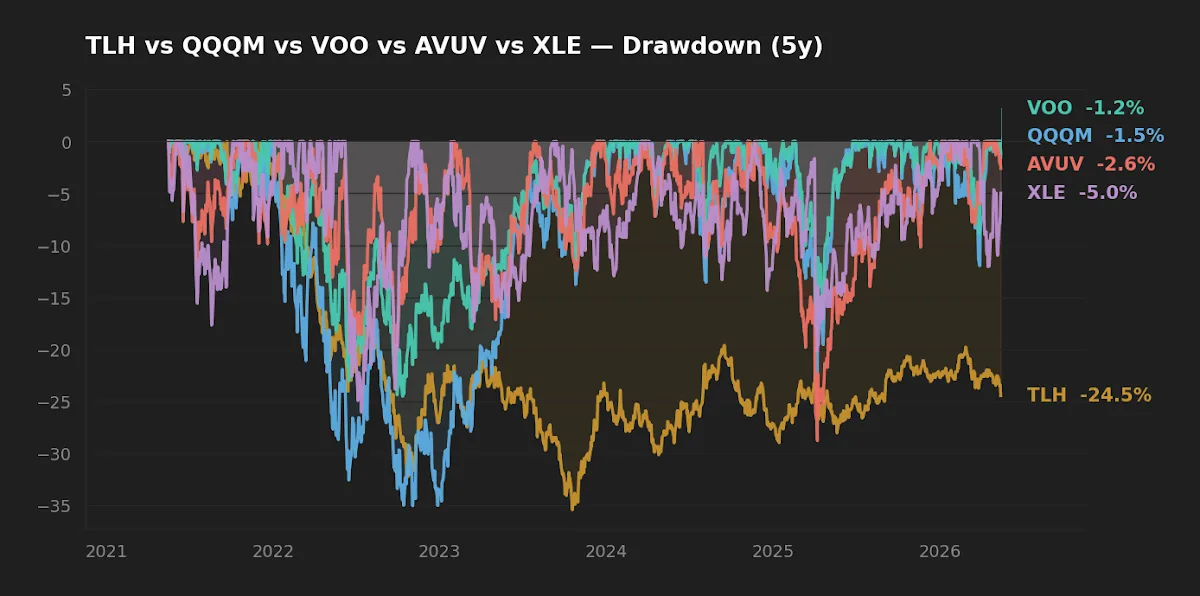
Two observations. First, the deepest five-year drawdown in this set belongs to TLH the ETF — iShares 10–20 Year Treasury Bond — at -35.4%. Long-duration Treasuries lost roughly a third of their price as the policy rate cycled through 4.5%+ and the 10-year settled near 4.47% (FRED, asof 2026-05-14). Investors who bought TLH in the low-yield window of 2020–2021 have spent four-plus years sitting on substantial paper losses — a textbook harvest situation, the friction being identifying an acceptable, non-substantially-identical replacement (TLT and VGLT are close but distinct exposures; the IRS provides no bright-line rule, only the "substantially identical" standard).
Second, every equity sleeve in the table experienced a 24–35% drawdown at some point in the five-year window despite ending the period with positive realized returns. The harvest opportunities were there. The investors who used them are the ones who had a written rule — typically "harvest at 10% paper loss, redeploy within one trading day into a pre-mapped substitute" — and executed without consulting their feelings.
TLH is not a market call. It is the discipline of treating a temporary drawdown as an inventory of unrealized losses to be processed, not a psychological event to be endured.

The wash-sale rule and substitute selection — where most retail TLH fails
IRC §1091 disallows the loss if a "substantially identical" security is purchased within 30 days before or after the sale. The statute leaves "substantially identical" undefined; the operative interpretation in the ETF context is that two funds tracking the same index (e.g., VOO and IVV — both S&P 500) are clearly identical, while two funds tracking different indices of the same broad asset class (VOO ↔ SPLG vs. VOO ↔ ITOT, total US market) sit in a defensible gray zone that most major brokers treat as acceptable.
The practical implication is that the harvest workflow requires a pre-built substitution map. For a typical long-horizon core, the editor's framework records primary and secondary tickers for each sleeve: large-cap (VOO → SPLG → ITOT), Treasuries (TLH → VGIT/VGLT depending on duration target), small-cap value (AVUV → IJS or DFSV), and so on. Without that map, the 30-day clock pressures investors into either repurchasing the original (disallowing the loss) or sitting in cash and accepting tracking error against the index — which, if the rebound is sharp, can erase the entire tax benefit.
Where TLH is overstated, and where it isn't
The honest case against routine harvesting: every realized loss reduces cost basis, so the deferred liability eventually returns when the substitute is sold. If the investor's marginal rate is higher at the eventual realization than at the harvest, TLH actively destroys after-tax value. If the holding ends up in a charitable donation, an inherited step-up, or a low-bracket retirement window, the deferral becomes permanent — and the benefit is real and meaningful.
The honest case for: in a multi-decade taxable accumulation phase, even a 0.3–0.5% per year improvement in after-tax return — well below the 1 pp used in the example above — compounds into 10–20% additional terminal wealth. That is materially larger than the cost compression most investors chase by switching from a 0.07% ETF to a 0.03% ETF, and it is fully under the investor's control.
Scoreboard: where each ticker fits in a TLH workflow
| Role | Best fit | Why |
|---|---|---|
| Deepest current harvest candidate | TLH | -35.4% 5Y max DD; negative 5Y CAGR; many cohorts still underwater |
| Highest harvest cadence over 5Y | QQQM | 22.3% vol, two distinct 30%+ drawdowns provided multiple windows |
| Cleanest substitution map | VOO | Multiple non-identical large-cap substitutes (SPLG, ITOT, SCHX) at <5 bp ER |
| Highest realized 5Y return | XLE | 22.3% 5Y CAGR, but sector concentration limits substitution flexibility |
| Tracking-error-sensitive harvest | AVUV | Active small-cap value; nearest substitutes (IJS, DFSV) carry different factor loadings |
FAQ
Q. Is TLH worth doing if I'm in the 12% or 0% long-term capital gains bracket?
Usually no. At a 0% long-term rate, harvesting a loss to offset a gain at 0% saves nothing, and you've reduced cost basis for the future. The $3,000 ordinary-income offset still applies, but that's a $300–$700 annual benefit, not transformational.
Q. What counts as "substantially identical" for ETFs?
The IRS hasn't published a bright-line rule for ETFs. Industry practice treats two funds tracking the same index as identical (VOO ↔ IVV ↔ SPLG all S&P 500); two funds tracking different indices of the same broad asset class as not identical (VOO ↔ ITOT). Consult a CPA for material positions; the determination is fact-specific.
Q. Can I harvest losses in a Treasury ETF like TLH right now?
If you bought during the 2020–2021 low-yield period, almost certainly yes — TLH's 5Y CAGR is -3.9% and many cost bases remain underwater. Replacement options of similar duration include VGLT and SPTL (different indices, similar exposure). Confirm duration matches your intent.
Q. Does TLH only matter in down markets?
Harvest material exists whenever any position trades below cost basis, even in a broadly rising market. In 2023–2024, US equities rose while small-cap value and long-duration Treasuries spent most of the year underwater — harvest material was abundant for diversified investors.
Q. How does TLH interact with rebalancing?
Favorably. A position trading well below cost basis that has also drifted above its target weight is the ideal candidate: harvest the loss and reduce to target in one transaction. The editor's framework explicitly checks for harvest opportunity at every Daryanani-style ±15/±25 band trigger before any rebalance is executed. See The 0.1% Allocation Question for related framework notes.
What this analysis can and can't tell you
The 30-year compounding gap example assumes a constant gross return and constant tax drag — both unrealistic. Actual TLH benefit varies with realized volatility (which determines harvest frequency), the investor's marginal rate trajectory over the holding period, the size of unrealized gains at eventual liquidation, and the spread between short- and long-term rates. The five-year drawdown data here covers a single regime (post-2020 inflation shock and rate normalization); it does not show how the same funds would behave in a deflationary credit cycle. See The Arithmetic of a -30% Drawdown for how recovery math interacts with allocation.
Scenarios where TLH actually fits
- High-income accumulator (35%+ bracket), 20–30 year horizon, taxable brokerage as primary vehicle. TLH benefit is largest here. A written substitution map and a 10%-paper-loss trigger captures most of the available value with minimal monitoring. See The First $10,000 for related allocation framing.
- Retiree drawing down at 0–15% LTCG bracket. TLH provides limited marginal benefit. The $3,000 ordinary-income offset is the main residual value; sweep losses opportunistically but do not optimize aggressively.
- Investor planning charitable bequests or appreciated-share donation. Harvest aggressively in the accumulation years — the deferred liability disappears entirely at donation or death-step-up. Read Planning the Handoff for the broader transfer framework.
Editor's read
TLH is one of the few sources of after-tax return improvement that doesn't require predicting anything. The editor maintains a pre-mapped substitution table for every position in the long-term core and reviews harvest material at the same monthly cadence as rebalancing — not opportunistically, because opportunistic monitoring rewards exactly the wrong instinct (checking the portfolio in stress). The realistic benefit at typical higher-bracket rates is in the 0.3–0.7% per year range, not the 1.0% used in the illustrative example above. That is still material over decades, but it should not be oversold.
The editor holds broad-market US large-cap and small-cap value exposures in the long-term core and uses a written substitution map for harvesting; no position in TLH (the long-duration Treasury ETF) or XLE at the time of writing.
Methodology
Price and total-return data: yfinance, pulled 2026-05-17, daily close adjusted for distributions. CAGR computed over the trailing five-year window ending 2026-05-16; QQQM and AVUV 10-year CAGR omitted because of post-2019 inception. Volatility is annualized standard deviation of daily log returns. Maximum drawdown is the deepest peak-to-trough close-to-close decline within the five-year window. Expense ratios and AUM from issuer fact sheets linked in the table. Macro reference values from FRED: 10-year Treasury 4.47% asof 2026-05-14; fed funds rate 3.64% asof 2026-04-01; VIX 17.26 asof 2026-05-14; CPI YoY 3.95% asof 2026-04-01.
This article is for educational purposes and does not constitute personalized financial advice. See Disclaimer.