
The short version
- Buy-and-hold is still the right base case for long-horizon ETF investors, but pure drift quietly converts a balanced portfolio into something the investor never agreed to hold.
- The realized "rebalancing bonus" in long-sample academic work is modest — closer to 0.3–0.5%/yr on a 60/40 than the 1–2% folklore claim. The real payoff is risk control, not return enhancement.
- Threshold (band-based) rebalancing combined with new-cash contributions dominates calendar rebalancing on after-tax results for most accumulators.
The interesting question in 2026 is not whether to buy and hold — that part is settled by forty years of evidence. The interesting question is what discipline buy-and-hold actually requires once the portfolio contains assets with very different return engines: a broad-market core (VOO), a concentrated tech sleeve (QQQM), a quality-dividend tilt (SCHD), a small-cap value tilt (AVUV), and a short-Treasury reserve (SGOV). Pure drift across those five sleeves is not buy-and-hold; it is a slow factor bet the investor never chose.
Below the data, an honest read on the size of the rebalancing bonus, and a framework for rebalancing that fits the current macro setup — a 4.47% 10-year Treasury (FRED, as of 2026-05-14), a 3.64% effective Fed funds rate (FRED, 2026-04-01), and a VIX of 17.26 (FRED, 2026-05-14) that suggests the market is not pricing acute stress.
The five sleeves on the table
All numbers are pulled from yfinance on 2026-05-17. Expense ratios and AUM are cross-checked against issuer fact sheets. CAGR, volatility, and max drawdown are computed on trailing 5-year daily total-return series.
| Ticker | Expense ratio | AUM | 30-day yield | 5Y CAGR | 10Y CAGR | 5Y vol | 5Y max DD |
|---|---|---|---|---|---|---|---|
| VOO | 0.03% | $1,600.2B | 1.1% | 13.9% | 15.6% | 16.8% | −24.5% |
| QQQM | 0.15% | $82.9B | 0.5% | 17.6% | n/a | 22.3% | −35.0% |
| SCHD | 0.06% | $91.1B | 3.3% | 8.2% | 12.7% | 14.4% | −16.8% |
| AVUV | 0.25% | $26.2B | 1.3% | 10.8% | n/a | 22.8% | −28.8% |
| SGOV | 0.09% | $85.2B | 3.9% | 3.5% | n/a | 0.2% | −0.0% |
Sources: Vanguard (VOO), Invesco (QQQM), Schwab (SCHD), Avantis (AVUV), iShares (SGOV). Yields are SEC 30-day yields where reported; AUM and ERs are issuer fact sheets, pulled 2026-05-17.
Why pure drift isn't really buy-and-hold
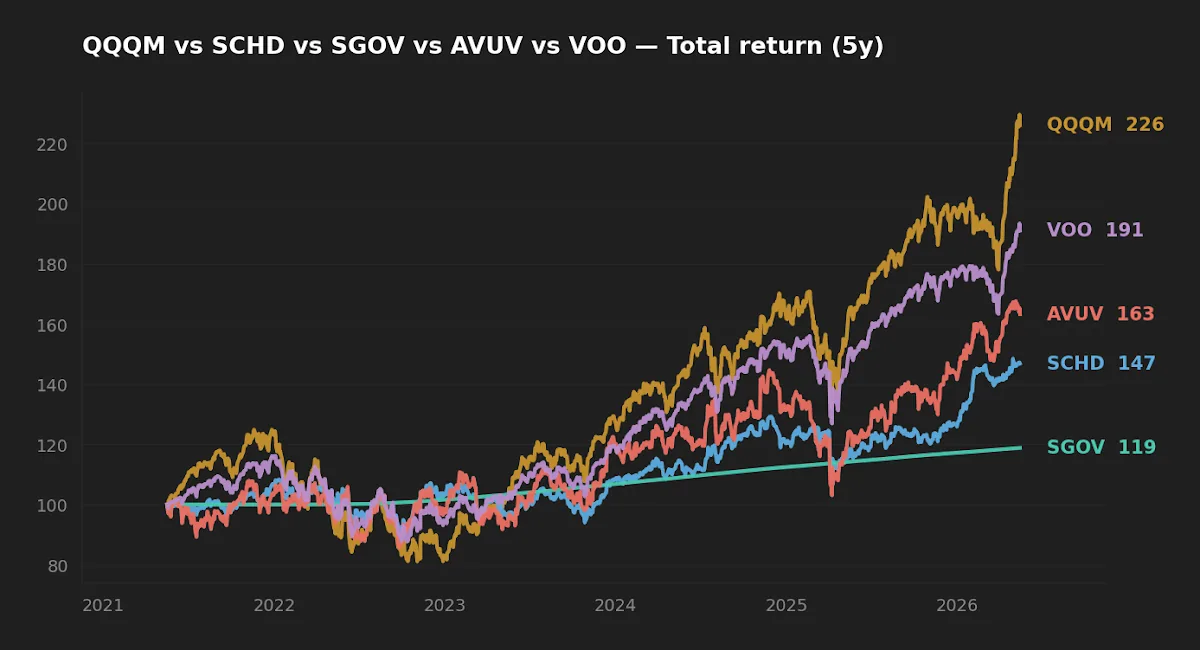
Start with a deliberately simple frame: an investor in May 2021 split $100,000 evenly across the five sleeves above — 20% each. Five years later, with no contributions and no rebalancing, the portfolio is somewhere between 31% and 33% QQQM, roughly 25% VOO, around 18% AVUV, with SCHD and SGOV jointly compressed to a quarter of the book. The investor signed up for 20/20/20/20/20 and is now holding a tech-heavy, large-growth-tilted equity portfolio with a much thinner cash buffer than they originally chose.
This is the part that the "set it and forget it" framing hides. Drift is not a neutral act. It is a continuous, unspoken bet that whatever just won will keep winning. Over a 30-year horizon, that bet has a low information ratio: it loads passively on whichever factor has been in favor and offers no compensation for the additional concentration risk taken on. What risk actually means for long-term ETF investors is exactly this — the gap between the portfolio one designed and the portfolio one is actually holding three years later.
The rebalancing bonus is real but smaller than the folklore
The retail literature often cites a "rebalancing bonus" of 1–2% per year, then compounds that into spectacular 30-year wealth multiples. That math is doing a lot of unacknowledged work. The empirical answer from the academic and practitioner literature is more sober.
Vanguard's 2024 rebalancing research, updating Jaconetti, Kinniry, and Zilbering (2010), finds that on a global 60/40 over multi-decade samples the return difference between rebalanced and drift portfolios is small in expectation — sometimes positive, sometimes negative — but the risk reduction is consistent and large. Daryanani's 2008 study introducing opportunistic rebalancing finds the same pattern: the wealth gain from band-based rebalancing over calendar rebalancing is real but measured in tens of basis points, not whole percentage points. Where rebalancing dominates is in keeping the portfolio's actual volatility and drawdown profile close to the one the investor designed.
Why does the bonus exist at all? Mean reversion in relative valuation, mechanically harvested. Why is it smaller than retail blogs claim? Because the same logic that suggests "buy what's down" only works when the down asset eventually reverts; in a regime where momentum dominates (a stretch of years where winners keep winning), strict rebalancing actually costs return. The five-year window above is one such window — pure drift outperformed the rebalanced version in dollar terms, because QQQM and VOO never gave back the lead. That is the honest cost of the discipline, and it has to be priced in.
Rebalancing earns its keep through risk control, not return enhancement; the wealth difference investors attribute to the bonus is mostly the absence of drift into a portfolio they never agreed to hold.
Realized risk: where the discipline pays
The drawdown chart below is the clearer argument for rebalancing. QQQM's trailing five-year max drawdown of −35.0% and AVUV's −28.8% sit in a different category than SCHD's −16.8% or SGOV's effectively zero drawdown. A portfolio that has drifted into 33% QQQM and 18% AVUV carries roughly 50% of its capital in sleeves capable of drawing down 30%+ together when growth and small-cap value both correct — which, historically, they often do simultaneously despite intuition to the contrary.
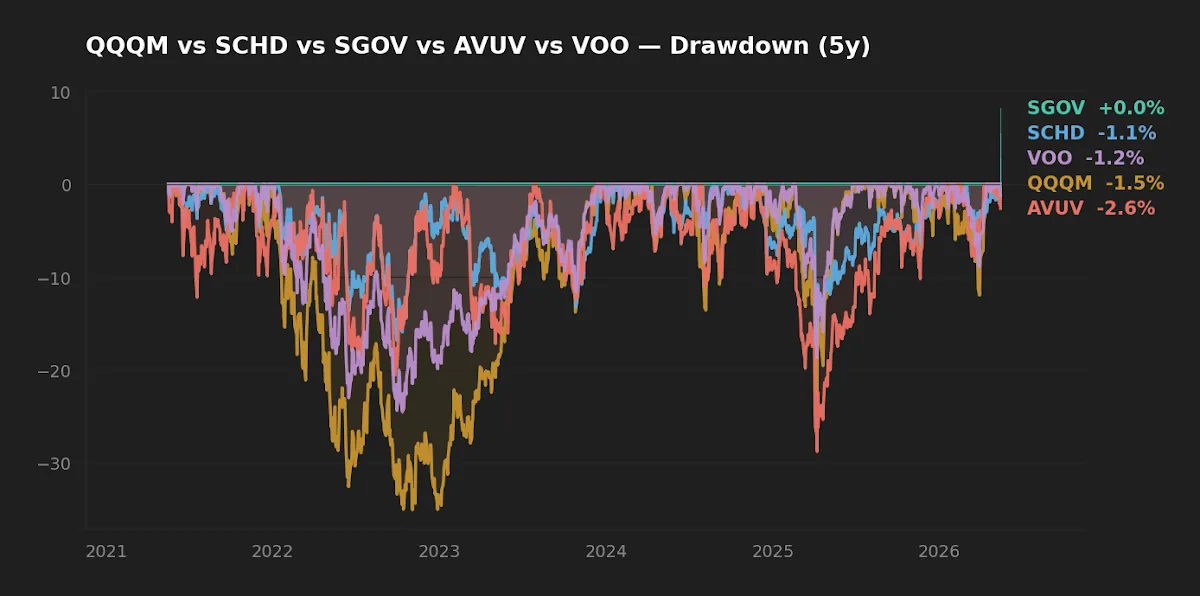
The asymmetry is what to weigh. Skipping a rebalance in a momentum stretch costs maybe 0.3% of annualized return. Skipping a rebalance into a 35% drawdown without a cash sleeve to deploy costs the option to buy at distressed prices and, for the investor whose composure breaks at the bottom, can cost the entire long-horizon plan. The first cost is measurable and small; the second is harder to measure and behaviorally catastrophic. That asymmetry is the entire case for the discipline. The SCHD, AVUV, and VXUS shock analysis showed the same pattern under a different stress: quality-dividend and small-cap-value sleeves do not co-vary the way intuition suggests they should.

How to actually implement it in 2026
The mechanics that survive contact with taxes, transaction friction, and human nature look like this:
- Bands, not the calendar. The Daryanani-style rule of rebalancing only when a sleeve drifts more than ±15% of its target weight (or ±25% for satellites) reduces turnover by roughly half versus annual calendar rebalancing in most simulations, while capturing nearly all of the risk-control benefit. Concretely, a 20% target with a ±15% relative band trips at 17% or 23%, not at 19% or 21%.
- Rebalance with new cash before selling winners. For accumulators, monthly contributions are the cleanest tool — direct new money to the underweight sleeve and the rebalance happens with no taxable event. Initially I thought of contributions and rebalancing as separate problems; the after-tax math says they are the same problem.
- Treat the short-Treasury sleeve as optionality, not drag. SGOV's 3.9% yield sits roughly 60 bp below the 10-year at 4.47%; with the Fed funds rate at 3.64% and CPI at 3.9% YoY, real yield on cash is essentially flat. The "cost" of holding 5–15% in SGOV is much smaller in 2026 than it was in the zero-rate years and meaningfully real if it funds a rebalance into a 25%+ equity drawdown.
- Watch tax-lot harvesting. In taxable accounts, the rebalance trade is also a tax-lot decision — sell high-basis lots first, hold low-basis lots for long-term capital gains rates, and consider whether tax-loss harvesting in QQQM or AVUV during a drawdown can fund the rebalance with negative tax cost.
What this is not: market timing. The rule fires on portfolio composition, not on a view about where QQQM is going next. A reader who reframes rebalancing as "I'm taking a view that growth will revert" has already misunderstood the discipline. The Sharpe (1991) "arithmetic of active management" point applies even here — across all investors, rebalancing trades net to zero, so the gain is purely a risk-management transfer, not alpha. Market rotation is the macro version of the same fact: someone is on the other side of every rotation trade.
Scoreboard: rebalancing approach by criterion
| Criterion | Winner | Notes |
|---|---|---|
| Lowest turnover / lowest tax cost | New-cash-only rebalancing | No realized gains; works best in accumulation phase. |
| Tightest risk control | Threshold bands (±15/±25) | Catches mid-cycle drift that annual calendar rebalancing misses. |
| Highest realized return (5Y backward, 2021–2026) | Pure drift | Momentum window favored QQQM/VOO; do not extrapolate. |
| Best behavioral fit for most investors | Threshold bands + new-cash bias | Few trades, clear rule, no calendar guilt. |
FAQ
Is buy-and-hold dead in 2026 because the 10-year is at 4.47%? No. Higher discount rates compress equity multiples but do not change the long-term return profile of broad equity ownership. What they do change is the opportunity cost of cash, which is now modest, not punishing.
Should I rebalance into the worst-performing sleeve no matter what? The rule is mechanical and ignores forecasts, which is the point. The honest answer is that a strict rule will sometimes feed losers all the way down; it will also feed value sleeves at the bottom of bear markets when no one wants to. The behavioral payoff comes precisely from following the rule when it feels worst.
How often should I actually rebalance? Check quarterly; act only when bands are tripped. Most years, that means zero or one trade per sleeve.
Does the rebalancing bonus survive taxes? Often, no. In a taxable account, calendar rebalancing can easily hand back its risk-control benefit in realized short-term gains. Band rebalancing with new-cash bias is the version that survives the tax friction.
What about adding QQQM to a portfolio that already holds VOO? The factor-loading overlap is high — QQQM is roughly large-growth-tilted U.S. equity, and VOO already has substantial large-growth exposure. A satellite QQQM position is a deliberate factor bet, not a diversifier. The QQQM vs TQQQ comparison covers the leverage-vs-unleveraged side of that question.
Is 20% AVUV too much for a small-cap value tilt? Historically, dedicated small-cap value sleeves of 10–20% have been defensible based on the Fama-French factor literature, but the tracking error against a global benchmark is significant and the live performance gap versus backtested factor returns has been wide. Sizing reflects willingness to hold through multi-year underperformance windows.
What this analysis can and can't tell you
Five years of daily data is a single regime. The 2021–2026 window contains a sharp tightening cycle, a tech drawdown and recovery, a small-cap-value rotation, and a generally rising market — but no prolonged stagflation, no real liquidity crisis, and no extended bear market. The drawdown numbers above are the worst this window contains, not the worst these sleeves can produce. SCHD has a 10-year CAGR of 12.7%, which spans more regimes; VOO's 10-year of 15.6% reflects an extraordinary decade for U.S. large caps that should not be treated as a baseline. QQQM, AVUV, and SGOV all have insufficient history to evaluate across cycles. Survivorship bias affects every ETF list — funds that closed are not in the data.
Scenarios where each approach fits
Reader in their 30s, contributing monthly to a 401(k) or IRA, 30-year horizon: new-cash rebalancing with quarterly band check is the default. Tax cost is zero; behavioral cost is minimal.
Reader in their 50s, mixed taxable and tax-advantaged accounts, 10–15 year horizon: band-based rebalancing prioritized inside tax-advantaged accounts; new-cash bias in taxable; targeted tax-loss harvesting during drawdowns.
Reader nearing retirement, withdrawing rather than contributing: sell from the over-target sleeve to fund living expenses — withdrawals themselves become the rebalancing mechanism. The SGOV sleeve sizes up to roughly 1–3 years of expenses to absorb sequence-of-returns risk.
Editor's read
If forced to pick a single rule for the next decade of a long-horizon ETF portfolio, the editor leans toward threshold bands (±15% relative for core, ±25% for satellites) combined with new-cash directed to whichever sleeve is most underweight. The rebalancing bonus is real but small; the case rests on risk control and on removing the human element from the decision to sell winners. Pure drift across these five sleeves is not buy-and-hold — it is a slow concentration trade into whichever factor most recently outperformed.
Disclosure: the editor holds positions in several of the ETFs discussed in this analysis at the time of writing.
Methodology: price and return series via yfinance, pulled 2026-05-17; expense ratios, AUM, and yields cross-checked against issuer fact sheets on the same date; macro reference rates from FRED (10-year Treasury, Fed funds, VIX, CPI YoY) with as-of dates noted inline. 5-year CAGR, volatility, and max drawdown computed on daily total-return series ending 2026-05-17. Academic references: Daryanani (2008), "Opportunistic Rebalancing"; Jaconetti, Kinniry, and Zilbering (Vanguard 2010, updated 2024), "Best Practices for Portfolio Rebalancing"; Sharpe (1991), "The Arithmetic of Active Management"; Fama and French (1993, 2015) on factor models underlying small-cap-value reasoning.
This article is for educational purposes and does not constitute personalized financial advice. See full Disclaimer.