
The short version
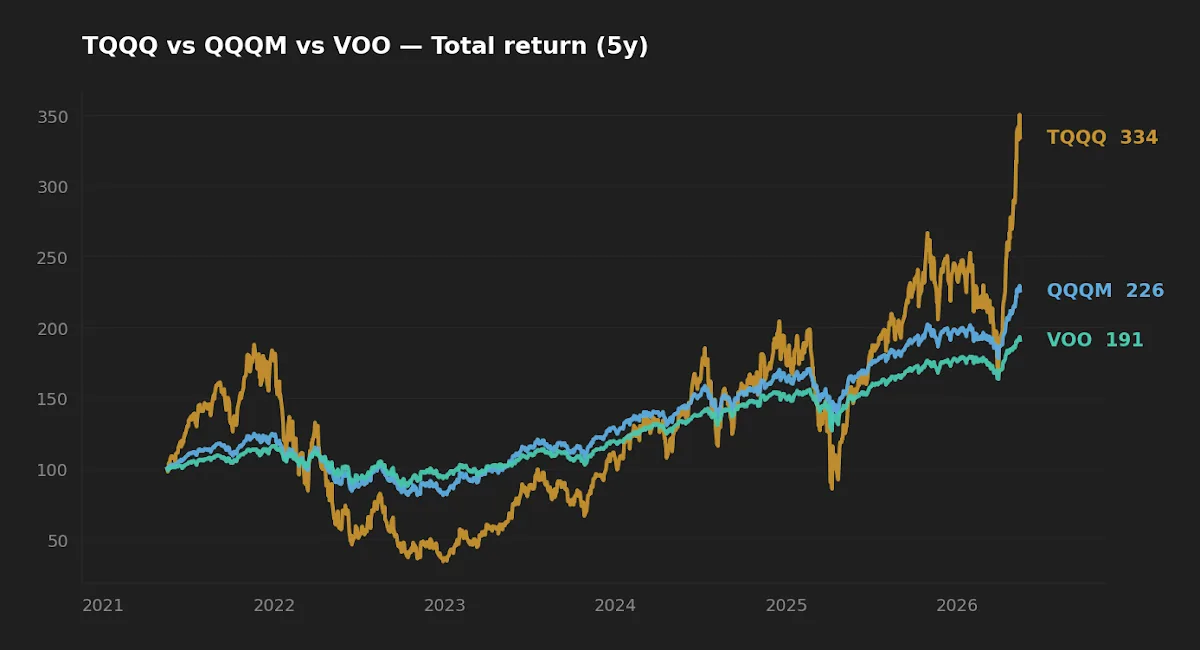
- Over the trailing five years, TQQQ realized only ~1.53× the CAGR of QQQM (27.0% vs 17.6%), not 3×. Daily resets, financing costs, and the 2022 drawdown explain the gap.
- TQQQ's realized 5Y max drawdown of -81.7% is more than 2.3× QQQM's -35.0% and 3.3× VOO's -24.5%. The asymmetry between path and endpoint is what makes leveraged products unsuitable as a long-horizon core.
- If TQQQ has a defensible role, it is as a small, rules-based satellite — sized to survive an 80%+ drawdown without breaking the plan — not as a retirement vehicle.
The marketing frame around TQQQ is straightforward: 3× the Nasdaq-100, daily reset, and a long live history dating to February 2010. The retirement frame is much harder. The same product that compounded at 44.9% annually over the trailing decade also drew down 81.7% during the worst stretch of the last five years. Whether either of those numbers is the relevant one depends on a question most retail content avoids: what is the realized leverage ratio over a horizon that contains both bull and bear regimes, and does that ratio justify the path?
This article works through the live data — expense ratios, AUM, realized CAGR, realized volatility, and drawdown — to answer whether TQQQ has any defensible role alongside QQQM for an investor planning multi-decade compounding.
Context: the products and what they actually deliver
QQQM (Invesco NASDAQ 100 ETF, launched October 2020) is a long-only, fully replicated tracker of the Nasdaq-100 index. It is the lower-fee sibling of QQQ — same index, same holdings, 0.15% expense ratio. TQQQ (ProShares UltraPro QQQ, launched February 2010) targets 300% of the daily return of the same index using total return swaps. The key word is "daily." TQQQ is not a 3× long-term tracker; it resets exposure each session, and the multi-period return is path-dependent in ways the prospectus discloses but most buyers underweight.
For a reference point, the S&P 500 via VOO is included — the most common benchmark a Nasdaq-100 allocation is implicitly chosen against.
Fund-level data
| Ticker | Expense ratio | AUM | Inception | Yield (TTM) | 5Y CAGR | 10Y CAGR | 5Y vol | 5Y max DD |
|---|---|---|---|---|---|---|---|---|
| TQQQ | 0.82% | $31.3B | 2010-02-09 | 0.5% | 27.0% | 44.9% | 66.6% | -81.7% |
| QQQM | 0.15% | $82.9B | 2020-10-13 | 0.5% | 17.6% | n/a | 22.3% | -35.0% |
| VOO | 0.03% | $1,600.2B | 2000-11-13 | 1.1% | 13.9% | 15.6% | 16.8% | -24.5% |
Source: yfinance, pulled 2026-05-17. Expense ratios and AUM cross-checked against issuer fact sheets.
The realized leverage ratio: what the marketing brochure leaves out
The most useful diagnostic is to compare TQQQ's realized CAGR against the underlying it leverages. Over the trailing five years (2021–2026), QQQM compounded at 17.6%, and a hypothetical 3× linear product would have delivered roughly 52.8% — well above the 27.0% TQQQ actually produced. The realized leverage ratio is approximately 1.53×, not 3×. Over a longer ten-year window where the index has run with fewer interruptions, the ratio improves: TQQQ's 44.9% versus a 3× expectation around 52% means realized leverage near 2.6× — closer to the brochure but still short.
The gap is not a flaw, it is mechanics. Three components compound against the holder:
- Volatility decay. Daily reset means a -10% / +10% sequence on the index produces a -1% endpoint, but a -30% / +30% sequence on the leveraged product produces a -9% endpoint. The drag scales with variance, which is why TQQQ's realized 5Y vol of 66.6% (vs QQQM's 22.3%) is more than 3× the underlying — leverage amplifies the second moment more than the first.
- Financing costs. The swap counterparties charge a financing rate roughly tied to short-term funding (currently with the fed funds rate at 3.64% per FRED, asof 2026-04-01). This is an embedded cost the expense ratio does not capture.
- Fee drag. The 0.82% expense ratio is 67 basis points above QQQM and 79 above VOO. On a compounding base of leveraged returns, this is not trivial.
Realized risk: drawdown is the variable that breaks plans
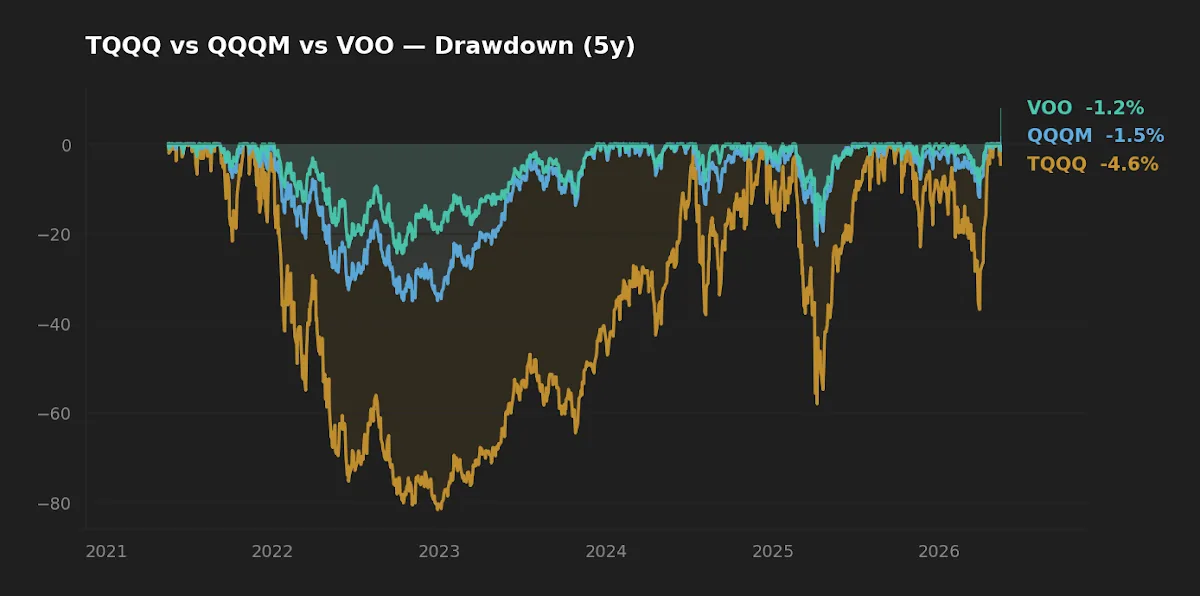
The 2022 bear market is the only multi-quarter stress test in TQQQ's recent live record, and it is informative. The trailing five-year max drawdown of -81.7% means an investor who entered at the November 2021 peak with $100,000 saw the position fall below $19,000 at the trough. QQQM drew down 35.0% over the same window; VOO drew down 24.5%. The ratio of drawdowns (~3.3× vs VOO, ~2.3× vs QQQM) is closer to the brochure's "3×" than the CAGR ratio is — leverage delivers the downside more faithfully than the upside, which is the central asymmetry of these products.
Recovery arithmetic compounds the asymmetry. A 50% drawdown requires 100% to break even; an 80% drawdown requires 400%. QQQM's worst recent drawdown needed a 54% rally; TQQQ's needed a 446% rally. The index delivered enough of one to bring TQQQ back — but only because the post-2022 regime happened to be a sharp recovery in mega-cap tech. A flat or grinding recovery would have left a TQQQ holder structurally impaired.
The realized 5Y leverage ratio of 1.53× — against a brochure 3× — is the single number that determines whether a TQQQ allocation makes sense as anything other than a small, sized-to-survive satellite.
Cost mechanics over decades
QQQM at 0.15% and TQQQ at 0.82% is a 67 bp gap, and the gap matters in two ways. On a per-year basis, 67 bp is a meaningful but not catastrophic drag. On a compounding basis over 30 years, $100,000 growing at an identical pre-fee 10% return produces $1.74M after the 0.15% fee and $1.42M after the 0.82% fee — a $320K spread on a single decision. For a long-horizon investor, the fee is not the headline risk of TQQQ, but it is not nothing, and it stacks on top of the structural drag described above.
VOO's 0.03% fee sits in a different category entirely. The Vanguard product is the cheapest broad-market vehicle the editor is aware of, and its 5Y CAGR of 13.9% over a window that included a 24.5% drawdown is the reference point against which any tilt — to Nasdaq-100 or to leverage — has to justify itself. For a deeper look at the unleveraged Nasdaq-vs-S&P comparison, see VOO vs QQQM: Which ETF Is Better for Long-Term Investing in 2026?.
What the live decade actually shows about decay
A point worth being precise about: TQQQ has not "decayed to zero" the way early commentary on leveraged products predicted. Its 10Y CAGR of 44.9% is enormous in absolute terms, and an investor who held through 2010–2026 in a Roth-style tax-deferred account compounded faster than virtually any other passive product available. This is the honest counterpoint to the volatility-drag argument: when the underlying trends strongly upward with manageable drawdowns, daily-reset leverage delivers most of what the brochure promises.
The complication is that "trends strongly upward" is a regime, not a constant. The Nasdaq-100's 2010–2026 stretch is the strongest 16-year run in its history, dominated by mega-cap secular winners and a falling discount rate. Backtests over the dot-com crash and the 2008 cycle, where TQQQ did not yet exist, suggest realized 3× products would have suffered terminal losses near 99%. Live data from one favorable regime is not a stress-tested basis for retirement allocation. The longer treatment of this regime dependency is in TQQQ Analysis: Is a 3x Nasdaq-100 Strategy Viable for a 30-Year Horizon? and in The Complete Guide to Leveraged ETF Investing.
Scoreboard
| Category | Winner | Margin |
|---|---|---|
| Cost | QQQM (vs TQQQ) | 67 bp gap, compounds materially over 30 years |
| Realized risk | QQQM | 5Y max DD -35.0% vs -81.7%; 5Y vol 22.3% vs 66.6% |
| Realized return (recent regime) | TQQQ | 5Y CAGR 27.0% vs 17.6%; 10Y 44.9% vs n/a |
| Long-horizon core suitability | QQQM | Survives any plausible drawdown; TQQQ may not |
FAQ
Q. Does TQQQ "decay" over time even in a flat market?
Yes, structurally. Daily reset of a constant-leverage product produces negative path drift proportional to variance. In a flat-but-volatile market, both QQQM and the underlying index can be roughly unchanged while TQQQ loses meaningful value. In a steadily trending market, the path drift is overwhelmed by the trend and the product behaves closer to its 3× target.
Q. If TQQQ's 10Y CAGR was 44.9%, isn't it obviously the better holding?
Only if the next 10 years rhyme with the last 10. The 2010–2026 window was the strongest single regime in Nasdaq-100 history. Allocating retirement assets to a product whose backtested performance over the 2000–2009 regime would have produced terminal losses is a different bet than the live track record alone suggests.
Q. Is QQQM materially different from QQQ?
Same index, same holdings, lower fee (0.15% vs 0.20%). QQQ retains the larger AUM and tighter spreads for active traders; QQQM is the structurally cheaper buy-and-hold vehicle. For a long-horizon investor with no trading frequency requirement, QQQM is the cleaner choice.
Q. How does the current macro regime affect this decision?
Per FRED (asof 2026-04-01 to 2026-05-14), the 10Y Treasury yields 4.47%, the fed funds rate is 3.64%, CPI is running at 3.9% YoY, and the VIX sits at 17.26. The financing cost embedded in TQQQ's swaps is approximately tied to short-term rates, which means TQQQ's structural drag is roughly 100–150 bp higher today than in the zero-rate years of 2010–2021. This is rarely discussed in retail content.
Q. Could a small TQQQ satellite make sense alongside a QQQM or VOO core?
Possibly. The defensible version is a small allocation (single-digit percent of the portfolio) sized so that a -85% drawdown is survivable without altering the long-term plan, rebalanced systematically into the unleveraged core when the satellite outperforms. This is closer to a volatility-harvesting strategy than a buy-and-hold one and requires discipline most investors underestimate.
What this comparison can and can't tell you
The 5Y window covers one full bear-and-recovery cycle (2022 drawdown, 2023–2025 recovery). It does not cover a multi-year flat regime, a 1970s-style inflation regime, or a 2000–2002–style sustained drawdown. TQQQ's live history (since 2010) is dominated by quantitative easing, falling discount rates, and mega-cap tech outperformance — a single regime, not a sample. QQQM's history is even shorter (since October 2020), so its standalone track record cannot be evaluated against pre-2020 stress. The yfinance prices used here are total-return adjusted but small residual differences against issuer reported NAVs are possible.
Scenarios where each fund fits
- Long-horizon investor (20–30+ years), broad-market core: VOO as the foundation. The 0.03% fee and the broader sector diversification make it the lowest-friction long-horizon vehicle in the comparison.
- Long-horizon investor wanting a Nasdaq-100 tilt: QQQM. Same index as QQQ at a lower fee, structurally suitable as a portfolio sleeve. The factor exposure is concentrated tech/growth — treat as a tilt, not a complete equity holding.
- Investor with a small speculative satellite sleeve (<5–10%) and stomach for path-dependent losses: TQQQ may have a role, sized to survive an 80%+ drawdown without behavioral failure, ideally in a tax-deferred account where rebalancing is friction-free.
- Retiree or pre-retiree in drawdown phase: Neither QQQM alone nor TQQQ as a meaningful allocation. Sequence-of-returns risk in the first 5–10 years of withdrawals is the dominant variable, and concentrated growth exposure amplifies it.
Editor's read
If the question is which of these two builds a long-term core, the answer is QQQM, and it is not close. The 5Y realized leverage ratio of 1.53× against a brochure 3× tells you what you need to know about how TQQQ delivers its risk. The 10Y CAGR is impressive but it is the product of a single regime. A small, rules-based TQQQ satellite — sized so that an 80% drawdown does not derail the plan — is the only configuration the editor finds defensible, and even then only for investors who have already built the unleveraged core and understand that the satellite may go to a quarter of its value before recovering.
Editor's holdings disclosure: The editor holds positions in broad-market and Nasdaq-100 unleveraged ETFs as part of a long-horizon core. The editor does not hold TQQQ.
Key takeaways
- TQQQ's realized 5Y leverage ratio of 1.53× — far below the brochure's 3× — is the central fact for any long-horizon allocation decision.
- QQQM's 0.15% expense ratio versus TQQQ's 0.82% compounds into a six-figure spread on a $100K base over 30 years before any volatility-decay or financing costs are considered.
- The asymmetry between upside leverage (~1.5–2.6× realized) and downside leverage (~3× realized) is what makes TQQQ structurally unsuitable as a long-horizon core.
- The live decade (2010–2026) is one favorable regime; backtests through earlier stress periods suggest TQQQ would have produced terminal losses near 99%.
- If TQQQ has a place, it is as a small, sized-to-survive satellite alongside an unleveraged core — never as the core itself.
Methodology
Price and return data: yfinance, pulled 2026-05-17, 5-year window ending 2026-05-16. Expense ratios and AUM verified against ProShares, Invesco, and Vanguard issuer fact sheets. CAGR computed from daily total-return-adjusted closes. Drawdown measured peak-to-trough on the 5Y series. Volatility annualized from daily log returns (sqrt(252) scaling). Macro context: FRED, asof dates 2026-04-01 (fed funds, CPI) and 2026-05-14 (10Y Treasury, VIX). The 3× expected ratio is a heuristic — actual swap-based products are subject to additional financing and counterparty costs.
This article is for educational purposes and does not constitute personalized financial advice. See Disclaimer.