
The short version
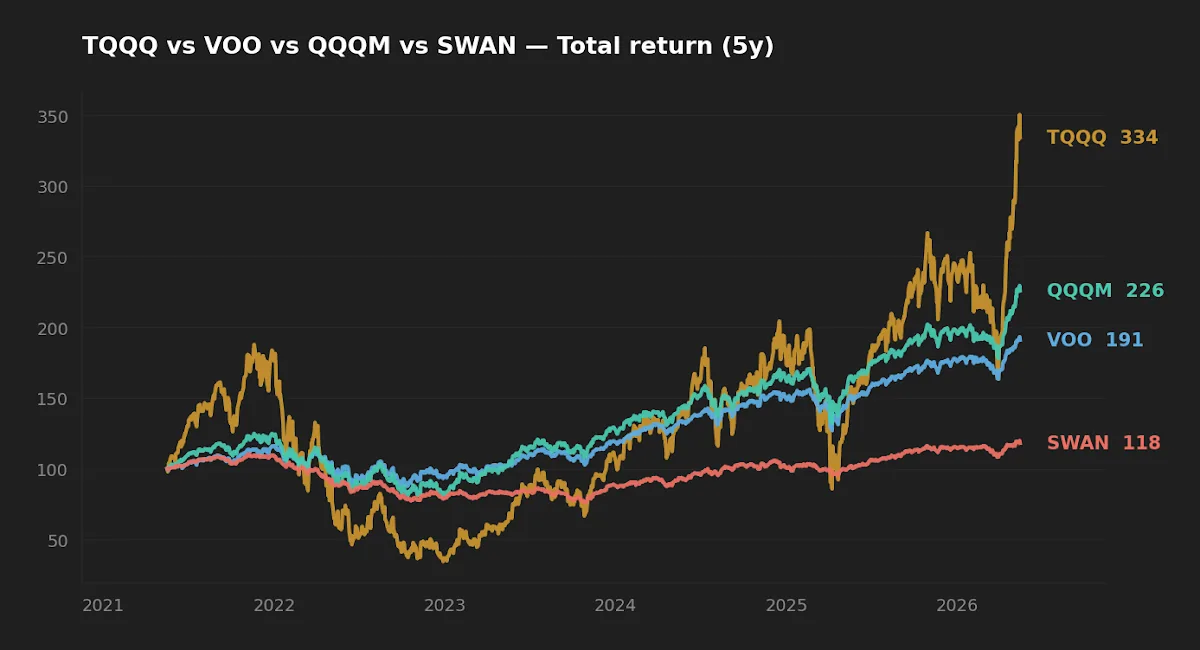
- Over the trailing five years, TQQQ delivered ~27.0% annualized but with 66.6% realized volatility and an 81.7% peak-to-trough drawdown — a hole that requires a 446% gain to climb out of.
- QQQM added roughly 3.7 percentage points of CAGR over VOO for 5.4 extra points of volatility and 10.5 extra points of drawdown — a more honest "growth tilt" than 3x leverage.
- For a long-horizon core sleeve, 3x daily-reset leverage is not a buy-and-hold vehicle. The realized 27% CAGR is almost exactly what variance-drag math predicts once borrow costs and the 0.82% fee are accounted for — there is no free lunch hiding in the leverage factor.
The most common framing for VOO, QQQM, and TQQQ treats them as three points on a single risk-return line: "more risk, more return." The five-year data tells a more interesting story. The Nasdaq-100 tilt earns its premium fairly. The leveraged variant earns almost exactly what financial theory predicts after variance drag and borrowing costs — not the naive 3× of the underlying.
That distinction matters because the marketing of leveraged ETFs implicitly promises 3× the long-term upside. The realized data over a 5-year window covering both the 2022 bear and the 2023–2026 AI-driven recovery says the actual long-horizon multiplier is closer to 1.5×, paid for with a drawdown depth that few buy-and-hold investors will sit through.
Context: what these three funds actually are
VOO is Vanguard's S&P 500 ETF — 500 large-cap US companies, market-cap weighted, 0.03% expense ratio, inception 2010 with the index history going back to the 1950s. QQQM is Invesco's lower-fee twin to QQQ tracking the Nasdaq-100: roughly 100 of the largest non-financial Nasdaq listings, tilted heavily to information technology and communication services. TQQQ is ProShares' 3× daily-reset levered exposure to the same Nasdaq-100 index — it uses total return swaps to deliver three times the index's daily move, then resets each session.
The "daily reset" mechanic is the part most retail comparisons gloss over. Over multi-day periods, a 3× daily-reset fund does not return 3× the underlying — it returns roughly 3× the underlying minus a variance-drag term and minus financing cost on the leveraged sleeve. The math of that drag is what governs the long-horizon outcome.
The data: realized 5- and 10-year numbers
| Ticker | Expense ratio | AUM | 5Y CAGR | 10Y CAGR | 5Y volatility | 5Y max drawdown | Yield |
|---|---|---|---|---|---|---|---|
| VOO | 0.03% | $1,600B | 13.9% | 15.6% | 16.8% | −24.5% | 1.1% |
| QQQM | 0.15% | $82.9B | 17.6% | n/a (inception 2020) | 22.3% | −35.0% | 0.5% |
| TQQQ | 0.82% | $31.3B | 27.0% | 44.9% | 66.6% | −81.7% | 0.5% |
Source: yfinance price/return series pulled 2026-05-17; expense ratios and AUM from issuer fact sheets — Vanguard VOO, Invesco QQQM, and ProShares TQQQ. Volatility and drawdown computed from daily total-return series over the trailing 5 years.
The variance-drag math that explains TQQQ's return
Daily-reset leveraged funds have a known long-horizon return approximation: roughly L·μ − L(L−1)·σ²/2 − (L−1)·r − fee, where L is the leverage factor, μ is the underlying return, σ is its volatility, and r is the short-term borrow rate. The middle term is variance drag — it grows with the square of underlying volatility and is unavoidable for any daily-reset product.
Plugging in the realized inputs for the trailing five years: μ = 17.6% (QQQM), σ = 22.3%, r ≈ 4.5% (using current 10Y Treasury 4.47% and fed funds 3.64% as bookends, per FRED as of 2026-04 to 2026-05), fee = 0.82%, L = 3:
- 3 × 17.6% = 52.8% (raw 3× return)
- − 3 × 2 × (0.223²) / 2 = −14.9% variance drag
- − 2 × ~4.5% ≈ −9.0% financing on the levered notional
- − 0.82% expense ratio
- Expected ≈ 28.1%
The realized 5-year CAGR was 27.0%. The approximation is within 1.1 percentage points. That precision is the analytically interesting part — TQQQ did not "outperform" or "underperform" in any meaningful sense over this window. It returned almost exactly what the underlying volatility regime and borrow curve predicted. That also means the upside is not 3× over multi-year horizons. The realized multiplier on QQQM's CAGR was 27.0 / 17.6 = 1.53×.
TQQQ did not outperform what the math predicted. It returned 27.0% versus a theoretical 28.1% — and the 81.7% drawdown was not bad luck either, it was 3× the underlying's 35% drawdown with daily compounding accumulating the path.
Realized risk: drawdown is where the framing breaks
An 81.7% drawdown is mechanically what 3× daily exposure produces when the underlying falls roughly 35% with intraday and overnight volatility along the way. The 2022 calendar year did exactly that, with the Nasdaq-100 down ~33% peak-to-trough and intraday ranges that compounded against the daily-reset.
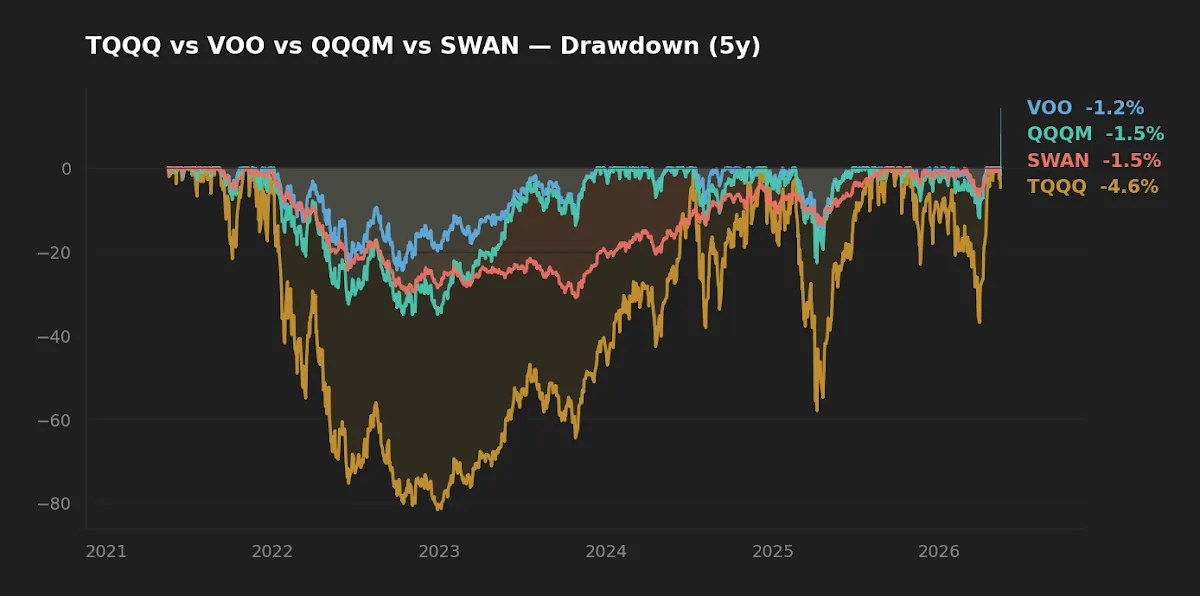
The behavioral question is not "could I tolerate a paper loss of 82%?" but "would I rebalance into it?" Daryanani's 2008 work on opportunistic rebalancing and Vanguard's 2024 update both show that rebalancing bands only add value if the investor actually executes the trades during stress. A position sized large enough to matter to net worth and down 82% is precisely the position retail investors capitulate on — the realized return for a TQQQ holder who entered in late 2021 and sold near the 2022 trough was substantially worse than the −81.7% peak-to-trough figure.
By contrast, VOO's −24.5% max drawdown and QQQM's −35.0% max drawdown sit inside the historical envelope of normal index pullbacks. Those are drawdowns disciplined investors have demonstrably ridden through across multiple regimes.
What this comparison can and can't tell you
The 5-year window covers one bear (2022) and one strong recovery (2023–2026), heavily shaped by AI-related concentration in the Nasdaq-100. It does not contain a prolonged sideways regime like 2000–2013 for the Nasdaq, nor a sustained period of rising real rates combined with falling equity multiples. TQQQ's 10-year CAGR of 44.9% should be read with that caveat: it spans almost entirely from low-rate, dispersion-suppressed conditions through to today. The fund's behavior in a 2000-style multi-year decline is not in the sample.
Sample size is also a constraint. Annual returns are noisy; five datapoints cannot distinguish skill from regime. The math of variance drag, however, is regime-independent — it is a property of the product structure, not the period.
Scenarios where each fits
- Investor in their 30s with a 401(k) plus taxable, building a long-term core: VOO as the base; QQQM as a deliberate growth tilt sized to a tolerable factor exposure (often 20–40% of the equity sleeve). TQQQ does not have a home in this sleeve.
- Investor with a satellite trading book separate from the core: TQQQ can function as a short-to-medium-horizon tactical position, sized small (≤5% of total) and managed with explicit exit rules. Daily-reset products require active risk management — not buy-and-hold.
- Investor approaching withdrawal phase: The leverage discussion is essentially moot. Drawdown depth dominates sequence-of-return risk, and an 82% drawdown inside a five-year window is incompatible with sustainable withdrawals.
Scoreboard: who wins what
| Category | Winner | Reason |
|---|---|---|
| Cost | VOO | 0.03% vs 0.15% vs 0.82% |
| Realized return (5Y) | TQQQ (raw) | 27.0% vs 17.6% vs 13.9%, but pre-behavior |
| Realized return per unit of vol | VOO | 13.9 / 16.8 = 0.83 vs QQQM 0.79 vs TQQQ 0.41 |
| Realized risk | VOO | −24.5% vs −35.0% vs −81.7% max drawdown |
| Long-horizon core suitability | VOO + QQQM blend | TQQQ is structurally a tactical product |
FAQ
Q: Doesn't TQQQ's 44.9% 10-year CAGR prove leveraged ETFs work long-term?
A: It proves they worked in a specific regime — low rates, suppressed volatility through 2017 and 2019, and a fast V-shaped recovery from 2022. The 10-year window does not include a 2000-style multi-year decline. Sample-of-one regimes are not a basis for long-horizon allocation.
Q: How does the macro backdrop in 2026 affect TQQQ's expected return?
A: The 10-year Treasury at 4.47% and fed funds at 3.64% (FRED, as of 2026-05) imply meaningfully higher financing costs than during the 2010s. Every percentage point of borrow drags TQQQ's expected return down by ~2 points, since two notional units are financed. Higher rates make the leverage trade structurally less attractive.
Q: What about a small TQQQ allocation as "alpha" inside a core portfolio?
A: Mechanically you can size TQQQ to limit downside contribution. A 5% allocation hitting −81.7% costs ~4% of total portfolio value. Whether that volatility contribution is worth the upside depends on whether you would actually rebalance into it during stress — most investors don't. The TQQQ vs QQQM comparison covers the sizing math in more detail.
Q: Is QQQM redundant if I already hold VOO?
A: Partially. The top names overlap heavily, but QQQM excludes financials and tilts more aggressively to communication services and consumer-facing tech. It functions as a growth-factor tilt rather than a diversifier. The trade-off is examined in VOO vs QQQM.
Q: What about pairing TQQQ with a tail-hedge like SWAN?
A: SWAN (Amplify BlackSwan Growth & Treasury) holds long-duration Treasuries plus equity call options. Its 5-year CAGR was 3.4% with −31.0% drawdown — meaning it did not protect well during the 2022 rates-driven decline when both Treasuries and equity options weakened simultaneously. Tail hedges that depend on a specific correlation regime are fragile.
Editor's read
If forced to pick one fund as a long-term core, the editor leans toward VOO: lowest fee, deepest liquidity, lowest realized drawdown, and the highest return-per-unit-of-volatility in the sample. QQQM is a reasonable growth tilt added on top, sized to the investor's tolerance for sector concentration. TQQQ does not belong in a buy-and-hold core. The product is mathematically honest about what it is — daily-reset 3× exposure — but the way it is commonly marketed for "long-term wealth" misrepresents how daily compounding interacts with volatility. The 27% realized 5-year CAGR is exactly what the variance-drag formula predicts. It is not outperformance; it is the price of the structure paid in the only regime that flattered it.
The editor holds VOO and QQQM in the long-term core sleeve and does not hold TQQQ or SWAN at the time of writing.
Key takeaways
- TQQQ's 5-year 27.0% CAGR is well-explained by 3·μ − variance drag − financing − fees. Within 1.1 pts of theory. Not magic; not alpha.
- QQQM is the more analytically defensible growth tilt: ~3.7 pts of CAGR over VOO for 5.4 pts more volatility and 10.5 pts more drawdown — a roughly linear trade.
- An 81.7% drawdown requires a 446% gain to recover. Few buy-and-hold investors hold through that without selling.
- Macro matters for leveraged products: 4.47% 10Y and 3.64% fed funds in 2026 make the financing leg of TQQQ's return materially more expensive than in the 2010s.
- The realized data does not extend the trailing 5-year window over a 2000-style multi-year Nasdaq decline. Long-horizon decisions should account for that absence.
Methodology
Price and total-return series sourced from yfinance, pulled 2026-05-17. Expense ratios, AUM, and inception dates from issuer fact sheets (Vanguard, Invesco, ProShares) on the same date. Macroeconomic context (10-year Treasury, federal funds rate, VIX, CPI YoY) from FRED, asof 2026-04 to 2026-05-14. CAGR computed over rolling daily total-return windows ending 2026-05-17; volatility annualized from daily log returns using √252; max drawdown computed from peak-to-trough on the cumulative total-return series over the same 5-year window. The variance-drag approximation follows the standard leveraged-ETF return decomposition; see Avellaneda & Zhang (2010) for the derivation.
This article is for educational purposes and does not constitute personalized financial advice. See full Disclaimer.