
The short version
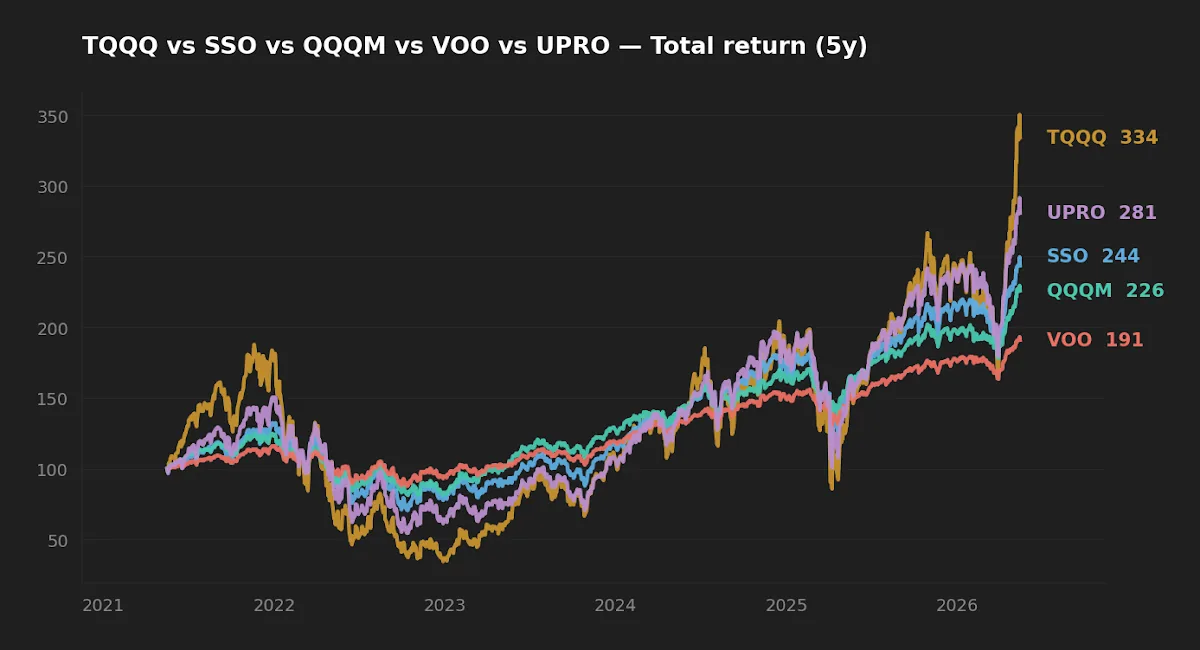
- Over the trailing five years, TQQQ delivered roughly 1.5x the realized CAGR of QQQM — not 3x — while taking on roughly 3x the drawdown and 3x the volatility.
- Daily-reset leverage is path-dependent: the realized leverage ratio is time-varying and tends to fall below the stated ratio in choppier regimes.
- If a leveraged sleeve has a defensible role at all, the data argues it is small, tracks a broad index, and is governed by hard allocation bands — not held as a long-horizon core position.
Leveraged ETFs invite either a casino narrative or a get-rich narrative, and neither survives contact with the realized data. The harder question — the one worth a long-term investor's time — is what a daily-reset 2x or 3x product actually compounds to across a real-world decade, net of decay, net of financing cost, and net of the drawdowns the holder must sit through to capture it.
This article reads the trailing-five-year numbers for TQQQ, SSO, and UPRO against their unleveraged counterparts (QQQM, VOO) and asks a single question: at what allocation, in what regime, with what discipline, is leverage a defensible addition to a long-horizon portfolio — and where do the numbers say it is not?
Context: what daily-reset leverage actually promises
A product like ProShares UltraPro QQQ (TQQQ) targets 300% of the daily return of the Nasdaq-100. The contract is daily, not annual. Mechanically the fund rebalances its swap exposure at the close so that the next session opens at the target leverage ratio. That single design choice — daily reset — has two consequences the marketing materials underplay. First, the path of returns matters, not just the endpoints: a flat round-trip in the underlying does not produce a flat round-trip in the leveraged fund. Second, the financing embedded in the swap is tied to short-term rates, so the cost of running the strategy moves with the policy rate.
For context on the unleveraged base case, the comparison between the two most-cited broad-market vehicles is covered in VOO vs QQQM. The reader unfamiliar with where leverage sits inside a fuller allocation framework may prefer to start with How to Start ETF Investing.
The data
| Ticker | Name | ER | AUM | Yield | 5Y CAGR | 10Y CAGR | 5Y Vol | 5Y Max DD |
|---|---|---|---|---|---|---|---|---|
| VOO | Vanguard S&P 500 | 0.03% | $1,600.2B | 1.1% | 13.9% | 15.6% | 16.8% | -24.5% |
| QQQM | Invesco NASDAQ 100 | 0.15% | $82.9B | 0.5% | 17.6% | n/a | 22.3% | -35.0% |
| SSO | ProShares Ultra S&P 500 (2x) | 0.87% | $7.3B | 0.7% | 19.6% | 24.2% | 33.7% | -46.7% |
| UPRO | ProShares UltraPro S&P 500 (3x) | 0.89% | $4.7B | 0.8% | 23.1% | 30.1% | 50.4% | -63.9% |
| TQQQ | ProShares UltraPro QQQ (3x) | 0.82% | $31.3B | 0.5% | 27.0% | 44.9% | 66.6% | -81.7% |
Sources: yfinance (price/return series, fetched 2026-05-17); issuer fact sheets for ER, AUM, inception: ProShares TQQQ, ProShares SSO, ProShares UPRO, Invesco QQQM, Vanguard VOO.
The realized leverage ratio is not the label on the box
The first thing the table makes plain is the gap between stated leverage and realized leverage. Compute the simple ratio of leveraged CAGR to its underlying base:
- TQQQ (3x stated) / QQQM over 5Y: 27.0% / 17.6% = 1.53x
- UPRO (3x stated) / VOO over 5Y: 23.1% / 13.9% = 1.66x
- SSO (2x stated) / VOO over 5Y: 19.6% / 13.9% = 1.41x
A 3x daily-reset product compounded at roughly 1.5x the base over five years. A 2x product compounded at roughly 1.4x. The shortfall is not a marketing failure — it is the mechanical consequence of daily rebalancing in a regime that included both a sharp 2022 drawdown and a strong post-trough recovery. Over the trailing ten years, where the trend persistence was higher, the realized ratios improve (TQQQ 44.9% / a roughly 18% Nasdaq-100 base ≈ 2.5x; UPRO 30.1% / VOO 15.6% ≈ 1.9x). Realized leverage is regime-dependent, and the regime is not a parameter the holder chooses.
This is the asymmetry that matters: in calmer, trend-persistent windows the product gives most (not all) of the stated multiple; in choppy windows, the volatility drag and financing cost compound against the holder. The investor cannot select the window in advance.
The drawdown asymmetry no five-year chart erases
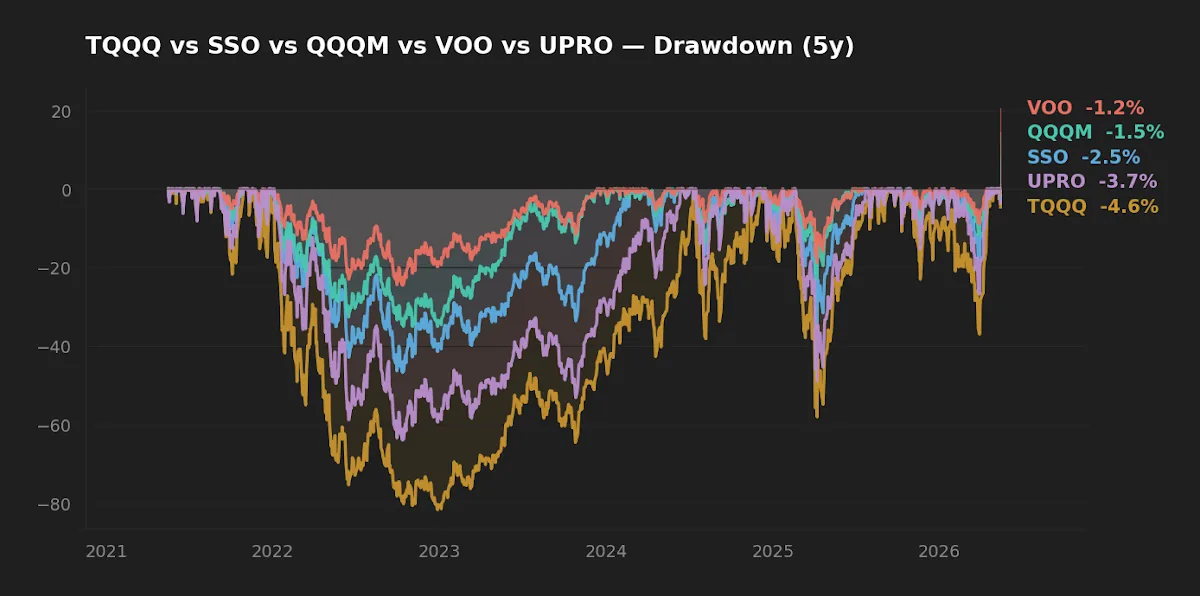
Realized return is the metric retail discourse fixates on. Realized drawdown is the metric that determines whether a holder ever captures the return. Over the same trailing five years, TQQQ's worst peak-to-trough mark was -81.7%. A holder who entered at the prior peak with a 100% allocation would have watched eighty-three cents of every dollar evaporate before recovering. UPRO's was -63.9%. SSO's was -46.7%. VOO's was -24.5%.
The numbers also expose a second-order effect that is easy to miss. TQQQ's -81.7% is not the linear 3x of QQQM's -35.0% (which would be -105% and is structurally impossible). It is the path-integrated outcome of three-times-daily exposure compounded through the full drawdown, and it sits closer to the mathematical floor than the linear scaling implies. The further a leveraged product travels into a drawdown, the more aggressively daily rebalancing damages the principal needed to participate in the eventual recovery. Drawdown depth and recovery duration are not independent variables — they interact.
The five-year return number flatters TQQQ. The five-year drawdown number is the one a holder actually lives through, and it determines whether the return is captured at all.
Financing cost in a 4.5% Treasury world
Daily-reset leveraged ETFs achieve their exposure through total-return swaps. The financing leg of those swaps is benchmarked to short-term rates plus a counterparty spread. With the 10-Year Treasury at 4.47% and the federal funds rate at 3.64% (FRED, asof 2026-05-14 and 2026-04-01 respectively), the implicit cost of running a 3x exposure is materially higher than it was in the 2010–2021 zero-rate era when most of the popular long-term backtests for these products were calibrated.
That cost shows up twice. It is already baked into realized CAGR — the 27.0% TQQQ delivered over five years is net of swap financing — but it also widens the gap between stated and realized leverage going forward in any environment where short rates stay elevated. The honest read: any forward projection that assumes 3x of a 10% index return becomes 30% leveraged return is ignoring 4–5% of annual financing drag plus a daily rebalancing cost that varies with volatility. The arithmetic is closer to "3x return minus financing minus drag" — and the last two terms are not small.
Where a small leveraged sleeve might fit — and where it almost certainly doesn't
The five-year Sharpe-style ratio (CAGR divided by volatility, as a rough proxy) is instructive:
- VOO: 13.9 / 16.8 = 0.83
- QQQM: 17.6 / 22.3 = 0.79
- SSO: 19.6 / 33.7 = 0.58
- UPRO: 23.1 / 50.4 = 0.46
- TQQQ: 27.0 / 66.6 = 0.41
On a risk-adjusted basis, the unleveraged broad-market ETFs dominate. Leverage buys nominal return at a worse-than-linear risk price. That alone is a reason most long-horizon allocations should hold zero leveraged exposure. For frameworks that treat leverage as a small satellite with hard allocation caps and rebalancing bands, the comparison covered in QLD vs SSO outlines why 2x is a more defensible choice than 3x in elevated-rate regimes: less financing drag, less daily-reset damage, narrower drawdowns to behave through.
For readers building the long-horizon core itself, the more productive starting point is composition — covered in The Rationale Behind a Five-ETF Long-Term Core — rather than leverage layered on top.
Scoreboard
| Category | Winner | Why |
|---|---|---|
| Cost | VOO | 0.03% ER vs 0.82–0.89% on leveraged peers; 79–86 bp gap |
| Realized risk | VOO | -24.5% max DD, 16.8% volatility |
| Realized return (5Y) | TQQQ | 27.0% CAGR, but 1.5x base — not 3x |
| Risk-adjusted return | VOO | 0.83 CAGR/vol ratio; leverage degrades the ratio monotonically |
| Long-horizon core suitability | VOO / QQQM | Daily-reset leverage is not designed for buy-and-hold |
FAQ
Is TQQQ a 3x version of QQQM over the long term?
No. TQQQ targets 3x the daily return of the Nasdaq-100. Over multi-year periods, the realized ratio is path-dependent. Over the trailing five years, TQQQ delivered roughly 1.5x QQQM's CAGR; over the trailing ten years it was closer to 2.5x. The realized multiple is a function of trend persistence, not a guarantee.
Does volatility decay actually destroy capital, or is it a myth?
It is not a myth, but it is also not the whole story. Daily rebalancing imposes a real, measurable drag in choppy markets. In strong directional trends, the same mechanism amplifies gains. The five-year drawdown profile of TQQQ versus QQQM is the clearest illustration: the leveraged fund's drawdown is mechanically deeper than 3x linear scaling would suggest.
Are 2x products like SSO safer than 3x for long-term holding?
"Safer" needs definition. SSO's five-year max drawdown was -46.7% versus UPRO's -63.9%. Its volatility was 33.7% versus 50.4%. The financing-cost drag is also lower. The risk is meaningfully smaller but still well outside what most long-horizon frameworks tolerate in a core position.
Why does the financing cost matter more in 2026?
The swap financing in leveraged ETFs is benchmarked to short rates. With the federal funds rate at 3.64% (FRED, 2026-04-01), the cost of carrying 3x exposure is several percentage points per year — embedded in the price, but real. In a zero-rate environment, that drag was negligible. It is not negligible now.
Could a small allocation to a leveraged ETF improve a long-term portfolio?
Possibly, in narrow circumstances, with hard discipline: a small satellite (single-digit percent), broad-market underlying (not sector or thematic), explicit rebalancing bands, and a holder willing to behave through a 60–80% drawdown without selling. Whether the expected uplift justifies the behavioral and tail-risk cost is a judgment the data alone cannot make.
What this comparison can and can't tell you
The trailing five years cover a single regime: a sharp 2022 drawdown followed by a strong recovery and a sustained AI-led mega-cap rally. They do not cover a prolonged sideways market, a multi-year recession, or a sustained high-real-rate environment. The five-year window also benefits leveraged products that survived 2022 — survivorship is built into any current snapshot. The ten-year window adds context but still does not include a decade-scale bear market in mega-cap technology. Forward outcomes will be drawn from a different distribution than the one the data describes.
Scenarios where each fund fits — and doesn't
- Reader in 30s building a long-horizon core, no leveraged exposure currently: VOO or QQQM as the broad-market base. A leveraged sleeve is optional and, if added at all, capped in the low single digits.
- Reader in 50s within a decade of drawdown tolerance ending: The drawdown profile of 2x and 3x products is misaligned with the time horizon. The data does not support leverage in this profile.
- Reader with existing leveraged position acquired in a strong run: The relevant question is the position size relative to total wealth and whether a rebalancing band is in place. Trimming to a defined cap on strength is the mechanical decision; debating direction is not.
Editor's read
The realized data does not support 2x or 3x daily-reset products as long-horizon core holdings. The 79–86 basis-point fee gap, the regime-dependent realized leverage ratio that often runs well below the label, and the drawdown profile that exceeds linear scaling combine to make the risk-adjusted picture worse than the unleveraged base. Where a satellite role exists at all, the editor's reading of the literature and the five-year numbers favors 2x over 3x and a single-digit allocation cap over anything that looks like a "tilt." The default position remains unleveraged broad-market exposure as the core, with leverage treated as a deliberate, bounded exception rather than a structural component.
The editor does not hold TQQQ, SSO, or UPRO at the time of writing. The editor holds VOO and QQQM as part of a broad-market core allocation.
Methodology
Price and total-return series sourced from yfinance, fetched 2026-05-17. CAGR computed over rolling 5-year and 10-year windows ending on the fetch date. Volatility is annualized standard deviation of daily log returns over the 5-year window. Maximum drawdown is the worst peak-to-trough decline in the 5-year window. Expense ratio, AUM, dividend yield, and inception date sourced from issuer fact sheets (ProShares for TQQQ/SSO/UPRO; Invesco for QQQM; Vanguard for VOO). Macro context (10-Year Treasury, federal funds rate) from FRED, asof 2026-05-14 and 2026-04-01.
This article is for educational purposes and does not constitute personalized financial advice. See full Disclaimer.