
The short version
- "Infrastructure" is two different factor exposures wearing one label: XLU is regulated-utility income, PAVE is industrial build-out cyclicality. Treating them as one line item is a category error.
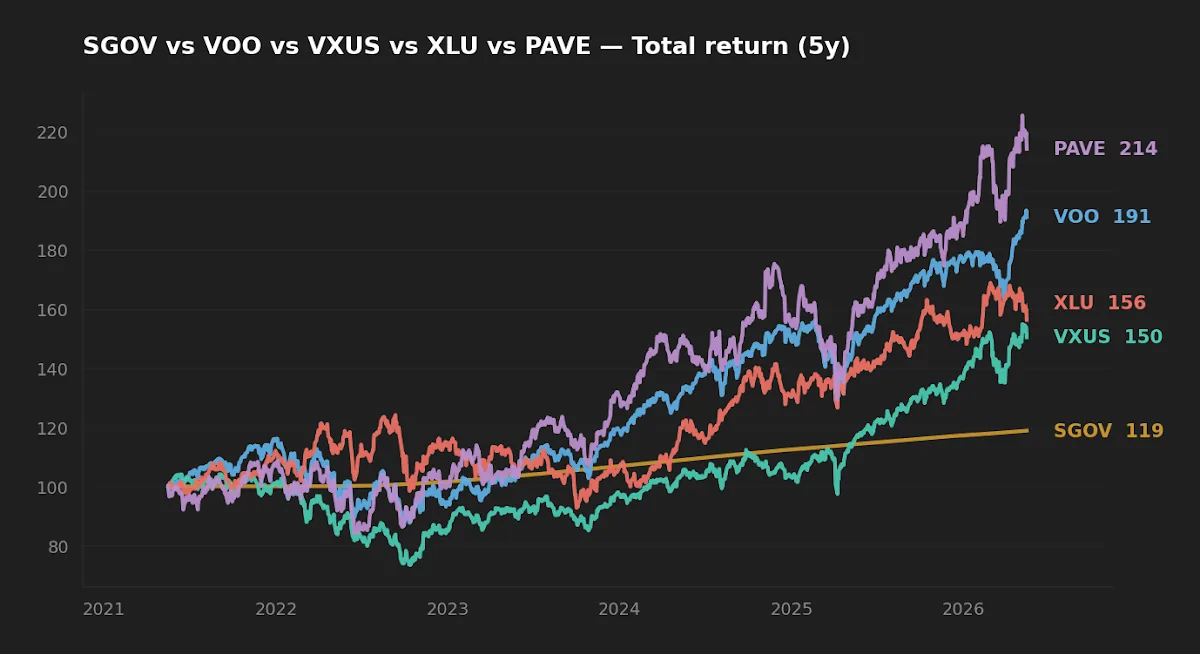
- Over the trailing five years, PAVE compounded at 16.4% with 21.6% annualized volatility; XLU at 9.2% with 17.3%. The 0.44 percentage-point fee gap matters less than the factor difference.
- For most long-horizon portfolios built around VOO and VXUS, infrastructure is already represented inside the core. A dedicated sleeve earns its place only if it changes the factor exposure deliberately, not redundantly.
The case for treating infrastructure as a multi-decade allocation rests on a clean narrative — durable physical assets, regulated cash flows, inflation-linked pricing power, decades of demand visibility. The five-year data tells a more uneven story, and the two most-discussed expressions of "infrastructure" in retail portfolios behave nothing like each other. Before sizing a long-horizon infrastructure sleeve, it is worth asking what the numbers actually show and what the label hides.
Why this question is harder than it looks
Two ETFs typically anchor a U.S.-listed infrastructure discussion: the Utilities Select Sector SPDR (XLU), tracking regulated electric, gas, and water utilities; and the Global X U.S. Infrastructure Development ETF (PAVE), tilted toward industrials, materials, and engineering names that supply the build-out. They appear under the same heading in most asset-class diagrams. They are not the same instrument. XLU is a yield-and-rate-sensitive sleeve historically traded as a quasi-bond. PAVE is a cyclical industrial bet on capital expenditure cycles. Conflating them produces portfolios that either over-hedge or over-cycle without anyone realizing.
The macro backdrop matters too. With the 10-Year Treasury at 4.47% (FRED, asof 2026-05-14) and CPI year-over-year at 3.9% (FRED, asof 2026-04-01), the discount rate on long-duration cash flows has reset higher than the regime under which most utilities accumulated their bond-proxy reputation. That regime change is doing real work in the realized numbers below.
The data, as of mid-2026
| Ticker | Role | ER | AUM | Yield | 5Y CAGR | 10Y CAGR | 5Y Vol | 5Y Max DD |
|---|---|---|---|---|---|---|---|---|
| XLU | Utilities sector | 0.08% | $24.1B | 2.54% | 9.2% | 9.4% | 17.3% | -25.3% |
| PAVE | Infrastructure build-out | 0.47% | $13.4B | 0.77% | 16.4% | n/a | 21.6% | -26.2% |
| VOO | U.S. equity baseline | 0.03% | $1,600.2B | 1.08% | 13.9% | 15.6% | 16.8% | -24.5% |
| VXUS | Ex-U.S. equity | 0.05% | $629.1B | 2.76% | 8.5% | 9.7% | 16.0% | -29.4% |
| SGOV | T-bill defensive | 0.09% | $85.2B | 3.94% | 3.5% | n/a | 0.2% | -0.03% |
Source: yfinance (price/return), issuer fact sheets for ER and AUM — SPDR/XLU, Global X/PAVE, Vanguard/VOO, Vanguard/VXUS, iShares/SGOV. Pulled 2026-05-17. Windows: trailing 5Y and 10Y where available.
What "infrastructure" actually contains
The single most useful step in this analysis is refusing to use the word "infrastructure" without a qualifier. XLU holds roughly 30 names, dominated by NextEra, Southern, Duke, and the Constellation/Vistra cohort that has been re-rated on data-center power demand. The exposure is regulated, geographically defensive, and rate-sensitive — historically a low-beta sleeve whose total return came roughly half from dividends. PAVE holds about 100 names skewed toward industrials and materials: Eaton, Quanta Services, Vulcan, Martin Marietta, Caterpillar, Parker Hannifin. The exposure is procyclical, capex-driven, and beta-positive.
The factor decomposition shows up cleanly in the realized numbers. PAVE's 5-year volatility of 21.6% is meaningfully above VOO's 16.8% and well above XLU's 17.3% — consistent with industrial cyclicality, not utility stability. PAVE's 0.77% trailing yield versus XLU's 2.54% reflects the same divide: PAVE companies retain earnings for capex and acquisitions, XLU companies distribute. These funds do not "do the same thing." They do almost opposite things and happen to share a press-release vocabulary.

Realized risk: drawdowns and the bond-proxy myth
The drawdown chart below normalizes peak-to-trough behavior across the same window. PAVE's 5-year max drawdown of -26.2% is broadly comparable to XLU's -25.3% and slightly worse than VOO's -24.5%. The implication is uncomfortable for the "utilities are defensive" intuition: across the 2022 rate shock and subsequent rallies, XLU did not deliver materially better downside protection than the broad market. A regulated-utility ETF behaving like a slightly-less-volatile S&P 500 is not the same thing as a portfolio shock absorber.
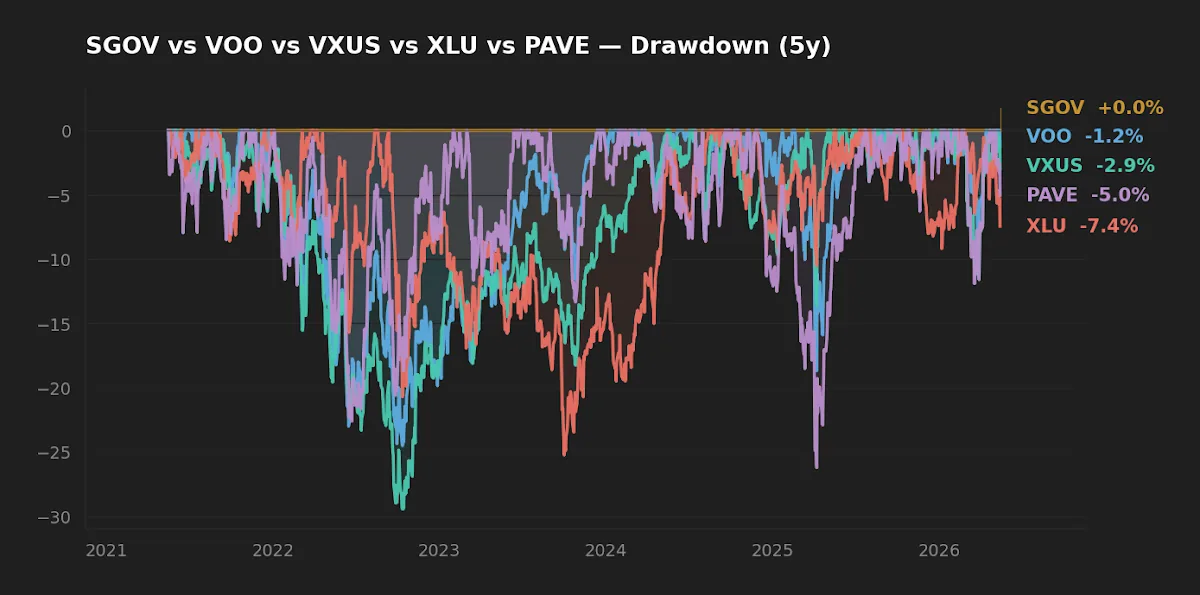
The mechanism is straightforward. Utilities carry significant duration via long-dated rate-regulated assets and persistent dividend payout ratios. When the 10-Year repriced from sub-2% to north of 4%, XLU absorbed the discount-rate hit even though earnings held up. The same dynamic eroded the "yield premium" the sector historically commanded — XLU's 2.54% trailing yield is now 193 basis points below the risk-free 10-Year. Initially I assumed the income gap was a temporary feature of the rate cycle; the rolling-yield comparison since 2022 shows it has held for long enough that the bond-proxy framing is doing the analysis a disservice.
A utility ETF yielding 2.54% while the 10-Year Treasury yields 4.47% is no longer a bond proxy. It is an equity bet on regulated-growth narratives, and it should be sized accordingly.
Where infrastructure fits inside a VOO + VXUS core
The argument most often skipped is that a market-cap core already owns infrastructure. VOO's sector weights include utilities (around 2.5%) and industrials (around 8%); VXUS adds another layer of regulated utilities and global industrials. A holder of VOO + VXUS at conventional weights already has single-digit-percentage exposure to the names that dominate XLU and PAVE — diluted across other sectors, yes, but present. The relevant question is not "should I own infrastructure?" but "do I want a deliberate overweight versus the cap-weighted core, and at what cost?"
If the answer is yes, the implementation question splits along the factor line. An overweight toward utilities is a defensive-leaning, yield-tilted bet that the AI-driven power-demand narrative will protect regulated cash flows for decades — a thesis explored in prior coverage of the AI infrastructure supercycle and the underlying grid modernization story. An overweight toward PAVE is a procyclical bet on sustained capex through multiple Federal funding cycles. Both can be coherent. They are not interchangeable, and they do not mix into a single "infrastructure %" line.
Scoreboard — winner by category
| Category | XLU | PAVE | Winner |
|---|---|---|---|
| Cost (ER) | 0.08% | 0.47% | XLU |
| Realized 5Y return | 9.2% | 16.4% | PAVE |
| Realized 5Y volatility | 17.3% | 21.6% | XLU |
| Income yield | 2.54% | 0.77% | XLU |
| Scale / liquidity | $24.1B | $13.4B | XLU |
| Long-horizon core sleeve | Stable, low cost | Cyclical, costly | XLU |
| Thematic satellite (capex cycle) | Indirect | Direct | PAVE |
FAQ
Is infrastructure really a 30-year asset class, or a momentum theme?
The underlying assets — grids, water systems, transport, electrical equipment — have 30-to-50-year useful lives. The ETFs that wrap them are not the same thing as the assets. XLU has a 27-year live history; PAVE has 9. The "30-year" framing is honest for the assets, less honest for the funds, and worth separating in any sizing decision.
XLU or PAVE for the long-horizon sleeve?
They answer different questions. If the question is "where do I get a slightly defensive, yield-oriented overweight," XLU. If the question is "how do I express a long capex cycle thesis," PAVE. For a single small sleeve inside a VOO/VXUS core, XLU is the simpler addition; PAVE behaves enough like the cyclical industrials already in VOO that the diversification benefit is smaller than the label suggests.
How does PAVE's 0.47% expense ratio affect long-term outcomes?
At a 30-year horizon, a 0.39 percentage-point fee differential against XLU's 0.08% compounds to roughly 12% of terminal value — meaningful, though small relative to the realized return gap of the trailing five years. The fee question only matters if the return advantage is structural rather than regime-driven; current evidence is insufficient either way.
Is XLU still a "bond proxy"?
On current numbers, no. With XLU yielding 2.54% versus the 10-Year at 4.47%, the income case requires believing the yield gap will close through utility dividend growth — a long-duration thesis, not a substitution for fixed income. The 2024 Vanguard work on rebalancing and the broader academic literature on dividend-equity duration both caution against treating equity sleeves as duration replacements.
Should infrastructure replace or supplement total-market exposure?
Supplement, if anything. Replacing VOO or VXUS with concentrated sector funds tightens factor exposure, raises tracking-error risk versus a sensible benchmark, and reduces capacity for the kind of disciplined rebalancing described in prior coverage of factor investing. A small overweight (3-8% of equity) is the typical literature range; larger sleeves require a much more specific thesis.
What this comparison can and can't tell you
The five-year window covers a single macro regime — the 2020 reflation, the 2022 rate shock, and the AI-driven capex narrative. It does not contain a sustained disinflationary regime, a credit cycle, or a regulatory shock to utilities (e.g., wildfire-liability reform). PAVE has no 10-year live track record; its through-cycle behavior is inferred, not observed. Survivorship bias inside both ETFs (constituents have changed) and the unusually narrow drawdown in the sample period both bias the return estimate upward relative to a longer base rate. None of the 5-year numbers should be extrapolated linearly.
Scenarios where each fund fits
Reader in their 30s, equity-heavy core via VOO and VXUS: the cap-weighted core already provides ~10% industrial and utility exposure. A 3-5% PAVE satellite captures the capex thesis without crowding out the core. A separate XLU overweight is largely redundant.
Reader within ten years of drawdown phase, seeking yield diversification: XLU's 2.54% yield does not solve the income problem at current rates. A blended SGOV + dividend-equity sleeve generally dominates a pure XLU overweight on yield-per-unit-of-risk grounds.
Reader running a thematic AI infrastructure thesis: PAVE expresses the build-out side directly; XLU expresses the power-demand side. Holding both at modest weights is internally consistent. Holding either at concentrated weight is a single-regime bet.
Editor's read
If the goal is a single small sleeve added to a VOO + VXUS core, the editor leans toward XLU: the 8 bp expense ratio, $24B AUM, and 27-year operating history meet the bar for a long-horizon allocation. PAVE is interesting and analytically clean as a procyclical satellite, but the 47 bp fee, 9-year history, and 21.6% realized volatility argue against treating it as a long-horizon core position. The honest framing for both is "thematic overlay, sized to the conviction," not "legacy asset."
The editor holds neither XLU nor PAVE directly at the time of writing; the U.S. equity sleeve held inside the long-term core provides indirect exposure to both segments.
Methodology. Returns, volatility, and drawdowns computed from yfinance daily total-return series; trailing 5-year window ending 2026-05-17, 10-year window where available. Expense ratios, AUM, and yields from issuer fact sheets (linked above). Macro context from FRED: 10-Year Treasury 4.47% (2026-05-14), Fed Funds 3.64% (2026-04-01), VIX 17.26 (2026-05-14), CPI YoY 3.95% (2026-04-01). Volatility annualized from daily log returns. Drawdowns measured peak-to-trough on cumulative total return.
This article is for educational purposes and does not constitute personalized financial advice. See full Disclaimer.