
Photo by Egor Komarov on Unsplash
The short version
- The "AI infrastructure" thesis is two trades dressed as one — a load-growth story (data center electricity demand) and a duration trade (long-dated cash flows priced against a 10Y Treasury at 4.47%). They are independent variables.
- Utility-sector positions bought before 2023 as a "low-vol defensive sleeve" are quietly drifting toward regulated-growth behavior. The factor profile has changed without most holders repricing it.
- An investor holding a broad U.S. index already owns much of this trade through utilities, industrials, REITs, and the hyperscaler capex pipeline inside tech. A 3–5% thematic tilt is defensible; a wholesale reallocation usually duplicates beta the core already provides.
The interesting question about "AI infrastructure" in 2026 isn't whether data centers will need more electricity. That part is settled. The interesting question is what kind of factor exposure an investor actually takes on when they buy a utility ETF, an industrial-infrastructure fund, or a data-center REIT under this banner — and how those exposures behave when discount rates move against them. The popular framing, that AI is migrating from chips to physical infrastructure, is a useful macro narrative but a thin investment thesis on its own.
Most retail framings collapse two independent variables into one trade. This piece tries to separate them and to ask the question that follows: how much of this exposure does a diversified investor already hold without realizing it?
What's actually growing, and what's just a label
U.S. utility load growth ran at roughly 0.5% per year for over a decade. Most planning models assumed flat-to-1% indefinitely. That's the regime the existing utility sector was built around, and it produced the sector's traditional factor profile: low beta, high yield, defensive correlation behavior in equity drawdowns.
The IEA's Electricity 2024 report estimated that global data-center, AI, and crypto electricity consumption could roughly double from 2022 to 2026, reaching on the order of 1,000 TWh — comparable to Japan's total annual electricity use. EPRI's 2024 white paper on data-center load projected U.S. data-center electricity use rising from roughly 4% of national generation today to between 4.6% and 9.1% by 2030, depending on the scenario. Grid-operator forecasts from PJM Interconnection and ERCOT, filed with state and federal regulators, have been revised materially upward against their 2023 baselines.
The direction is settled. The slope, the geographic distribution, and which part of the value chain captures the economics are not. Three sub-buckets get grouped together under the "AI infrastructure" label, and they are not the same trade.
| Sub-bucket | Typical vehicle | Primary driver | Rate sensitivity | Already in cap-weight? |
|---|---|---|---|---|
| Regulated utilities & IPPs | Utility sector ETFs | Rate-base growth, capacity contracts | High | Yes — ~2.5% of S&P 500 |
| Industrial infrastructure (grid equipment, electrical) | Broad infrastructure ETFs | Capex cycle, equipment orders | Moderate | Yes — embedded in industrials at ~8% |
| Data-center REITs | Sector REIT funds, specialty names | Lease economics, hyperscaler concentration | Very high | Partial (in real-estate ~2.5%) |
| Clean-energy thematic | Renewable-energy ETFs | Policy regime, project IRRs | Very high | Partial |
For reference on what "already owned by default" looks like in dollar terms, here is the broad-market benchmark most U.S. investors use as their core holding. The point of the row is the AUM scale and what it implies about embedded sector exposure.
| Ticker | ER | AUM | Inception | Yield | 5Y CAGR | 10Y CAGR | 5Y vol | Max DD (5Y) |
|---|---|---|---|---|---|---|---|---|
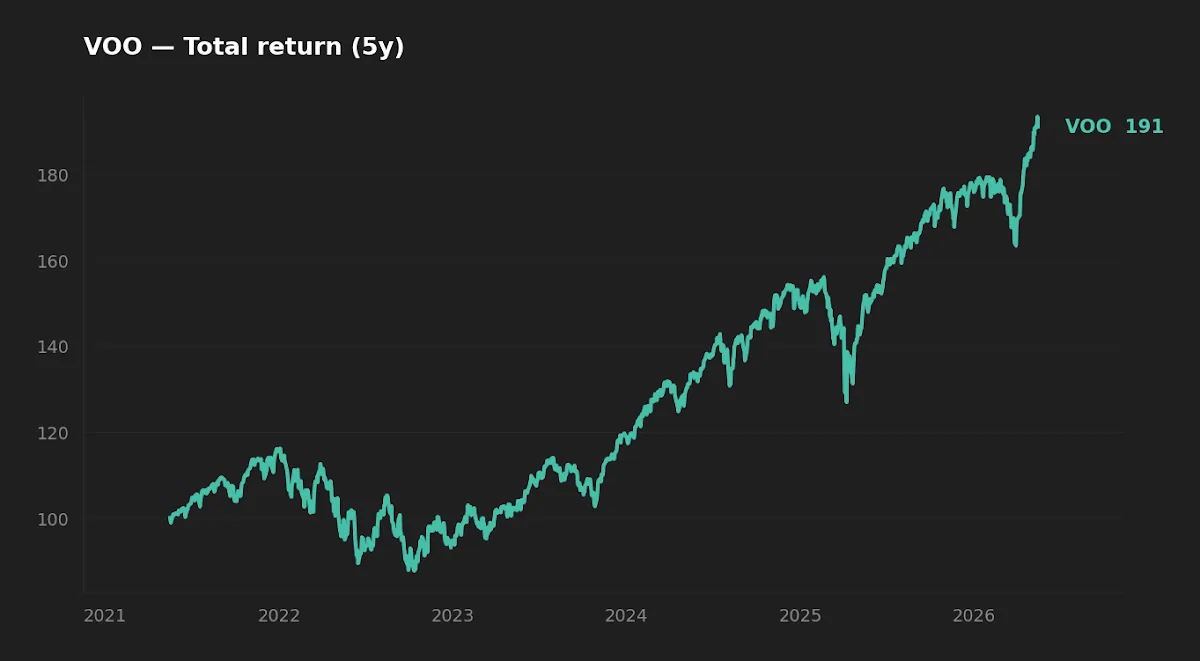
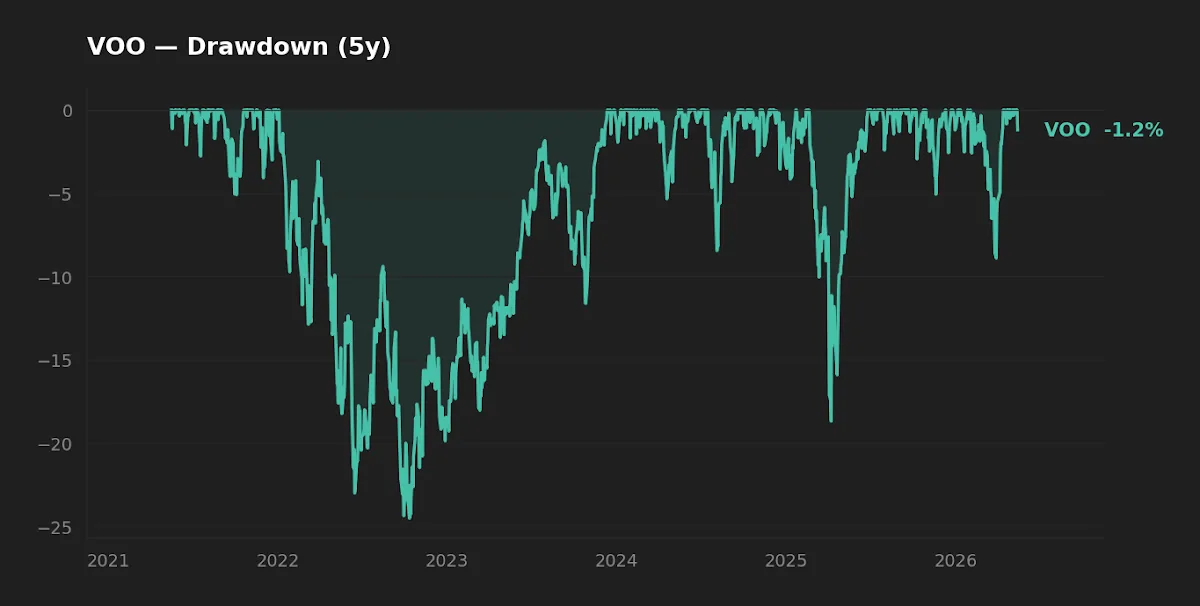
| VOO | 0.03% | $1,600.2B | 2010-09-07* | 1.1% | 13.9% | 15.6% | 16.8% | -24.5% |
VOO data from yfinance, pulled 2026-05-16; ER and inception from the Vanguard fund fact sheet. *The 2000 date returned by yfinance reflects the underlying index history; the ETF itself launched September 2010. The 5Y max drawdown of -24.5% spans the 2022 rate-shock window — useful context for the duration discussion below.
The duration problem the narrative ignores
Utility, infrastructure REIT, and renewable-power equity values are duration-sensitive. The discount rate that prices their long-dated cash flows is anchored to the 10Y Treasury, which sits at 4.47% (FRED, as-of 2026-05-14) versus roughly 1.5% in early 2022. That single move was enough to drive utility-sector ETFs into a drawdown comparable to VOO's -24.5% even though their underlying earnings held up reasonably well. The 2022 drawdown wasn't a demand story; it was a discount-rate story.
An investor buying utilities for the AI-load thesis has to model what happens if rates stay sticky at current levels, or move higher. With CPI YoY still at 3.9% (FRED, April) and the Fed Funds rate at 3.64%, the path to a sub-3% 10Y is not obvious. The demand thesis and the rates regime are independent variables. A position that bets on both moving favorably is making two macro calls, not one.
What utilities aren't anymore: the factor drift
Here is the non-obvious point. Utilities were historically a low-vol, low-beta, dividend-yield exposure. That is why they appeared in defensive sleeves and yield-oriented portfolios. The factor profile is shifting.
When a regulated utility's load-growth assumption moves from +0.5%/yr to +3–5%/yr because of multi-year data-center commitments, its earnings stream starts to look more like a regulated-growth company than a bond proxy. Realized beta has crept up over the past 24 months in several names with the largest data-center exposure, and the correlation pattern with broad equities in the 2024–2025 window looks more equity-like than it has historically. An investor who held a utility sector ETF as their "low-vol sleeve" purchased before 2023 is increasingly holding something else — and the portfolio-level risk that change implies has not been repriced for most retail holders. The framework piece on factor investing in the AI era covers why factor loadings drift even when the ticker doesn't change.
Initially the editor assumed the AI thesis was straightforwardly bullish for the utility sleeve. Running a rolling 24-month regression against the S&P 500 reframed that view: the beta isn't where it used to be, and a holder who hasn't checked is unconsciously holding a different position than the one they bought.
An investor who held a utility sector ETF as their "low-vol sleeve" before 2023 is increasingly holding something else — and that change in factor exposure has not been repriced for most retail holders.
How a broad-market holder already owns much of this
This is the part most "AI infrastructure" pieces skip. A holder of VOO or a U.S. total-market fund already has meaningful exposure to:
- The utility sector at roughly cap-weight (~2.5% of the S&P 500)
- Industrials at ~8%, including companies whose capital-goods order books benefit directly from grid build-out — the supplier mechanics are detailed in The Great Grid Modernization
- Real estate at ~2.5%, partially overlapping data-center REITs
- The single largest funder of the build itself: the mega-cap hyperscaler capex pipeline, which sits inside the technology sector at >25% of cap-weight
VOO's 0.03% expense ratio means that incidental exposure costs almost nothing. Thematic AI-infrastructure ETFs in this space tend to charge 0.30%–0.65%. The fee gap compounds: at 0.50% on a $40,000 sleeve over 25 years assuming a 7% gross return, the cumulative drag works out to roughly $25,000 of foregone terminal value versus the same money in a 0.03%-ER core holding. That is not a reason to avoid all thematic exposure, but it is a reason to size it deliberately rather than reflexively.
Data-center REITs: pure-play, with a specific risk profile
Data-center REITs trade as specialty REITs alongside the broader real-estate sector. They are the most direct way to express the AI-load thesis and also the most concentrated. Three structural issues are worth pricing in: high debt loads make them cost-of-capital sensitive in a way diversified equity isn't; long lease build-outs lock in spreads at the time of signing, so margin economics depend on when capacity comes online relative to the rate environment; and customer concentration is real — a small number of hyperscalers account for a large share of demand, and their capex pipelines have been revised both directions within single 12-month windows historically.
The 2022 drawdown is the closest stress test we have for the listed names. It was rate-driven, not demand-driven. We do not have a credit-cycle stress test or a hyperscaler-capex-cut scenario in the live record. Data Center REITs vs. Infrastructure ETFs covers the cash-flow comparison in more detail.
At-a-glance scoreboard
| Question | Answer | Confidence |
|---|---|---|
| Is the load-growth story real? | Yes — multi-source forecasts agree on direction | High |
| Survives a 5%+ 10Y regime? | The cash flows yes; the equity multiples, less obviously | Moderate |
| Should it replace broad-market core? | No — overlap is large; thematic adds concentration without obvious risk-adjusted improvement | High |
| Sensible position size for a new sleeve? | 3–5% for investors with no existing dedicated infrastructure exposure | Moderate |
FAQ
Is "AI infrastructure" a real thesis or just a marketing label?
Real thesis on the demand side — the IEA and EPRI estimates aren't promotional, and grid-operator load forecasts are filed with regulators. Marketing label on the implementation side: many thematic ETFs sold under "AI infrastructure" are repackaged utility, industrial, and REIT exposure. Read the holdings before deciding what you're buying.
Does the thesis still work if rates stay at 4–5%?
The cash-flow story works at any rate level — utilities still earn their allowed return, REITs still collect rent. The equity-multiple story is harder. Long-duration assets re-rate when rates change. An investor who needs both demand growth and falling rates is making two macro bets stacked.
Should I just buy the mega-cap tech names instead?
That is a different trade. Mega-cap tech captures the AI software and chip economics plus the capex itself; infrastructure captures the supplier side. The two are correlated through the build cycle but have different rate sensitivities and different valuation regimes. They are not substitutes.
What's the smallest amount of AI infra exposure that makes sense?
For an investor with a broad-market core and no current dedicated infrastructure exposure, somewhere in the 3–5% range expresses a tilt without overcommitting. Below 2%, the position contributes less to the portfolio's behavior than its expense ratio costs. Above 10%, it becomes a directional call on a single macro narrative.
How do I tell if my existing portfolio already covers this?
Pull the sector breakdown of your largest equity holding. Add the utilities, industrials, real-estate, and tech weights. If those four together exceed ~40% of your equity allocation — which they will for any holder of cap-weighted broad-market index funds — incremental AI-infrastructure exposure largely doubles up rather than diversifying. Why VOO Is Not Enough walks through where the gaps actually are.
What this analysis can and can't tell you
Most thematic AI-infrastructure ETFs have three to five years of live track record. There is no credit-cycle stress test or hyperscaler-capex-cancellation scenario in their live history beyond the 2022 rate shock. Load-growth forecasts from grid operators are estimates, not contracts, and have been revised both directions historically. The factor-drift argument for utilities is observable in 2023–2025 returns but is recent — it may revert if data-center demand growth slows or if some announced capacity gets cancelled. Treat any verdict on this trade as conditional on a regime that has not yet been tested across a full cycle.
Scenarios where each shape fits
- Reader in their 30s, 401(k) only, broad-index core, no dedicated thematic exposure. A 3–5% sleeve in a diversified infrastructure fund (not a pure data-center play) gives access to the load-growth side without the REIT-style concentration.
- Reader heavy in cap-weighted S&P 500 already. Much of the underlying exposure is already in the cap-weight. A thematic add usually doubles the bet rather than diversifying. Pair this analysis with a re-read of the broad-market gap pieces before sizing anything new.
- Reader holding utility ETFs purchased pre-2023 for "defensive yield." Re-examine the factor exposure. The position may no longer be doing the job it was bought for, even if the ticker is unchanged.
- Reader near retirement focused on income. Data-center REITs offer real yield but with single-tenant concentration and high rate-sensitivity. Treat as satellite, not core income.
Editor's read
The AI infrastructure narrative is one of the better-grounded macro stories of 2026 — the load-growth math is real, the build cycle is multi-year, and the permitting constraint (a new high-voltage line takes years, not months) gives the demand side staying power. But "real macro story" and "good investment for any portfolio at any size" are different statements. If forced to take a position, the editor leans toward broader infrastructure exposure with utility, industrial, and grid-equipment weight rather than pure-play data-center thematics — it diversifies across the value chain and is less rate-sensitive than the REIT-heavy options. For a portfolio with broad-market core already in place, a 3–5% sleeve is a defensible tilt. A 15–20% reallocation away from broad equity into this single theme is hard to justify without taking a directional bet on rates falling, and that is a separate decision.
The editor does not currently hold a dedicated AI-infrastructure ETF. Broad-market index exposure provides incidental access to the underlying utility, industrial, and real-estate sectors at cap-weight.
Key takeaways
- The AI infrastructure thesis is two trades: demand growth (real, multi-year) and duration (rate-sensitive, currently expensive). Most retail framings collapse them.
- Utility-sector exposure once used as a low-vol defensive sleeve is drifting toward regulated-growth behavior. The factor profile of older positions has changed without most holders repricing it.
- Data-center REITs are the purest expression and the most concentrated risk; the 2022 rate shock is the only live stress test on record.
- Investors with a broad U.S. index core already own meaningful exposure through utilities, industrials, real estate, and the hyperscaler capex pipeline. A thematic ETF often duplicates beta the core already provides.
- For a tilt, 3–5% is the size at which a thematic sleeve does work without dominating portfolio behavior or duplicating existing core exposure.
Methodology
ETF reference data (expense ratio, AUM, yield, 5Y/10Y CAGR, volatility, max drawdown) sourced from yfinance using daily total-return series, pulled 2026-05-16; expense ratio and inception cross-checked against the Vanguard fund profile. Macro reference numbers — 10Y Treasury yield, Fed Funds rate, VIX, CPI YoY — from FRED with as-of dates noted in the stat row above. Industry electricity-load estimates referenced from the IEA's Electricity 2024 report and EPRI's 2024 white paper on data-center load growth. S&P 500 sector weights are approximate, based on recent quarter-end S&P Dow Jones Indices methodology disclosures. The 5Y window is short for cross-cycle inference; treat single-fund return statistics as descriptive, not predictive. For a longer-horizon framing of how infrastructure fits a multi-decade allocation, see The 30-Year View: Why Infrastructure is the Ultimate Legacy Asset.
This article is for educational purposes and does not constitute personalized financial advice. See full Disclaimer.