
The short version
- GRID and XLU are often grouped as "electricity plays," but they own structurally different businesses: GRID holds the equipment makers (transformers, switchgear, automation); XLU holds the regulated utilities that buy from them.
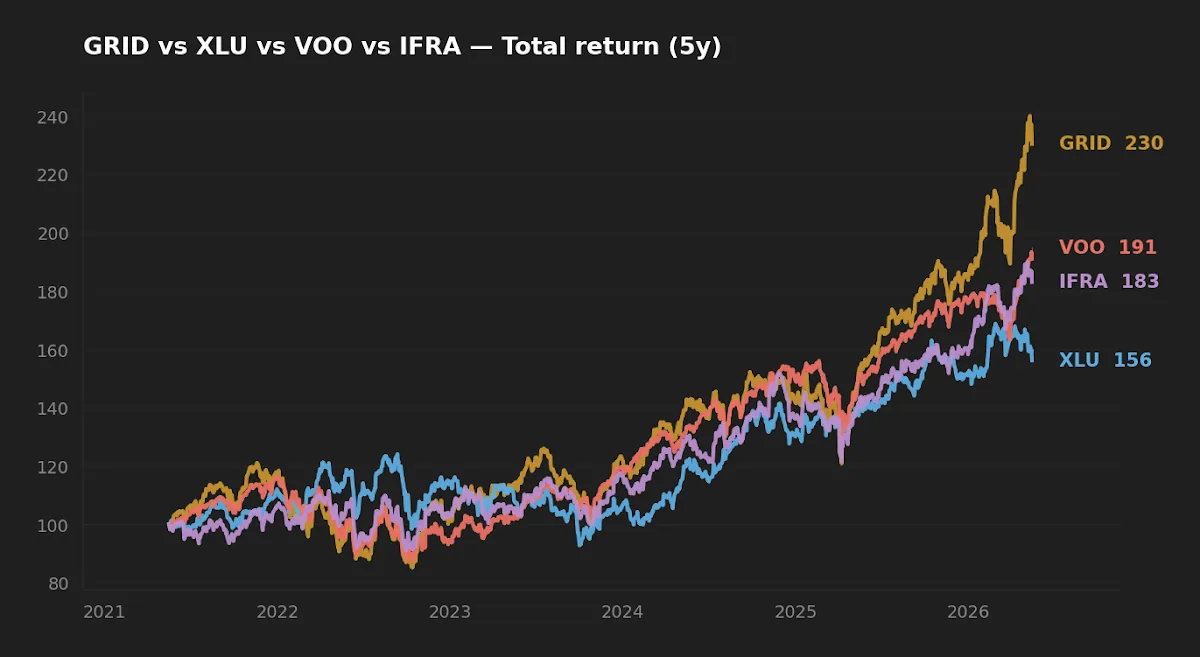
- Over the trailing 5 years GRID compounded at 18.5% annualized vs. XLU's 9.2% — but with a -29.6% maximum drawdown vs. XLU's -25.3%, and at roughly 7× the expense ratio (0.56% vs. 0.08%).
- The interesting question is not "which is better" but "which slot in a long-term portfolio does each fill, and at what cost in fees, concentration, and behavioral fragility."
Every few years, a thematic narrative arrives wrapped in the language of inevitability. The current one is grid modernization: data-center load growth, electrification of transport, and aging transmission infrastructure all converging on the same physical bottleneck. The narrative is broadly correct. The harder question is whether a thematic ETF priced at 0.56% expense ratio captures that thesis cleanly, or whether the cleaner exposure already sits inside a broad index at one-tenth the fee.
This article works through the realized data on four candidates — GRID (smart-grid equipment), XLU (regulated utilities), IFRA (broad U.S. infrastructure), and VOO (the broad U.S. market benchmark) — and tries to separate what the numbers actually show from what the narrative wants us to feel.
What each fund actually owns
The distinction matters because the labels collapse it. GRID — the First Trust NASDAQ Clean Edge Smart Grid Infrastructure Index Fund — holds the equipment makers and grid-technology firms: Eaton, Vertiv, Schneider Electric, ABB, GE Vernova, and a tail of automation and storage names. These are industrials with operating leverage to capex cycles. XLU — the State Street Utilities Select Sector SPDR — holds the regulated utilities themselves: NextEra, Southern, Duke, Constellation. These are rate-base businesses with regulated returns on equity, typically lower beta, and bond-like sensitivity to long rates.
IFRA, the iShares U.S. Infrastructure ETF, is a broader equal-weight basket spanning construction, materials, transportation, and utilities — less concentrated on the "electricity" theme but with meaningful overlap. VOO is the benchmark: the broad U.S. equity market, where roughly 2.3% of capitalization already sits in utilities and another fraction in industrial-electric names.
This matters for one specific reason: if the underlying industrials are large enough (Eaton, Schneider, GE Vernova all sit in VOO at non-trivial weights), the thematic premium narrows to "tilt and concentration," not "exposure." That is a different question — and a more honest one.
The data: five-year and ten-year realized returns
| Ticker | ER | AUM | Yield | 5Y CAGR | 10Y CAGR | 5Y Vol | 5Y Max DD | Inception |
|---|---|---|---|---|---|---|---|---|
| GRID | 0.56% | $10.0B | 0.8% | 18.5% | 19.6% | 20.9% | -29.6% | 2009-11 |
| XLU | 0.08% | $24.1B | 2.5% | 9.2% | 9.4% | 17.3% | -25.3% | 1998-12 |
| IFRA | 0.30% | $4.1B | 1.6% | 12.8% | n/a | 18.0% | -19.9% | 2018-04 |
| VOO | 0.03% | $1,600B | 1.1% | 13.9% | 15.6% | 16.8% | -24.5% | 2010-09 |
Data: yfinance close prices through 2026-05-17; expense ratios and AUM from issuer fact sheets (First Trust, SSGA, iShares, Vanguard).
The 5Y vs. 10Y figure deserves a second look
GRID's 5-year CAGR of 18.5% is slightly below its 10-year CAGR of 19.6%. That ordering is unusual and worth pausing on. It is not evidence that the AI infrastructure thesis has failed — it reflects a base effect. The trailing 5-year window begins in mid-2021, near a post-pandemic equity high; the 10-year window starts in 2016 at a much more modest base. Different starting points, different denominators, different stories.
The honest reading: GRID's underlying industrials — power management, electrical components, automation — have been compounding at roughly 18–20% for a decade. The AI narrative is a recent overlay on a much older capex super-cycle in electrification. That is more reassuring than "AI has changed everything," because it suggests the thesis does not depend on any one narrative remaining in vogue. It is also less exciting, which is usually what calibrated analysis sounds like.
The literature on thematic ETFs (see for example the academic discussion of theme-fund flows and the live-vs-backtest gap) is consistent on one point: themes that work tend to work because of structural earnings growth, not because of label tailwinds. If transformer lead times stay elevated for years, that is structural. If "AI infrastructure" stops being a tagline, that is cosmetic.

Realized risk: drawdown, volatility, and the small-AUM question
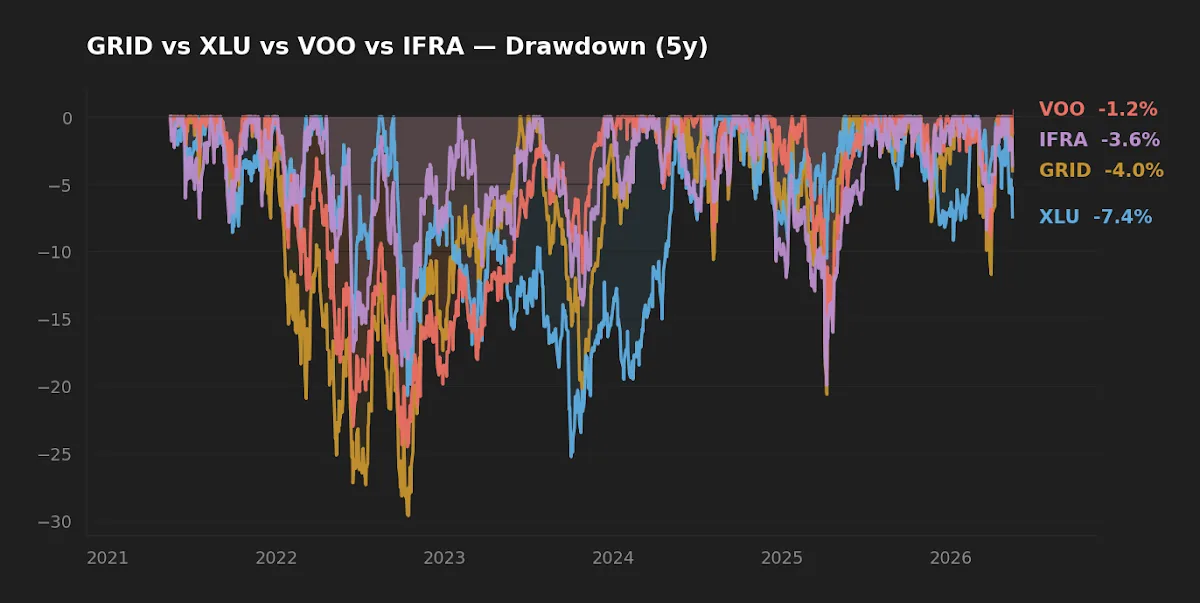
GRID delivered the highest return in the four-fund set and also the highest realized volatility (20.9% annualized) and the deepest drawdown (-29.6%). That ordering is internally consistent: equipment industrials are cyclically exposed in a way that regulated utilities are not. XLU's lower drawdown (-25.3%) is partly the value of regulated cash flows — and partly the value of a sleeve that pays 2.5% yield while you wait. IFRA, the broadest basket, posted the shallowest 5-year drawdown at -19.9%, which is what equal-weight diversification across construction, materials, transport, and utilities tends to produce.
The macro context matters here. With the 10-year Treasury at 4.47% and Fed funds at 3.64% (FRED, as of 2026-05-14 and 2026-04-01 respectively), and CPI year-over-year at 3.9%, utility valuations are operating against a discount-rate headwind that has now persisted for several years. XLU's 9.2% 5-year CAGR is in fact a creditable result given that rate regime — utilities are long-duration cash-flow assets, and the rate environment has been hostile.
GRID's underlying industrials have been compounding at roughly 18–20% annualized for a decade. The AI narrative is a recent overlay on a much older capex super-cycle in electrification — and that distinction matters for how durable you should expect the return profile to be.
On AUM scale: GRID at $10.0B is now a comfortably investable size — no immediate closure risk, reasonable secondary-market liquidity, modest bid-ask friction. It was not always so. As recently as 2022 the fund was a fraction of this size, with materially wider spreads. That scale-induced change is worth flagging because it is one of the quieter ways thematic ETFs change character: as AUM grows, tracking improves and friction falls, but the fund also becomes more index-like in its rebalancing impact.
The expense-ratio question, made concrete
GRID's 0.56% expense ratio versus VOO's 0.03% is a fee differential of 53 basis points per year. Over 30 years, on a $10,000 starting investment growing at a hypothetical 8% gross, that fee gap compounds to roughly $14,000 in foregone terminal wealth — about 14% of the no-fee terminal value. That is the cost of the thematic overlay, and it must be earned back through excess return.
Over the trailing 10 years, GRID has cleared that hurdle: 19.6% net of fees against VOO's 15.6%. Over the trailing 5 years, it has not: 18.5% net of fees against VOO's 13.9% is still a positive spread, but the gap narrows once you adjust for the higher realized volatility and the deeper drawdown. The risk-adjusted spread is not free alpha.
For the broader question of when thematic tilts actually justify their fee, the discussion in our note on factor investing in the AI era is relevant: the answer hinges on whether the tilt captures a structural premium or merely a recent narrative. Equipment industrials currently look closer to the former, but the case is not closed.
What this comparison can and can't tell you
The 5- and 10-year windows here include the post-COVID rebound, the 2022 rate-shock drawdown, and the 2023-2025 AI-capex re-rating. They do not include a deflationary recession, a regulated-utility re-rating cycle of the kind seen in the late 1990s, or a sustained period of zero industrial capex growth. Single-regime risk is real: GRID has never been tested as a public ETF in a sustained capex-decline environment, because no such environment has existed since its 2009 inception. The narrative may break in a way the data cannot show you, because the data have not seen that scenario.
Two further limits worth naming. First, expense ratio is not the only friction: bid-ask spread, premium/discount to NAV, and the tax-cost ratio of distributions also matter — particularly for a 0.8% yielding fund where dividend treatment is less material than for XLU's 2.5%. Second, sector concentration: GRID's top 10 holdings concentrate the thesis into a small set of names. A single-issuer disappointment hits harder than in a broad benchmark.
Scoreboard
| Category | Winner | Why |
|---|---|---|
| Cost | VOO | 0.03% ER, materially below any thematic alternative. |
| Realized risk (5Y max DD) | IFRA | -19.9% is the shallowest in the set; equal-weight diversification helps. |
| Realized return (10Y CAGR) | GRID | 19.6% net of fees, ahead of VOO's 15.6%, with structurally higher volatility. |
| Suitability as core holding | VOO | Diversified, low-cost, regime-tested; the thematic funds are satellites by design. |
Scenarios where each fund fits
A reader in their 30s with VOO already as core, 30-year horizon, comfortable adding a small thematic tilt: GRID is a defensible 3–5% satellite. The structural thesis (capex on transmission, data-center load, industrial electrification) has a decade-long base in the realized data, and the position is small enough that the higher volatility and concentration do not threaten the long-horizon plan.
A reader closer to retirement seeking income and capital preservation rather than capex-cycle exposure: XLU is the more natural slot. The 2.5% yield, the lower drawdown floor, and the regulated cash-flow profile align with a defensive sleeve. The discussion in our utilities note covers the rate-sensitivity dynamics in more detail.
A reader wanting "infrastructure exposure" without picking a sub-theme: IFRA is the cleanest single-ticket option. Lower realized drawdown, broader diversification, half GRID's expense ratio. The trade-off is dilution: you also own construction, transportation, and materials, not a pure-play on electrical equipment.
A reader who already owns VOO and is unsure whether any tilt is needed: The honest answer is that VOO already holds Eaton, Schneider, GE Vernova, and the major utilities at index weights. The thematic tilt buys concentration, not exposure. Whether that concentration is worth 53 basis points depends on conviction, not on the existence of the theme.
Editor's read
If forced to choose one for a long-term core sleeve, the editor would not choose any of the thematic options — VOO remains the cleaner foundation. If forced to choose a thematic satellite from this list, GRID is the most coherent: it captures a specific, durable capex story with a decade-long realized track record, and the 0.56% fee is defensible against the realized return spread. The case to size it modestly is strong; the case to size it large rests on conviction the data alone cannot quite justify.
The editor does not hold GRID, XLU, IFRA, or VOO at the time of writing — VOO-equivalent broad-market exposure is held via a different vehicle.
Frequently asked questions
Q1. Is GRID the same as "AI infrastructure" exposure?
Partly. GRID concentrates on smart-grid equipment and power management — components that benefit from AI-driven data-center load growth, but also from transport electrification, renewables build-out, and grid hardening. It is broader than "AI" and narrower than "infrastructure."
Q2. Why is the 10-year CAGR higher than the 5-year CAGR for GRID?
A starting-point effect. The 5-year window begins in mid-2021, near a post-pandemic equity high; the 10-year window begins in 2016 at a lower base. The 10Y figure also benefits from a partial rebound during 2023–2025. This is a reminder that trailing returns are sensitive to window choice — a meta-bias worth holding in mind.
Q3. Is XLU's 9.2% 5Y CAGR disappointing?
In absolute terms, no — that is a respectable real return after the 2022 rate-shock drawdown. Utilities are long-duration cash flows, and the trailing window included the most aggressive Federal Reserve tightening cycle in 40 years. A 9.2% net return in that environment is consistent with the sector's defensive role.
Q4. Does GRID's 0.56% fee compound into a meaningful drag?
On a 30-year horizon, the 53-basis-point gap to VOO compounds to roughly 14% of terminal wealth at 8% gross returns. Whether that is "worth it" depends on whether GRID's gross excess return clears that hurdle on a risk-adjusted basis. Historically yes; prospectively, no one can promise.
Q5. Should I prefer IFRA over GRID for a "less risky" infrastructure tilt?
IFRA had a shallower 5-year drawdown (-19.9% vs. -29.6%) and a lower expense ratio (0.30% vs. 0.56%), but also a lower realized return (12.8% vs. 18.5% 5Y CAGR). The trade-off is real: IFRA dilutes the equipment-makers thesis with broader sector exposure. Choose based on what you want to own, not on which label feels safer.
Key takeaways
- GRID and XLU sit on opposite sides of the electricity value chain: equipment makers versus regulated utilities. The return profiles, fee structures, and risk characteristics differ accordingly.
- GRID has compounded at 18–20% annualized for a decade — a structural pattern that predates the AI narrative. That is more durable than a label-driven thesis, but does not eliminate single-regime risk.
- The 53-basis-point fee gap to VOO compounds meaningfully over decades. Thematic tilts must justify their fee through realized risk-adjusted excess return, not narrative.
- VOO already holds most of GRID's largest constituents at index weights. The thematic ETF buys concentration, not exposure — and concentration cuts in both directions.
- For most long-horizon investors, the broad index is the core; thematic exposure, if used at all, is a small satellite sized to survive its own deepest drawdown.
For related context on long-horizon infrastructure framing, see also The 30-Year View on infrastructure as a legacy asset and why the current capex cycle extends beyond tech stocks.
Methodology
Price and total-return data: yfinance daily closes through 2026-05-17. Expense ratio and AUM: issuer fact sheets (First Trust for GRID, SSGA for XLU, iShares for IFRA, Vanguard for VOO), retrieved 2026-05-17. Macro reference data: FRED — 10-year Treasury 4.47% (as of 2026-05-14), Federal funds rate 3.64% (2026-04-01), VIX 17.26 (2026-05-14), CPI year-over-year 3.95% (2026-04-01). CAGR computed on adjusted close, geometric mean over trailing 5- and 10-year windows ending 2026-05-17. Maximum drawdown computed as the largest peak-to-trough decline within the 5-year window.
This article is for educational purposes and does not constitute personalized financial advice. See Disclaimer.