
The short version
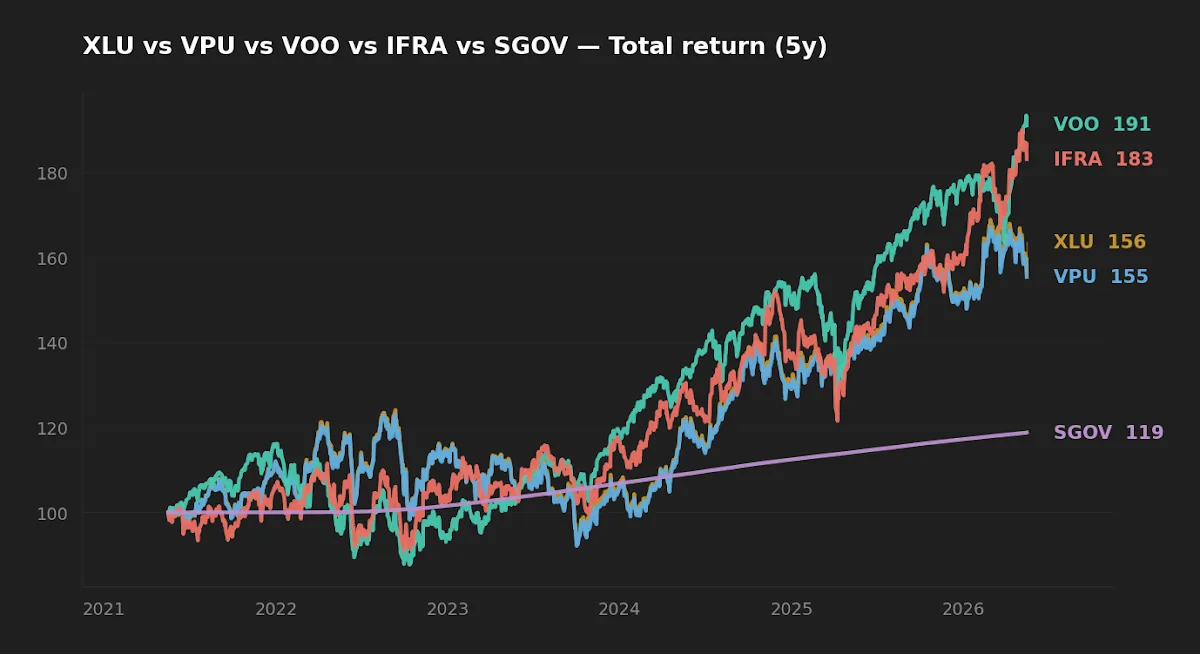
- The "AI data center demand plus rate cuts equals utility re-rating" thesis is plausible — and largely consensus. Five-year realized data show utility ETFs (XLU 9.2% CAGR, VPU 9.0%) have trailed the S&P 500 (VOO 13.9%) by roughly 470 basis points per year.
- The yield-competition argument needs scrutiny. SGOV currently yields 3.9% versus XLU's 2.5% — utility dividends do not yet out-yield cash, and the 10-year Treasury at 4.47% leaves real rates around half a percent.
- XLU versus VPU is a near-toss-up on cost and structure. The more interesting question is whether utilities are the right vehicle for the AI-power thesis at all, given how concentrated the actual hyperscaler exposure is inside each ETF.
The narrative is everywhere: AI data centers need 24/7 electricity, the Fed is cutting, therefore utilities are the next leg of the cycle. The setup is plausible. The realized data is more complicated — five years of total returns show utility ETFs lagging the S&P 500 by nearly five percentage points a year and currently yielding less than three-month T-bills. This piece works through what the AI-power thesis actually requires, and how XLU and VPU compare for an investor who wants regulated-utility exposure without confusing a narrative with a position.
Why utilities are back in the conversation
Utilities are regulated monopolies in electric, gas, and water distribution. Their cash flows are stable, their payout ratios are high, and for decades they traded as bond proxies — long-duration income streams that re-rate with the discount curve. Two stories have brought the sector back into focus in 2026.
The first is hyperscaler power demand. After roughly a decade of ~0.5% annual U.S. electricity demand growth, projections from grid operators and utility commission filings now cluster in the 3–7% range over the next five years, driven largely by data centers in regions with cheap power and existing transmission. The second is the rate cycle. The Fed Funds target stands at 3.64% (FRED, asof 2026-04-01), down from the prior peak; the 10-year Treasury sits at 4.47% (FRED, asof 2026-05-14). The classic story is that as discount rates fall, utility cash flows are revalued upward and competing cash yields fade.
Both points are real. Neither has yet translated into the kind of differential return the narrative implies. For broader macro context on this cycle, see Interest Rate Cuts in 2026: What Happens to Stocks, Bonds, and Gold? and the category-level framework in What "Falling Rates" Actually Does to Equity Categories.
The data: utility ETFs, a benchmark, and the alternatives
The table below shows the four equity vehicles most often pitched together in the AI-power thesis (XLU, VPU, IFRA) alongside the S&P 500 benchmark (VOO) and the cash alternative (SGOV). Numbers from yfinance, fetched 2026-05-17; expense ratios and AUM cross-checked against issuer fact sheets.
| Ticker | ER | AUM | Yield | 5Y CAGR | 10Y CAGR | 5Y Vol | 5Y MaxDD |
|---|---|---|---|---|---|---|---|
| XLU | 0.08% | $24.1B | 2.5% | 9.2% | 9.4% | 17.3% | -25.3% |
| VPU | 0.09% | $11.1B | 2.5% | 9.0% | 9.3% | 17.0% | -25.1% |
| IFRA | 0.30% | $4.1B | 1.6% | 12.8% | n/a | 18.0% | -19.9% |
| VOO | 0.03% | $1,600B | 1.1% | 13.9% | 15.6% | 16.8% | -24.5% |
| SGOV | 0.09% | $85.2B | 3.9% | 3.5% | n/a | 0.2% | -0.03% |
Issuer fact sheet references: XLU, VPU, IFRA, VOO, SGOV.
What the five-year record actually shows
The AI-power narrative did not appear in 2026. The hyperscaler capex acceleration has been visible since roughly 2023, and the rate-cut conversation has been live for most of 2024 and 2025. If utilities were the obvious beneficiary, the differential should already be in the price.
It isn't. Over the trailing five years, VOO compounded at 13.9% versus 9.2% for XLU and 9.0% for VPU. That gap — roughly 470 basis points per year — is not a tracking-error rounding error. Compounded over a decade it would more than double a starting dollar's separation. The infrastructure ETF IFRA, which holds the electrical-equipment and engineering names actually building the grid, returned 12.8% over the same window with a shallower max drawdown of -19.9%.
The realized-volatility comparison is just as awkward for the defensive-sleeve framing. XLU's 5-year volatility of 17.3% is essentially identical to VOO's 16.8%, and both sectors drew down within a percentage point of each other at their respective troughs. The "bond-proxy" character is conditional: in 2022's rate shock, utility cash flows got re-discounted at higher rates and the sector dropped roughly in line with the broad market. The defensive label survives in marketing copy; in the price data it has weakened.
This does not mean the AI-power thesis is wrong. It means the thesis must do work the realized data has not yet done — it has to compound through future earnings growth, regulated rate-base expansion, and capacity utilization, not through valuation re-rating off a low base. Initially I treated the sector as a cleaner expression of the AI-infrastructure trade. After running the rolling five-year regression against VOO and IFRA, that view didn't hold up.

The yield argument, examined honestly
One leg of the bullish utility case is that as cash yields fall, the 2.5% utility dividend becomes attractive relative to the alternatives. The current data complicates that picture. SGOV — three-month T-bills in ETF form — yields 3.9% with 0.2% annualized volatility and essentially no drawdown. XLU yields 2.5% with 17.3% volatility. The dividend reaching trade has not yet started, because cash still out-yields the dividend by 140 basis points.
For the yield-competition thesis to bite, Fed Funds must fall materially below the current 3.64%, and the 10-year (4.47%) must follow it down. With CPI YoY at 3.95% (FRED, asof 2026-04-01), real short rates are positive but modest — not the kind of zero-real-rate regime that historically drove the most aggressive reaching into dividend equity. A reader anchoring on the 2019–2021 utility re-rating should ask whether the macro setup actually resembles that period; right now it does not.
AI power demand: signal versus dilution
The hyperscaler power story is real, but it is concentrated. Roughly half of XLU's weight sits in five names; the differential AI exposure within the sector lives in a handful of utilities with hyperscaler-adjacent service territories, signed PPAs, or regulated rate-base growth approvals tied to data-center load. The rest of the basket — water utilities, smaller regional gas distributors, certain regulated electrics in declining-load regions — does not capture the same tailwind.
VPU broadens the universe to ~70 holdings versus XLU's ~30. That is a feature for diversification and a cost for thesis purity: the more names in the basket, the more the AI-power exposure gets diluted by utilities that do not benefit from it. For a deeper read of the upstream picks-and-shovels argument, see The Great Grid Modernization: Why Electrical Equipment is the New 'Pick and Shovel' and Why AI Is Driving a New Infrastructure Supercycle (Not Just Tech Stocks).
The AI-power story may eventually compound through utility earnings, but five years of realized data show the narrative trade has not yet outperformed the index it is meant to beat.
XLU versus VPU: the structural comparison
For an investor who has decided to take regulated-utility exposure, the head-to-head is unusually close. Expense ratios are 0.08% (XLU) and 0.09% (VPU) — a one-basis-point difference that is operationally invisible. Both funds are deep enough that bid-ask friction and capacity are non-issues at retail scale (XLU $24.1B AUM, VPU $11.1B). Yields are identical at 2.5%. Five-year CAGRs differ by 20 basis points, and volatilities by 30 — well inside noise.
The substantive difference is composition. XLU tracks the S&P 500 utilities sector, which concentrates exposure in mega-cap names. VPU tracks a broader CRSP-style utilities index that includes more mid- and small-cap regulated utilities. For someone wanting concentrated exposure to the largest, most heavily-followed utilities (which include the dominant AI-power names), XLU is the cleaner expression. For someone who wants broader diversification across the regulated-utility universe — and is willing to accept some dilution of the hyperscaler exposure — VPU is reasonable.
Realized risk and the bond-proxy myth
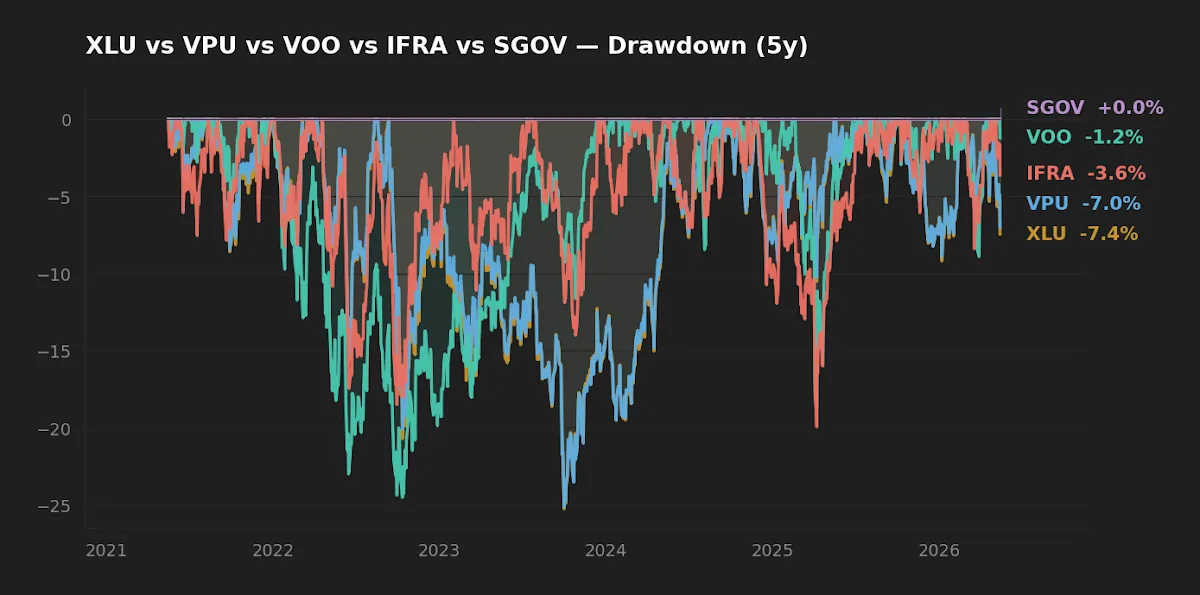
The drawdown chart is worth dwelling on. XLU drew down to -25.3% and VPU to -25.1% over the five-year window; VOO bottomed at -24.5%. There is no meaningful downside protection in owning utilities versus the broad index over this sample. IFRA actually had the shallowest drawdown of the equity options at -19.9%, despite carrying the highest equity volatility — a reminder that vol and drawdown measure different things.
The only meaningful defensive sleeve on this table is SGOV: 0.2% vol, near-zero drawdown, 3.9% yield. That is the role utilities used to play in a much lower-rate world. They no longer do. For a separate treatment of the cash-and-gold defensive sleeve, see The Science of Capital Protection: Why Gold and SGOV Are Your Ultimate Shields in 2026.
Scoreboard
| Category | Winner | Note |
|---|---|---|
| Cost (lowest ER) | VOO 0.03% | Among utilities: XLU 0.08% edges VPU 0.09%. |
| Realized 5Y return | VOO 13.9% | Utilities trailed by ~470 bps/yr. |
| Realized risk (drawdown) | IFRA -19.9% | Utilities offered no drawdown advantage. |
| Income (current yield) | SGOV 3.9% | Cash currently out-yields utility dividends. |
FAQ
Q: Do utilities actually benefit from rate cuts?
Theoretically yes, through cash-flow re-discounting and reduced competition from cash yields. In practice the magnitude depends on how far rates fall. With Fed Funds at 3.64% and the 10-year at 4.47%, we are well above the regime that produced the 2019–2021 utility re-rating. The thesis requires substantial further cuts to bite hard.
Q: Is the AI power-demand thesis already priced in?
Partially. The story has been visible for two-plus years, and trailing five-year returns show no outperformance versus VOO. That is consistent with the market either pricing in the thesis or being skeptical of utility companies' ability to monetize it. Either way, future returns must come from earnings growth, not multiple expansion off a depressed base.
Q: XLU or VPU — which should I choose?
For most investors the choice is largely platform-driven. XLU offers slightly cheaper, more concentrated exposure to mega-cap regulated utilities (including the dominant AI-power names). VPU offers broader diversification across the regulated-utility universe at a one-basis-point cost premium. The realized return and risk differences over five years are well inside noise.
Q: Are utilities still a defensive sleeve?
Less than they used to be. Five-year volatility of 17.3% and a -25.3% drawdown put XLU within a percentage point of the broad market on both measures. The true defensive role in the current rate regime sits with short-duration Treasuries (SGOV) and gold, not with rate-sensitive dividend equity.
Q: If I want AI-infrastructure exposure, is utilities the right vehicle?
It is one expression. The "picks and shovels" angle — electrical equipment, transformers, switchgear, engineering services — sits more in IFRA and individual industrial names. IFRA's 12.8% five-year CAGR with a -19.9% max drawdown suggests the upstream side of the trade has compounded better so far. Utilities give regulated cash-flow exposure; IFRA gives the build-out exposure. They are not substitutes.
What this comparison can and can't tell you
Five years is one regime. The window covers the post-COVID inflation spike, the 2022 rate shock, and the early AI-capex cycle. It does not cover a deep recession, a true zero-rate environment, or a regulated-utility allowed-ROE compression event. CAGR and drawdown are realized point estimates, not forward expectations. Issuer fact sheets and yfinance disagree at the basis-point level on yield and expense ratio because of timing; cross-checks are noted in the table footer.
Scenarios where each fund fits
- Long-horizon investor, broad index core, considering a defensive tilt: SGOV and short-duration Treasuries are a cleaner defensive sleeve than XLU/VPU in the current rate regime.
- Investor with strong conviction in the hyperscaler power-demand thesis: XLU is the more direct expression because it concentrates exposure in the largest utilities most likely to capture data-center load growth.
- Investor wanting broad regulated-utility diversification as a satellite tilt (5–10% of portfolio): VPU or XLU are near-equivalent; pick on the platform that minimizes commission and tax friction.
- Investor wanting AI-infrastructure exposure without rate-sensitive dividend equity: IFRA captures the equipment-and-engineering side of the build-out at a higher fee but with stronger trailing returns.
Editor's read
If the position has to be sized today, the editor leans toward a small XLU sleeve rather than VPU, on the grounds that the mega-cap concentration captures the actual AI-power exposure more cleanly and the one-basis-point fee edge is real over decades. But the more honest call is that utilities are not the obvious AI-infrastructure trade the consensus narrative implies. Five years of realized data show the sector has not outperformed the broad index, no longer offers a meaningful drawdown advantage, and currently yields less than cash. The thesis can still work — through earnings growth, not re-rating — but it deserves to be sized as a satellite tilt, not as a portfolio replacement.
The editor does not hold XLU or VPU at the time of writing.
Methodology
Price, total-return, volatility, and drawdown figures from yfinance, fetched 2026-05-17. Five-year window ends at the fetch date. Expense ratios and AUM cross-checked against issuer fact sheets (linked in the data table footnote). Macroeconomic figures (10-year Treasury, Fed Funds, CPI YoY) from FRED, with asof dates noted inline.
This article is for educational purposes and does not constitute personalized financial advice. See Disclaimer.