
The short version
- The 90/10 template — 90% diversified equity, 10% short-duration Treasury cash — is best understood as a 100% equity policy with a rebalancing buffer, not a meaningfully de-risked portfolio.
- Tilting the 90% sleeve toward "AI infrastructure" through XLU or PAVE has not produced lower realized volatility than broad VOO over the trailing five years; the data points the other direction.
- The framework's defensible value sits in the 10% cash sleeve's behavioral function, not in any return-smoothing claim about the AI tilt.
The 90/10 allocation — ninety percent diversified equity, ten percent short-duration Treasury cash — is one of the more durable shorthand structures in long-horizon investing. It is also one of the easier templates to oversell, particularly when paired with a thematic tilt like "AI infrastructure" that is marketed as both growth-oriented and defensive. This piece walks through the framework using realized five-year data on the ETFs typically named in it, and asks a narrower question than most blueprints attempt: what does the data say the structure actually does, and where does the marketing get ahead of the math?
The short answer is that the cash sleeve does useful behavioral work, the AI-infrastructure tilt is not a volatility reducer, and most of the realized risk in any 90/10 build still lives in the 90% equity portion — exactly as one should expect. The interesting design decisions sit inside that 90% slice, and they are return decisions, not risk decisions.
Context: what 90/10 is, and what it is not
The 90/10 framework predates any AI theme. A small cash reserve held against a diversified equity book is a slightly de-risked version of a 100% equity policy — small enough that long-run expected return changes only marginally, large enough that an investor can rebalance into a drawdown without forced selling. The academic rebalancing literature, including Daryanani (2008) and Vanguard's 2024 research, treats the cash sleeve as a behavioral and operational tool, not a hedge. It exists to make the equity policy actually executable across cycles.
The macro backdrop matters. As of mid-May 2026, the 10-year Treasury yields 4.47%, Fed funds sits at 3.64%, and the front of the curve still pays enough that holding cash equivalents no longer carries the brutal opportunity cost of the late-2010s zero-rates regime (FRED, asof 2026-05-14 and 2026-04-01). SGOV's trailing 5-year CAGR of 3.5% partly reflects that earlier regime; its current 3.9% distribution yield is a better forward proxy. The cost of holding ten percent in cash has shrunk meaningfully, which makes the framework easier to defend on opportunity-cost grounds than it would have been five years ago.
The ETFs on the table: realized 5-year data
Numbers below are from yfinance, pulled 2026-05-17, with expense ratio and AUM cross-checked against issuer fact sheets. Return and volatility figures are annualized over the trailing 5-year window; maximum drawdown is daily total-return.
| Ticker | Role | ER | AUM | Yield | 5Y CAGR | 5Y Vol | 5Y Max DD |
|---|---|---|---|---|---|---|---|
| VOO | Broad US equity core | 0.03% | $1,600.2B | 1.1% | 13.9% | 16.8% | -24.5% |
| QQQM | Large-cap growth / tech | 0.15% | $82.9B | 0.5% | 17.6% | 22.3% | -35.0% |
| XLU | Utilities (AI power proxy) | 0.08% | $24.1B | 2.5% | 9.2% | 17.3% | -25.3% |
| PAVE | US infrastructure development | 0.47% | $13.4B | 0.8% | 16.4% | 21.6% | -26.2% |
| SGOV | 0–3 month T-bill cash sleeve | 0.09% | $85.2B | 3.9% | 3.5% | 0.2% | -0.0% |
Data: yfinance, pulled 2026-05-17. Fund descriptors from issuer fact sheets linked above.
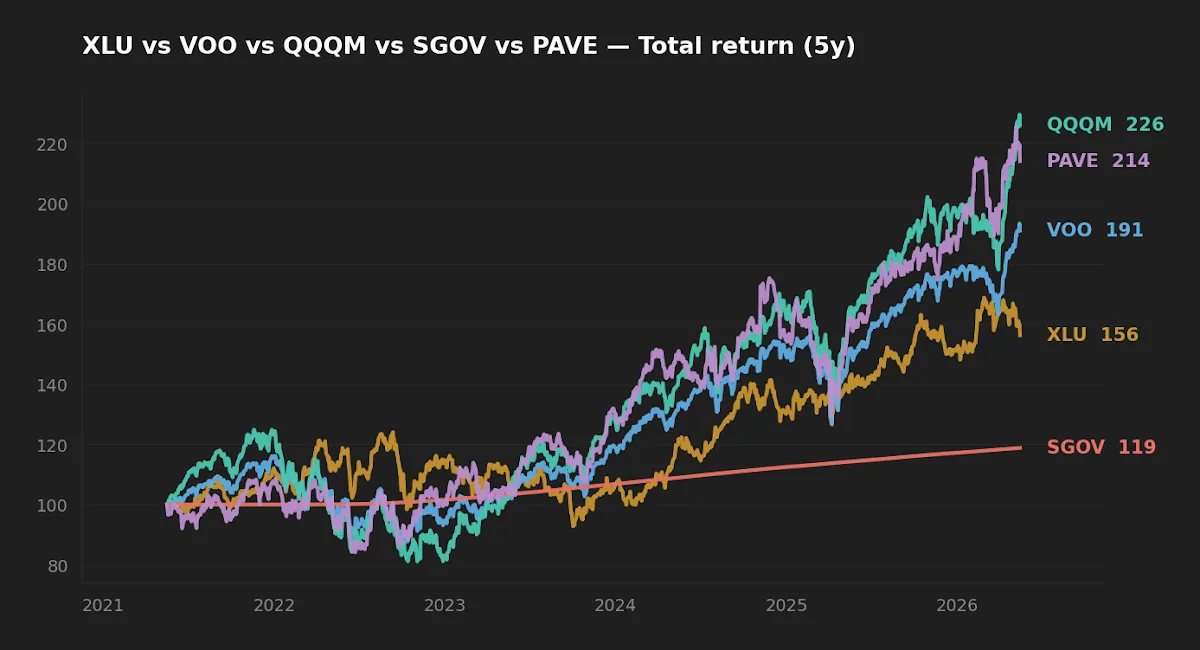
The AI-infrastructure tilt did not reduce realized volatility
The marketing instinct around "physical AI infrastructure" — typically routed through utilities ETFs like XLU or development-themed funds like PAVE — frames the tilt as defensive ballast. The realized data over the trailing five years does not support that framing. XLU's annualized volatility of 17.3% sits slightly above VOO's 16.8%, and PAVE's 21.6% volatility runs meaningfully hotter than the broad index. Maximum drawdowns tell a similar story: XLU drew down 25.3% and PAVE 26.2% over the five-year window, both deeper than VOO's 24.5%.
This is the piece most thematic blueprints skip. Utilities, historically a low-beta sector, have re-rated with the AI power-demand narrative; that re-rating raises returns and volatility together. PAVE blends industrials, materials, and construction names whose cyclicality has always made them more volatile than the index. Calling either an "AI infrastructure shock absorber" describes the story, not the numbers. Over this window, XLU delivered 9.2% CAGR with 17.3% volatility — a Sharpe-ish ratio well below VOO; PAVE delivered 16.4% with 21.6% volatility, competitive with VOO on return but at materially higher realized risk.

None of this argues against owning a sector or theme tilt. It argues against importing a thematic name and assuming its narrative function (defensive backbone) maps onto its statistical behavior (often higher beta than the broad index). If the role needed in the portfolio is volatility reduction, the cash sleeve does that work — at zero ambiguity, with a 5-year realized volatility of 0.2% and a maximum drawdown that effectively rounds to zero.
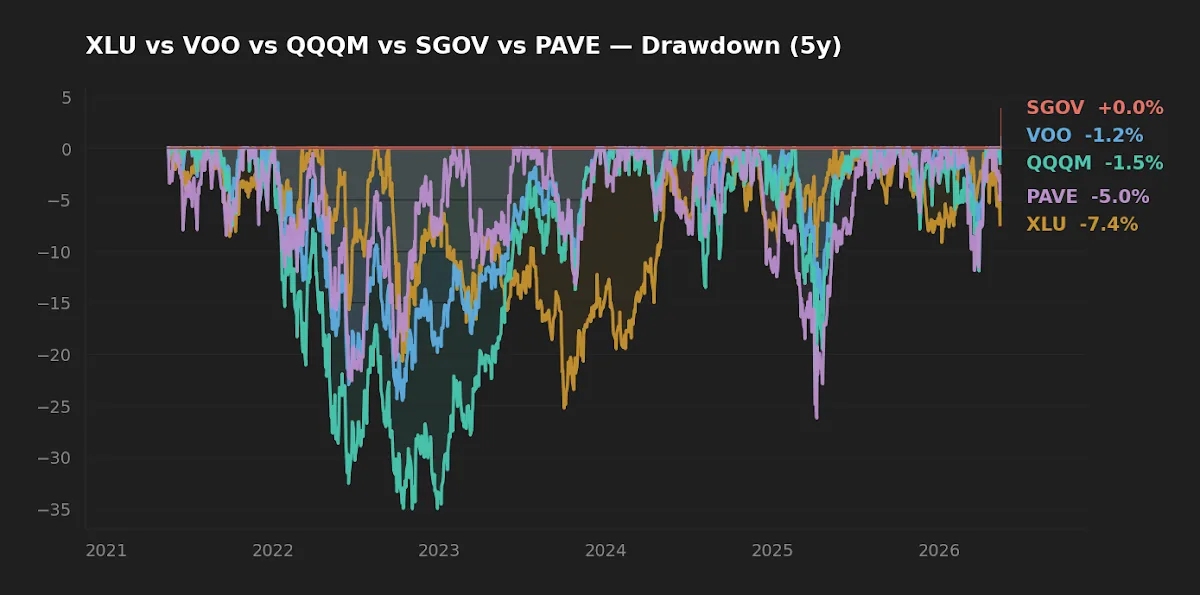
The 10% cash sleeve does the de-risking; the AI tilt is a return decision, not a risk decision.
The 90% equity sleeve: where the real choices sit
Once the 10% cash sleeve is accepted as a rebalancing buffer rather than a hedge, the meaningful design question is what goes inside the 90%. A few honest framings:
- Pure VOO core (90% / 10%): the cleanest expression of the framework. A 0.03% expense ratio, $1.6T AUM, and broad cap-weighted exposure to US large-caps. Implementation friction is essentially zero. The case against is mostly aesthetic — it does not feel like an "AI portfolio," even though VOO already carries meaningful weight in the mega-cap AI names.
- VOO with a QQQM tilt: a way to lean into the part of the equity market that has carried the AI factor exposure over the trailing five years (17.6% CAGR vs VOO's 13.9%). The cost is realized drawdown depth (-35.0% over the window) and concentration in a handful of mega-caps VOO already overweights.
- VOO with XLU and/or PAVE: the "physical infrastructure" tilt. Useful as a satellite, not as a defensive replacement for broad equity. Implementation friction is higher — both funds are smaller, narrower, and more expensive at 0.08% and 0.47% respectively — and realized correlation to VOO has been high enough that the diversification benefit is smaller than the marketing suggests.
The relevant academic anchor here is Sharpe's 1991 reminder that the average actively managed dollar must, by arithmetic, underperform the average indexed dollar after costs. Theme tilts behave like a soft form of active management even when implemented through index-tracking ETFs: the moment one deviates from the cap-weighted market, one is taking active risk relative to the benchmark and paying for it in either fees, tracking error, or both. PAVE's 0.47% expense ratio versus VOO's 0.03% compounds to roughly 12% of starting capital over thirty years at otherwise identical gross returns — a non-trivial drag, before any tax-cost considerations.
The 10% cash sleeve: rebalancing optionality, not a hedge
SGOV's role is operational. It pays 3.9% on the distribution yield with effectively zero price volatility (5Y vol 0.2%, max drawdown -0.0%) and a 0.09% expense ratio. It does not hedge equity drawdowns in any portfolio-construction sense — it sits at near-zero correlation with equity and rises only modestly when equity falls. What it does provide is rebalancing capacity: when the 90% sleeve drops 25%, the cash sleeve has not moved, and band-rebalancing rules of the kind described in the editor's portfolio log can be executed without forced sales at depressed prices.
The opportunity cost of this sleeve depends entirely on the rate environment. At today's 3.6%–4.5% short-rate curve, holding 10% in SGOV gives up roughly 100 bps of expected portfolio return versus 100% VOO at long-run equity assumptions — a manageable price for the behavioral and operational benefits. At zero rates, the same sleeve gave up closer to 700 bps. Long-term frameworks need to acknowledge this regime-dependence rather than treating "90/10" as a universal recipe; initially the editor thought of the sleeve as a structural constant, but rate-cycle sensitivity is large enough that the right cash weight is a function of the short curve, not a fixed number.
Scoreboard
| Category | Winner (5Y data) | Note |
|---|---|---|
| Lowest cost | VOO (0.03%) | PAVE at 0.47% is the priciest sleeve here. |
| Realized risk reduction | SGOV | XLU and PAVE did not reduce volatility vs VOO. |
| Realized return | QQQM (17.6%) | Bought at a -35.0% maximum drawdown. |
| Suitability as core | VOO | Breadth, cost, and fund scale all point here. |
FAQ
Q: Is 90/10 too aggressive for a near-retiree?
For an investor inside ten years of drawdown, 90/10 is closer to a 100% equity policy than to a balanced portfolio. The 10% cash sleeve provides at most one to two years of withdrawals; it is not a defense against a multi-year bear market. Adding intermediate-duration bonds is a separate conversation the framework as written does not address.
Q: Does XLU still count as a defensive sector after the AI re-rating?
The trailing 5-year data says no — XLU's volatility now sits slightly above VOO's. Whether that re-rating persists is a forward question the historical data cannot answer, but the "defensive utility" framing is leaning on a prior regime.
Q: Why not include international equity?
A reasonable choice. The 90/10 template as commonly written is US-only; a globally-diversified version (for example, splitting the 90% between VOO and VXUS) is defensible on the same logic. The 2026 hybrid portfolio piece walks through one such build.
Q: Should I use PAVE or XLU for AI-infrastructure exposure?
PAVE has delivered higher CAGR (16.4% vs 9.2%) and higher volatility (21.6% vs 17.3%) over the trailing five years. XLU has roughly twice the AUM ($24.1B vs $13.4B) and a far lower expense ratio (0.08% vs 0.47%). The choice depends on whether one is buying the income-and-stability narrative of utilities or the construction-and-cyclicality narrative of broad infrastructure. The editor finds the cost gap meaningful.
Q: Does SGOV's 3.9% yield make it competitive with equity returns?
No, but it makes the opportunity cost of holding cash much smaller than in the prior decade. Long-run equity expected returns sit in the 5%–7% real range; SGOV's nominal yield against current CPI of 3.9% (FRED, asof 2026-04-01) is approximately flat in real terms. It preserves capital and rebalancing optionality; it does not compound wealth at equity rates.
What this analysis can and can't tell you
The five-year window covers a single market cycle — a post-pandemic recovery, a 2022 drawdown, and the AI-led 2023–2025 rally. It does not cover a prolonged stagflation, a deep multi-year bear, or a regime in which utilities and infrastructure de-rate sharply. QQQM lacks ten-year data; PAVE and SGOV are post-2017 funds; only VOO and XLU carry the full decade of realized history. Volatility and correlation estimates over five years are noisy enough that small differences (XLU at 17.3% vs VOO at 16.8%) should be read as "comparable risk," not "XLU is meaningfully riskier." The data argues against the marketing claim that an AI-infrastructure tilt is defensive; it does not argue for any particular forward expectation.
Scenarios where each sleeve mix fits
- Long-horizon accumulator with stable income: a 90/10 split of VOO and SGOV is hard to beat on simplicity and cost. Theme tilts are optional decoration, not load-bearing.
- Investor explicitly comfortable with concentration: tilting the 90% toward QQQM captures the factor profile that drove the AI-era returns, with the explicit cost of deeper drawdowns. Size the position knowing a -35% drawdown happened inside the last five years.
- Investor who wants thematic exposure with cost discipline: XLU as a 5%–10% satellite inside the 90% is cheaper than PAVE and carries higher fund scale. Treat it honestly as an active sector bet, not as ballast.
- Pre-retiree: the 10% sleeve is insufficient for sequence-of-returns risk. Consider an explicit bond ladder or a larger short-duration allocation, separate from anything this template implies.
Editor's read
If forced to express the framework as a single build, the editor leans toward a clean 90/10 of VOO and SGOV, with any AI-infrastructure tilt sitting as a small satellite (5%–10% of the 90% sleeve) carved out of the broad equity allocation rather than out of the cash sleeve. The 44-basis-point expense gap between PAVE and VOO is unforgiving over a multi-decade horizon, and the realized volatility data does not support paying that premium for "defensiveness." Where a thematic tilt is genuinely wanted, XLU's lower cost and larger AUM make it the more defensible vehicle — framed honestly as an active sector bet rather than ballast.
The editor holds positions in VOO and SGOV as part of an in-house long-horizon framework at the time of writing, and does not hold XLU, PAVE, or QQQM.
Methodology
Price, return, and volatility series are from yfinance, pulled 2026-05-17 for the trailing 5-year window. Expense ratios, AUM, and inception dates are cross-checked against issuer fact sheets (Vanguard, State Street SPDRs, Invesco, iShares, Global X) as of the same date. Macro reference rates are from FRED: 10-year Treasury constant maturity (asof 2026-05-14), effective Fed funds rate (asof 2026-04-01), VIX close (asof 2026-05-14), and CPI year-over-year (asof 2026-04-01). Maximum drawdown is computed on daily total return.
For deeper background on the rebalancing-band logic referenced above, see the long-horizon infrastructure piece and common mistakes in infrastructure investing for implementation-side caveats.
This article is for educational purposes and does not constitute personalized financial advice. See full Disclaimer.