
The short version
- The "infrastructure" label hides three different factor bets: regulated utilities (XLU, VPU), broad cyclical infrastructure (IFRA), and concentrated industrial/grid exposure (PAVE, GRID).
- Five-year CAGRs span 9.0% to 18.5%, but that 9.5-percentage-point gap is mostly a single-regime artifact of the 2020–2025 capex cycle, not durable manager skill.
- Fit depends on whether the sleeve is doing yield-and-stability work or thematic-growth work. Mixing without naming the job is how portfolios drift.
Five tickers commonly show up when readers search "infrastructure ETF" — XLU, VPU, IFRA, PAVE, and GRID — and they get compared as if they are variants of the same thing. They are not. The category label conceals three very different factor exposures, and the five-year return rankings are mostly a story about which factors paid in this particular cycle. This article walks through what each fund actually holds, what the realized risk-and-return numbers say, and where the data has nothing useful to add.
Why "infrastructure" is a confusing label
Index providers stretch the word "infrastructure" to cover regulated electric and gas utilities, midstream energy, transportation REITs, materials, capital-goods manufacturers, and electrical equipment makers. Those groups have almost nothing in common as factor exposures. Utilities behave like long-duration bond proxies: rate-sensitive, low-beta, dividend-heavy. Capital-goods industrials behave cyclically: high beta to manufacturing PMIs, levered to non-residential construction. Grid-equipment names sit somewhere between thematic energy-transition and pure industrial cyclicals, with concentrated single-stock risk because the universe of pure-play smart-grid manufacturers is small.
Treating these as interchangeable is the first mistake. The data table below makes the differentiation visible.
The data, with sources
| Ticker | Focus | Expense ratio | AUM | Yield (TTM) | 5Y CAGR | 10Y CAGR | 5Y vol | 5Y max DD | Inception |
|---|---|---|---|---|---|---|---|---|---|
| XLU | Regulated U.S. utilities | 0.08% | $24.1B | 2.5% | 9.2% | 9.4% | 17.3% | −25.3% | 1998-12 |
| VPU | Broad U.S. utilities | 0.09% | $11.1B | 2.5% | 9.0% | 9.3% | 17.0% | −25.1% | 2004-04 |
| IFRA | Broad U.S. infrastructure (hybrid) | 0.30% | $4.1B | 1.6% | 12.8% | n/a | 18.0% | −19.9% | 2018-04 |
| PAVE | U.S. infrastructure development / construction | 0.47% | $13.4B | 0.8% | 16.4% | n/a | 21.6% | −26.2% | 2017-03 |
| GRID | Smart-grid / electrical equipment | 0.56% | $10.0B | 0.8% | 18.5% | 19.6% | 20.9% | −29.6% | 2009-11 |
Sources: prices and computed CAGR/volatility/drawdown from yfinance, window ending 2026-05-17. Expense ratios, AUM, distribution yield, and inception dates verified against issuer fact sheets — State Street SPDR (XLU), Vanguard (VPU), iShares (IFRA), Global X (PAVE), First Trust (GRID). AUM rounded to one decimal.
Reading the five-year ranking
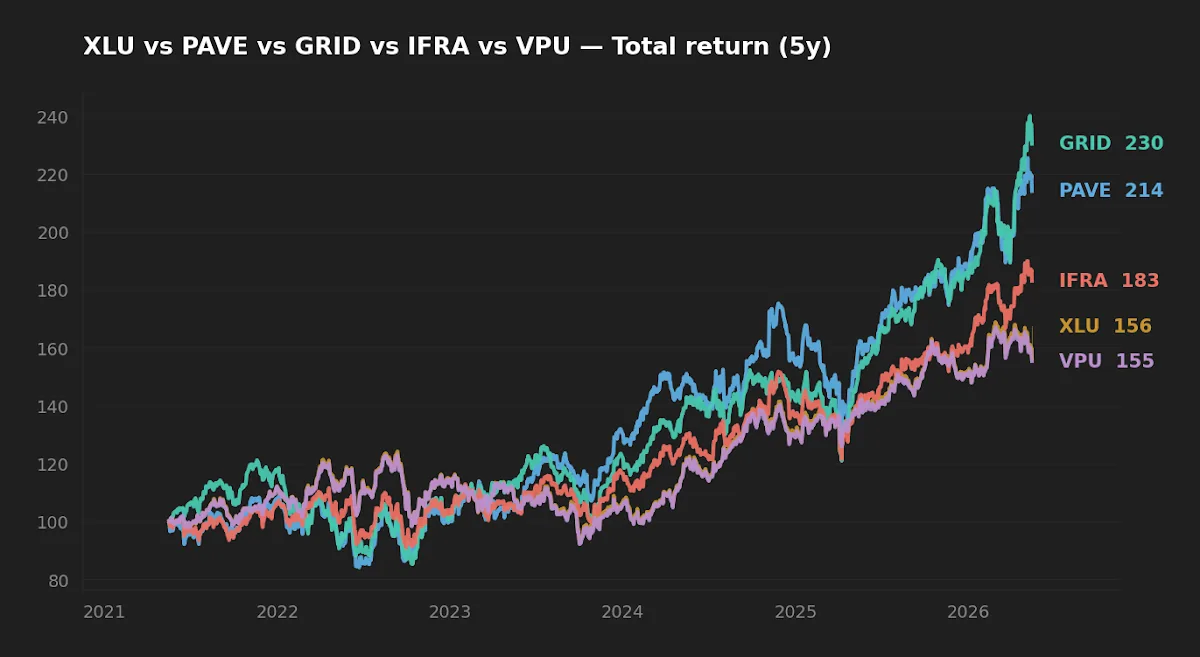
The point estimates sort cleanly from cyclical-light (VPU 9.0%, XLU 9.2%) through hybrid (IFRA 12.8%) to cyclical-heavy (PAVE 16.4%, GRID 18.5%). Initially the temptation is to call PAVE and GRID the "winners." A more honest reading is that the 2020–2025 window over-sampled exactly the regime those funds are built for: post-pandemic reshoring, the IRA and CHIPS-era construction wave, and a data-center buildout that pulled forward years of electrical-equipment demand. A 5-year CAGR computed on a single capex supercycle is not a free-standing estimate of forward returns. It is the realized payoff of a specific factor bet, conditional on a specific regime.
The same logic flatters and flatters again. Five years includes the 2022 utility drawdown driven by the 10-year Treasury moving from 1.5% to over 4%. At today's 10-year of 4.47% and Fed funds at 3.64% (FRED, asof 2026-05-14 and 2026-04-01), the rate-headwind on utilities is mostly priced in rather than starting. So utility 5Y CAGR understates a normalized expected return, while industrial-cyclical 5Y CAGR plausibly overstates it. The numbers move in opposite directions when you adjust for where in the rate-and-capex cycle the window started.
What the realized risk numbers add
Volatility separates the funds less than return does. XLU and VPU sit near 17% annualized; IFRA at 18%; PAVE and GRID near 21%. That is a meaningful but not enormous gap — utilities are not "low vol" in any absolute sense; they are low-vol relative to broad equity only because of dividend cushion and lower beta to growth shocks. The 2022 rate spike pushed XLU and VPU to roughly −25% drawdowns, slightly worse than IFRA's −19.9% and comparable to PAVE's −26.2%. The single deepest drawdown belongs to GRID at −29.6%, which is consistent with its concentrated electrical-equipment book and small effective universe.
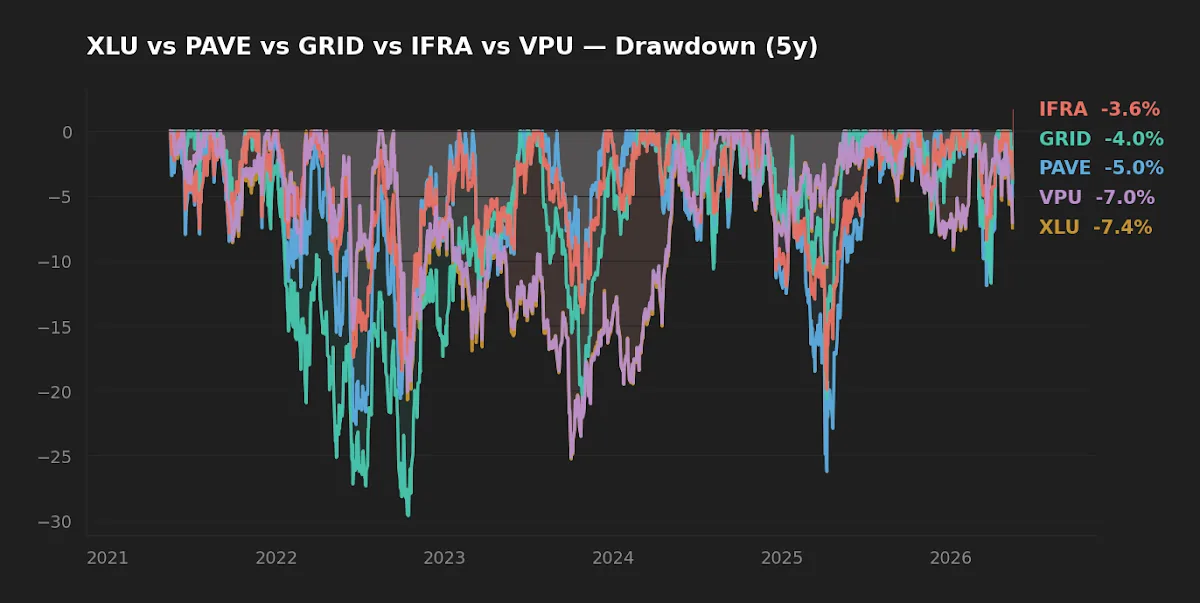
The drawdown shapes matter as much as the depths. IFRA's shallower trough reflects the hybrid construction — it carries enough utility and midstream weight to damp the cyclical names. PAVE and GRID drew down harder in narrative-driven episodes (rates, China industrial fears, clean-energy reversals) and recovered when capex headlines turned. A reader who would have sold either fund near the trough effectively realized a return very different from the CAGR line.
A 9.5-percentage-point CAGR spread across funds labeled "infrastructure" is not five funds competing at the same task. It is five different factor bets, ranked by which factor paid in this particular cycle.
Cost, capacity, and the small-fund tax
Expense ratios span 48 basis points from XLU (0.08%) to GRID (0.56%). At a 7% nominal long-run equity return, a 48 bp annual drag costs roughly 13% of terminal wealth over 30 years — not catastrophic, but not free either. The fee is paying for thematic indexing and access to a narrow universe; it is worth paying only if the thematic exposure is what the sleeve is for.

A subtler issue is capacity. IFRA at $4.1B and GRID at $10.0B are not tiny, but the universe of pure-play smart-grid manufacturers is small, and a fund that has tripled in AUM during a thematic rally faces non-trivial implementation friction. Bid-ask spread on the underlying single stocks rises with fund size when float is constrained. None of these funds are at obvious closure risk, but the smaller the eligible universe relative to AUM, the more the index methodology — quarterly rebalances, capacity caps, foreign-listing eligibility rules — drives realized tracking error. That is a cost the expense ratio does not capture.
For broader context on how AI-related electrical demand is shaping the infrastructure conversation, see Top ETFs for AI Infrastructure in 2026 (Utilities, Energy, Grid) and the underlying framework piece, The Complete Guide to AI Infrastructure Investing. For the income-vs-growth question across asset types, Data Center REITs vs. Infrastructure ETFs covers the cash-flow side.
Yield versus the risk-free alternative
With the 10-year Treasury at 4.47% (FRED, asof 2026-05-14), the utility yields of 2.5% (XLU, VPU) are no longer competitive on a pure-income basis. The case for utilities is now a total-return case — yield plus durable rate-base growth plus a bond-proxy hedge against equity drawdowns — not a yield-replacement case. PAVE (0.8%) and GRID (0.8%) are not income vehicles in any meaningful sense; their distributions are a byproduct, not a feature. IFRA's 1.6% sits in between and reflects the hybrid composition.
Scoreboard by job
| Category | Winner | Why |
|---|---|---|
| Cost | XLU (0.08%) | Lowest expense ratio by 1 bp over VPU, by 48 bp over GRID. |
| Realized 5Y return | GRID (18.5%) | Most exposed to the capex/AI buildout that dominated the window; not a forward forecast. |
| Realized risk (lowest drawdown) | IFRA (−19.9%) | Hybrid composition damped the 2022 rate shock and 2024 cyclical wobble. |
| Income suitability | XLU / VPU (~2.5%) | Only funds with a meaningful yield, though still below the 10Y Treasury. |
| Cleanest factor exposure | XLU or GRID | Each is closest to a single, recognizable factor; IFRA and PAVE blend exposures. |
Frequently asked questions
Are XLU and VPU effectively the same fund? Functionally close, not identical. XLU follows the S&P Utilities Select Sector index (about 30 names, market-cap weighted, S&P 500 only). VPU follows a broader MSCI U.S. utilities benchmark and holds roughly twice as many names, including smaller utilities outside the S&P 500. The realized 5Y CAGR gap of 20 bp is roughly what the methodology difference would predict. Pick on expense ratio (1 bp), platform access, or tax-lot considerations.
Is PAVE just a small-cap industrials fund in disguise? Largely yes. The fund tilts to mid-cap U.S. capital-goods and materials names tied to non-residential construction. That is a legitimate exposure, but readers should not mistake it for "infrastructure" in the sense of regulated cash flows. It will behave like a cyclical industrials fund in a recession.
Does GRID's 18.5% 5Y CAGR mean it is the best infrastructure ETF? Best by realized 5Y return in this window. Not best by expected forward return, not best by cost, not best by drawdown depth, and not best by capacity. A single-regime CAGR is the most flattering possible framing of a thematic fund.
How does inflation interact with these funds? Regulated utilities pass costs through with lags — they hedge inflation imperfectly. Capital-goods names (PAVE) often benefit from nominal-cost-of-construction pricing power. Smart-grid manufacturers (GRID) are mixed; component cost inflation can compress margins. CPI YoY at 3.95% (FRED, asof 2026-04-01) sits well above the Fed's target, which is part of why the 10-year is at 4.47%.
Can these replace a broad equity allocation? No. Each is a sector or thematic slice. Used as a satellite tilt around a broad-market core (e.g., a total-market or S&P 500 fund), they can shape factor exposure. Used as a core, they over-concentrate in one slice of the economy.
What this comparison can and can't tell you
The 5-year window covers one capex cycle, one rate-hike cycle, and one pandemic-driven supply-chain disruption. It does not cover a deep, sustained recession; it does not cover a multi-year rate-cutting regime; and it does not cover an episode where infrastructure spending policy reverses. PAVE and GRID have no 10-year history because both launched after 2017; their full-cycle behavior is genuinely unknown. The factor decompositions implied here (utility = duration proxy, PAVE = cyclical industrials, GRID = thematic concentrated) are from observed correlations, not from holdings-by-holdings regression. A holdings-level analysis would sharpen the picture but would not change the categorical conclusion.
Scenarios where each fund fits
- Reader in 50s, taxable account, looking for a yield-plus-defensive sleeve to pair with broad equity: XLU or VPU. The 1 bp ER gap is a coin-flip; pick the platform that minimizes spread and tax friction.
- Reader in 30s or 40s, tax-advantaged account, wanting one-line exposure to U.S. infrastructure without picking a sub-theme: IFRA is the hybrid. The expense ratio (0.30%) is the cost of not having to choose between utilities and industrials.
- Reader who already holds a broad-market core and wants a small thematic tilt toward the AI/grid buildout: GRID as a satellite, sized small (single-digit percentage of equity sleeve), with explicit acknowledgment that 18.5% CAGR is unlikely to repeat.
- Reader who wants cyclical-industrials exposure framed as "infrastructure": PAVE, recognized for what it is — a U.S. construction/capital-goods bet that will behave cyclically.
- Reader unsure which job the sleeve is doing: defer the purchase. Naming the job first prevents the most common mistake — holding a thematic fund and being surprised when it behaves thematically.
Editor's read
If forced to pick one for a long-term core that already includes a broad U.S. equity fund, the editor leans toward XLU as a defensive ballast — the 8 bp expense ratio is honest, the bond-proxy behavior is well-understood, and the yield is at least in the conversation with the 10-year. GRID is interesting precisely because of what makes it risky: small universe, concentrated thematic exposure, and a 5Y CAGR that almost certainly flatters the forward distribution. It would be a satellite at most. PAVE and IFRA are both defensible — the question is whether the reader wants the pure cyclical bet or the blended one. There is no "best" without a stated job.
Editor's holdings disclosure: The editor does not hold any of XLU, VPU, IFRA, PAVE, or GRID at the time of writing.
Key takeaways
- "Infrastructure" is not a single asset class. The five funds here represent at least three distinct factor exposures.
- The 5Y CAGR ranking (XLU 9.2%, VPU 9.0%, IFRA 12.8%, PAVE 16.4%, GRID 18.5%) is a faithful record of the past, not a forecast. The window over-samples a capex cycle that favored cyclical names.
- Cost matters: 48 bp separates the cheapest (XLU 0.08%) from the most expensive (GRID 0.56%), and that gap compounds.
- Realized drawdowns ranged from −19.9% (IFRA) to −29.6% (GRID). Volatility numbers alone hide the difference in drawdown shape.
- Decide the job first — yield-and-defense, broad cyclical exposure, or thematic tilt — and the choice of fund follows. The reverse order is how portfolios accumulate overlap.
Methodology
Price returns, annualized volatility, and maximum drawdown computed from daily adjusted closes via yfinance over the 5-year window ending 2026-05-17. 10-year and rolling CAGR computed where the inception date supports it (XLU, VPU, GRID); not reported where the fund history is shorter than the window (IFRA, PAVE). Expense ratios, AUM, distribution yields, and inception dates verified against the linked issuer fact sheets on the date of writing. Macro reference points sourced from FRED with as-of dates noted in-text. No holdings-level factor regression was run for this article.
This article is for educational purposes and does not constitute personalized financial advice. See full Disclaimer.