The short version
- The "AI infrastructure" label sits across three different ETF wrappers — utilities (XLU), industrial buildout (IFRA), and the consuming software layer (QQQM) — each with different realized risk and cost.
- On five years of data, XLU has not behaved like a low-volatility defensive: its annualized volatility (17.3%) is slightly higher than VOO's (16.8%) while its return is materially lower.
- Bottom line: a long-horizon equity core anchored in VOO does most of the work. A small AI-infrastructure tilt (XLU or IFRA) is a deliberate satellite decision, not a free lunch — and SGOV's 3.94% yield is now a real opportunity cost on cash sleeves.
The "AI infrastructure" thesis has migrated from semiconductors into the prosaic plumbing — regulated utilities, grid equipment, industrial REITs, and the short-duration cash that buys the optionality to add when valuations soften. The question this article tries to answer is narrower than the headline suggests: given a long-horizon equity core, what does the realized data actually say about layering XLU or IFRA alongside VOO and QQQM, and where does a cash sleeve like SGOV fit when front-end yields are this generous? The honest answer requires looking at five-year volatility, drawdowns, and fees together, not at narratives in isolation.
Context: three layers, three different ETF wrappers
A reader who lived through 2020–2025 watched the AI story move through distinct layers. Chips and the semiconductor complex came first. The asset-light software layer — the hyperscalers, the model builders, and their margins — came second. The third wave is the physical buildout: data centers, transmission, cooling, and the regulated utilities that supply power. Each wave has an ETF wrapper, and each wrapper carries different factor exposures and different costs.
XLU concentrates on U.S. regulated utilities. IFRA, from iShares, tilts toward industrial and materials names that build and maintain the grid. QQQM holds the asset-light layer that consumes the infrastructure. VOO is the broad benchmark all of this is measured against, and SGOV is patient capital — the dry powder, currently paying close to the 10-year Treasury yield while we wait.
For longer methodology on how a long-horizon equity sleeve interacts with satellite tilts, see The Master Guide to Evidence-Based ETF Portfolios. Readers newer to ETF allocation may find How to Start ETF Investing: The Complete 2026 Roadmap a more natural starting point.
The five funds at a glance
All figures below are pulled from yfinance on 2026-05-17. Expense ratios and AUM cross-checked against the issuer fact sheets. CAGR figures are trailing five-year total return except where noted; max drawdown is the deepest peak-to-trough close-to-close over the same window.
| Ticker | Name | ER | AUM | Yield | 5Y CAGR | 10Y CAGR | 5Y Vol | 5Y Max DD |
|---|---|---|---|---|---|---|---|---|
| VOO | Vanguard S&P 500 | 0.03% | $1,600.2B | 1.1% | 13.9% | 15.6% | 16.8% | -24.5% |
| QQQM | Invesco NASDAQ 100 | 0.15% | $82.9B | 0.5% | 17.6% | n/a | 22.3% | -35.0% |
| XLU | Utilities Select Sector SPDR | 0.08% | $24.1B | 2.5% | 9.2% | 9.4% | 17.3% | -25.3% |
| IFRA | iShares U.S. Infrastructure | 0.30% | $4.1B | 1.6% | 12.8% | n/a | 18.0% | -19.9% |
| SGOV | iShares 0-3 Month Treasury | 0.09% | $85.2B | 3.9% | 3.5% | n/a | 0.2% | -0.0% |
QQQM's 10-year column is blank because the share class only launched in October 2020; the underlying NASDAQ-100 index has a much longer history, but using it would mix backfilled index data with live fund returns, which inflates the apparent track record. The same applies to IFRA and SGOV. Where comparing live fund returns matters, the five-year window is the honest one.
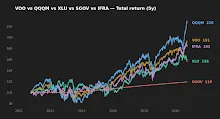
Realized risk: utilities did not behave defensively
The popular framing is that utilities are a low-volatility refuge — bond-like cash flows from regulated monopolies. The five-year data does not support that. XLU posted 17.3% annualized volatility against VOO's 16.8%, and its deepest drawdown (-25.3%) was actually worse than VOO's (-24.5%). For the volatility, an investor received a 9.2% five-year CAGR — roughly 470 basis points below VOO.
Part of this is the rate cycle. Utilities carry significant duration through their regulated rate bases and capital programs, and the 2022–2023 repricing of the curve hit the sector hard. Part of it is concentration: XLU's top five names are roughly half the fund. The "AI power surge" tailwind is real for specific names — those with data-center-adjacent generation and transmission — but the sector ETF holds them alongside slower-growing regulated utilities serving residential demand. Investors buying XLU as an "AI play" are getting a diluted version of the thesis.
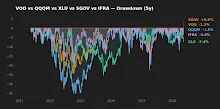
IFRA presents the more interesting picture in the drawdown chart. Its max drawdown of -19.9% is the shallowest equity figure in the set, despite delivering a 12.8% five-year CAGR — meaningfully ahead of XLU. The reason is the underlying construction: IFRA equal-weights a much broader basket of industrial, materials, transportation, and engineering names, which dampens any single sector's drawdown contribution. The trade-off is fee (0.30% versus XLU's 0.08%) and capacity. At $4.1B AUM, IFRA is the smallest fund in the table by a wide margin. Bid-ask spreads and closure risk deserve more attention than for the multi-hundred-billion-dollar funds above it.
XLU's five-year volatility was slightly higher than VOO's while its return was 470 basis points lower. Whatever utilities are for in this portfolio, "defensive equity" is not what the data calls them.
The cost stack and what it compounds to
Fees are the most predictable variable in this entire analysis. VOO at 0.03% and XLU at 0.08% are both low enough that the difference is not portfolio-determining. QQQM at 0.15% is reasonable for a megacap-growth wrapper. IFRA at 0.30% is the highest in the set, and over decades that gap matters: on a 25-year horizon at a 9% gross return, an extra 22 basis points of fee compounds to roughly 5.5% of terminal wealth. Not a disqualifier, but worth pricing.
The more interesting cost line in 2026 is the cash sleeve. With SGOV yielding 3.94% on a 0.09% fee, the opportunity cost of holding a non-yielding cash buffer is now material. For comparison, the 10-year Treasury sits at 4.47% (FRED, as of 2026-05-14) and the effective Fed Funds rate is 3.64% (FRED, as of 2026-04-01). A 5% cash sleeve at SGOV's yield contributes roughly 20 basis points to total portfolio yield per year — small in isolation, meaningful across a long holding period.
How to size an AI-infrastructure tilt without breaking the core
The framework the editor uses for sizing satellite tilts is borrowed from the rebalancing literature — Daryanani (2008) on opportunistic rebalancing bands and Vanguard's 2024 update on cost-benefit thresholds. Both arrive at the same practical conclusion: satellite positions below roughly 5% of the portfolio rarely justify the implementation friction and tax cost of maintaining them. So if AI infrastructure is going to be a tilt rather than a story, it needs to be sized to matter — typically 5–10% of equity — and rebalanced on bands rather than calendar dates.
A second non-obvious point: XLU and IFRA partially overlap with VOO. Utility names already sit inside the S&P 500 (XLU's holdings are an S&P 500 subset by construction), and many of IFRA's industrial names are in VOO as well. A 10% XLU tilt does not produce a 10% utilities overweight — it produces something closer to a 7–8% overweight after adjusting for the baseline 2–3% utilities allocation already present in VOO. The relevant question for sizing is the marginal exposure, not the gross position.
Scoreboard: winner by category
| Category | Winner | Reason |
|---|---|---|
| Cost | VOO (0.03%) | Lowest expense ratio; massive AUM minimizes spreads. |
| Realized 5Y return | QQQM (17.6%) | Highest CAGR, but paired with 22.3% vol and a -35% drawdown. |
| Realized 5Y risk-adjusted | VOO | Best return-per-unit-of-volatility among equity options in the set. |
| Shallowest equity drawdown | IFRA (-19.9%) | Broader equal-weighted basket dampened single-sector drawdowns. |
| Cash sleeve | SGOV | 3.94% yield with effectively zero rate or credit risk. |
FAQ
Is XLU a better defensive holding than bonds? The five-year data argues no — XLU's volatility and drawdown are equity-like. If the goal is true defensive ballast, short-duration Treasuries (SGOV) or intermediate Treasuries serve that role more honestly.
Why not just buy VOO and skip the sector tilts? That is a defensible answer. Most of the long-term return in this set comes from VOO, and adding satellites introduces tracking error against the benchmark you might otherwise compare yourself to. The case for a tilt rests on a specific thesis — that AI-driven power demand will persistently reprice utility and infrastructure cash flows — not on a generic diversification argument.
How does IFRA's small AUM affect a buy-and-hold investor? At $4.1B, IFRA is liquid enough for retail allocation but small enough that bid-ask spreads can widen during stress. Closure risk is non-zero — small thematic ETFs do get shut. The editor weights this against the broader exposure and the higher fee.
Is the 3.94% SGOV yield sustainable? SGOV's yield tracks the Fed Funds rate plus a small spread, minus the 0.09% fee. With Fed Funds at 3.64% (FRED, as of 2026-04-01), the trailing yield reflects the current rate environment. If the Fed cuts, SGOV's yield falls with it — within weeks, not years.
Should the AI-infrastructure tilt live inside or outside the equity core? The editor treats it as part of the equity sleeve. Sizing it from the bond or cash allocation conflates two decisions — equity exposure and within-equity tilt — and tends to drift the overall risk profile higher than intended.
What this comparison can and can't tell you
The five-year window covers exactly one rate-tightening cycle, one growth-stock drawdown, and one AI capex acceleration. It is a single regime. The relative performance of XLU versus QQQM versus VOO would look different across the 2000s, the 2010s, or the inflationary 1970s. The data here is informative about the present cycle, not about what these funds will do across the next thirty years. Survivorship and incepted-during-bull-market biases apply to QQQM, IFRA, and SGOV in particular — all three launched after 2018.
Scenarios where each fund fits
A reader in their 30s building a 401(k)-only long-horizon portfolio probably starts and ends with VOO and a modest QQQM tilt; AI infrastructure is too narrow a thesis to justify a satellite given the contribution constraints. A reader in their 50s with a taxable account, a defined need for current income, and concentration risk in the megacap-growth complex has a clearer case for adding XLU — the higher yield, the slight value tilt, and the reduced tech overlap all push the same direction. A reader actively building cash for a known liability in the next 2–3 years should size that liability in SGOV rather than equity ETFs of any kind.
Editor's read
The cleanest interpretation of the data is that VOO does the heavy lifting and the "AI infrastructure" label adds value mainly when implemented narrowly and sized to matter. If a tilt is going on, the editor leans IFRA over XLU on the five-year evidence — better drawdown profile, more honest exposure to the buildout thesis (industrials and materials, not just regulated utilities) — while pricing the higher fee and smaller AUM as real costs. SGOV at near-4% changes the math on cash buffers; an idle checking account is now measurably expensive.
The editor holds positions in broad-market U.S. equity and short-duration Treasury wrappers in the categories discussed here. The editor does not currently hold IFRA or XLU.
Key takeaways
- VOO's 0.03% fee and 13.9% five-year CAGR set a high bar for any satellite tilt to clear.
- XLU's five-year volatility (17.3%) and drawdown (-25.3%) do not justify the "defensive" label.
- IFRA shows the most attractive equity drawdown profile in the set, with the trade-off of a 0.30% fee and $4.1B AUM.
- SGOV's 3.94% yield against a 4.47% 10-year Treasury (FRED, 2026-05-14) makes cash sleeves a real contributor to portfolio yield.
- Satellite tilts below 5% of the portfolio rarely earn their implementation friction; size them deliberately or skip them.
Methodology
Price and total-return data: yfinance, pulled 2026-05-17. Expense ratios, AUM, and inception dates cross-checked against issuer fact sheets (Vanguard, Invesco, State Street, iShares). Macro figures: FRED — 10Y Treasury (DGS10) as of 2026-05-14, effective Fed Funds rate (FEDFUNDS) as of 2026-04-01, VIX as of 2026-05-14, CPI YoY (CPIAUCSL) as of 2026-04-01. CAGR computed over five-year close-to-close windows; volatility annualized from daily log returns; max drawdown measured peak-to-trough on cumulative total return. Inception-shortened CAGR figures are not reported beyond fund history.
This article is for educational purposes and does not constitute personalized financial advice. See Disclaimer.