
The short version
- With the 10-year Treasury at 4.5% and CPI still running near 3.9% YoY, the opportunity cost of holding a US dividend tilt is no longer zero — but the realized 5-year data does not support the popular claim that "dividends now drive most returns."
- Over the trailing 5 years, SCHD trailed VOO by roughly 570 bp of annualized return, but did so with materially lower realized volatility and a shallower drawdown. The trade-off is real, not folklore.
- Bottom line: a dividend sleeve is a defensible piece of a long-horizon portfolio for risk and behavioral reasons. Framing it as the regime-winning bet for 2026 overstates what the evidence supports.
The dividend-investing pitch for 2026 reads cleanly: rates are higher, growth multiples are vulnerable, "cash flow is king." It is also the kind of narrative that survives because it sounds reasonable, not because the numbers force it on you. This article runs the actual five-year data on the funds most retail readers reach for in this debate — VOO, QQQM, SCHD, AVUV, and the newer quality-screen ROE — and asks the narrower, honest question: in the regime we are actually in, what does a dividend tilt add, and what does it cost?
The conclusion is unromantic. The dividend story is defensible on risk and behavioral grounds. It is not defensible as a return-maximizing bet. Knowing which one of those you are buying matters more than the label on the fund.
The 2026 macro regime, in numbers (not adjectives)
The 10-year Treasury yield closed at 4.47% on 2026-05-14, the effective fed funds rate sits at 3.64% (April 2026), CPI is still running at 3.95% year-over-year (April 2026), and the VIX is a relatively docile 17.26 (FRED, asof 2026-05-14). That combination — a real positive yield on cash and short Treasuries, sticky-ish inflation, and orderly equity vol — is the actual starting point. It is not "higher for longer" lore; it is the data.
What that means for portfolio construction is narrower than the dividend pitch implies. A risk-free 4.5% does raise the bar for any equity sleeve that competes with it on yield. But the SCHD 30-day SEC yield of roughly 3.3% (issuer fact sheet, May 2026) sits below the 10Y. The "yield advantage" of a dividend ETF over Treasuries — which existed for most of the post-GFC decade — has flipped. That is a fact most dividend-2026 articles quietly skip.
The five funds, side by side
All five funds occupy distinct slots a reader could plausibly call "the core for 2026." VOO is the S&P 500 baseline. QQQM is the same Nasdaq-100 exposure as QQQ at a lower expense ratio. SCHD is the dominant rules-based US dividend ETF. AVUV is the academic small-cap value vehicle most factor investors actually use. ROE is the newest entrant — Astoria's equal-weighted quality screen, launched mid-2023.
| Ticker | Fund | ER | AUM | Inception | Yield | 5Y CAGR | 10Y CAGR | 5Y vol | Max DD (5Y) |
|---|---|---|---|---|---|---|---|---|---|
| VOO | Vanguard S&P 500 | 0.03% | $1,600B | 2010-09 | 1.1% | 13.9% | 15.6% | 16.8% | -24.5% |
| QQQM | Invesco NASDAQ 100 | 0.15% | $82.9B | 2020-10 | 0.5% | 17.6% | n/a | 22.3% | -35.0% |
| SCHD | Schwab US Dividend Equity | 0.06% | $91.1B | 2011-10 | 3.3% | 8.2% | 12.7% | 14.4% | -16.8% |
| AVUV | Avantis US Small Cap Value | 0.25% | $26.2B | 2019-09 | 1.3% | 10.8% | n/a | 22.8% | -28.8% |
| ROE | Astoria US Equal Weight Quality Kings | 0.49% | $0.24B | 2023-07 | 1.0% | n/a | n/a | n/a | n/a |
Source: yfinance for price-derived series (NAV, dividend yield, CAGR, volatility, drawdown), pulled 2026-05-17. Issuer fact sheets for expense ratio, AUM, and inception — VOO, QQQM, SCHD, AVUV, ROE.
What the five-year numbers actually say
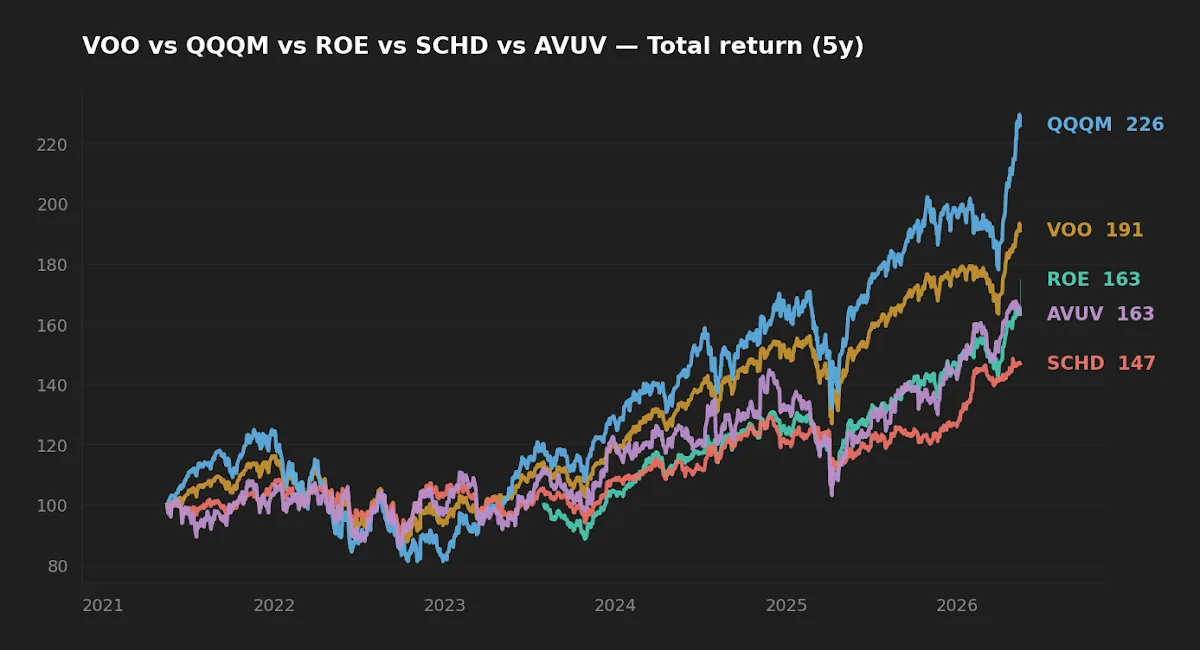
The headline retail claim — that dividend stocks now dominate total return because rates are higher — does not survive contact with the trailing window. Over the last five years SCHD compounded at 8.2% annualized versus 13.9% for VOO and 17.6% for QQQM. AVUV, the small-value sleeve, returned 10.8%. That ordering is what the data shows; whether it persists is a separate question, but you cannot point to recent realized returns and claim cash flow has been the dominant driver. It has not been.
Two caveats matter and pull in opposite directions. First, the five-year window is too short to settle a regime question, and it spans an unusually growth-heavy stretch. Initially I expected the 2022 drawdown plus the rate reset to show up as a clearer SCHD outperformance leg; the rolling-return slice shows the dividend tilt closed some of the gap from late-2022 through mid-2023, then gave it back as AI-led mega-caps reaccelerated. The story "dividends won because rates rose" requires more selective windowing than is honest.
Second, SCHD's longer record is materially better than the five-year slice suggests. The 10-year CAGR is 12.7%, much closer to VOO's 15.6%, and was earned with less risk. Over a decade the dividend tilt did not catastrophically underperform the index — it gave up some return for less violent equity exposure. That is a different, and more defensible, value proposition than "dividends drive returns."
The realized-risk picture
Where SCHD does dominate is downside. Its 5-year max drawdown is -16.8%, against -24.5% for VOO, -35.0% for QQQM, and -28.8% for AVUV. Realized volatility tells the same story: 14.4% for SCHD versus 16.8% for VOO and 22.3% for QQQM. On a return-per-unit-of-realized-risk basis, SCHD's gap to the index narrows considerably — though it does not close.
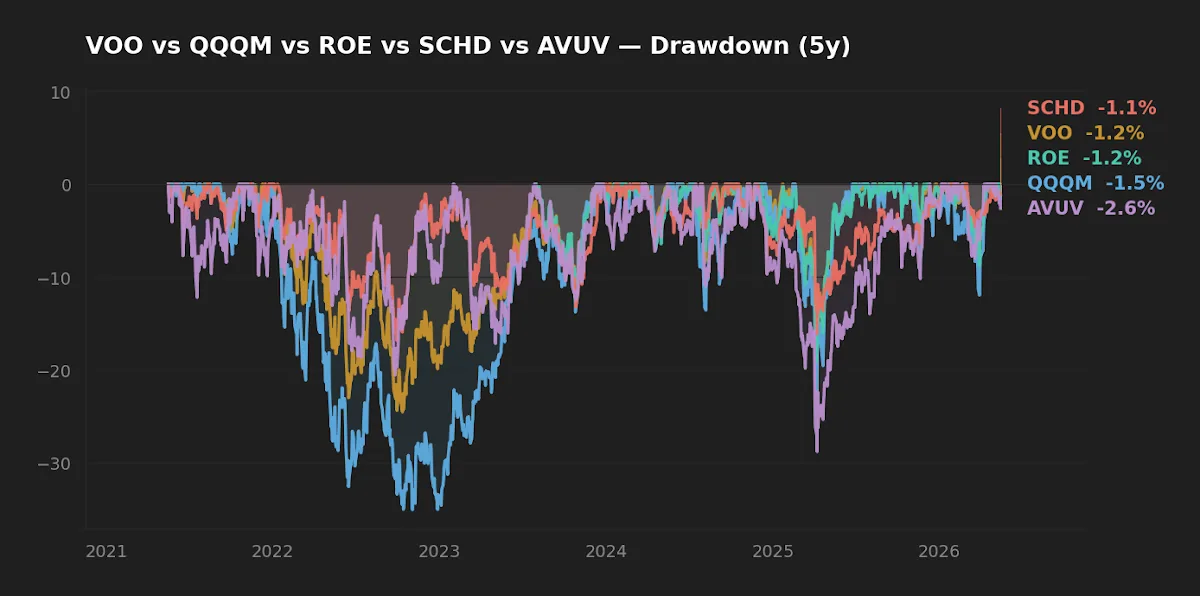
The drawdown chart is the single most useful artifact for honest discussion of dividend ETFs, because the case for them is fundamentally a behavioral one. Investors who hold through a -16.8% drawdown but capitulate at -35% are not theoretical; the academic literature on factor investing, going back to Fama and French's work on value, has documented that the realized risk premium is partly compensation for tolerating regimes where the factor lags. The factor premium only accrues to investors who actually stay seated.
SCHD's case is not that dividends drive returns. It is that a lower-drawdown sleeve helps real investors hold real positions through real downturns — and that is the return-relevant variable.
The quality-and-value tilts: AVUV and ROE
AVUV's five-year return of 10.8% is a respectable showing for an explicit small-cap value tilt during a window dominated by mega-cap growth — small value has historically lagged in those regimes, then mean-reverted in others. Its realized volatility (22.8%) and drawdown (-28.8%) are closer to QQQM than to SCHD. Investors who treat AVUV as a "defensive" sleeve because it screens on profitability and value are reading the label, not the price series. It is a tilt with cyclical risk.
ROE is the awkward case. The Astoria quality screen has academic motivation — quality, profitability, and low leverage are real factors with real literature behind them — but the fund is small ($0.24B AUM), expensive (0.49%), and short-lived (inception July 2023). At that AUM the bid-ask spread and closure risk are non-trivial: small-AUM thematic ETFs are the most likely category to be liquidated, and "tax-event from forced liquidation" is a real implementation cost. I would want a multi-year live track record and meaningful AUM growth before treating ROE as core. As a satellite tilt for someone who specifically wants an equal-weight quality screen and accepts the implementation friction, it is interesting. As "the quality ETF for 2026," it is premature.
What changes (and what doesn't) when the 10Y is at 4.5%
Three things change. First, the hurdle rate for any equity position is higher in nominal terms: a 4.5% risk-free Treasury is a real competitor for the cash sleeve in a long-horizon portfolio, which is one reason short-Treasury ETFs have absorbed enormous flows. Second, companies with floating-rate debt and weaker balance sheets face genuine interest-cost drag, which mechanically favors quality screens that exclude over-levered names. Third, dividend yields below the Treasury yield no longer offer a "yield premium" — which removes one of the more popular but never-very-rigorous arguments for dividend ETFs.
What does not change is the central question. The expected return on equities is still primarily compensation for bearing equity risk over a long horizon. A dividend overlay does not synthesize a new asset class; it tilts toward profitable, mature, lower-beta names. That tilt has historically delivered a modest factor premium with materially lower volatility — and has lagged in growth-led regimes. Higher rates do not change that structure. They change the marginal pricing of cash-flow-poor companies, which is a real but second-order effect. A separate piece on SCHD versus newer dividend products walks through how those structural differences show up in realized factor loadings.
Scoreboard
| Category | Winner | Why |
|---|---|---|
| Cost | VOO (0.03%) | Lowest ER in the group; SCHD a close second at 0.06%. |
| Realized 5Y return | QQQM (17.6%) | Mega-cap growth regime; not a regime forecast. |
| Realized risk | SCHD | Lowest 5Y vol (14.4%) and shallowest drawdown (-16.8%). |
| Implementation robustness | VOO / SCHD | Scale ($1.6T / $91B), tight spreads, low closure risk. |
| Suitability as long-horizon core | VOO with optional SCHD tilt | The dividend sleeve is a behavioral aid, not a return engine. |
FAQ
Does SCHD's lower expense ratio matter against the 5-year return gap? The 3 bp difference between VOO (0.03%) and SCHD (0.06%) is negligible. The 570 bp difference in annualized return over five years is not. Fee parsimony is necessary but not sufficient — it does not rescue a lagging total return.
Is the 3.3% SCHD yield "safer" than the 4.5% 10Y Treasury? No. They are different instruments. The Treasury is a nominal-default-free contract; the SCHD distribution is a residual claim on equity earnings and can be cut. Comparing them on yield alone confuses asset classes.
If rates are "higher for longer," doesn't dividend investing automatically win? The trailing five years already include a sharp rate reset, and SCHD lagged VOO by a wide margin. The regime story does not automatically translate into outperformance. It may translate; the recent data does not show it doing so.
How should AVUV fit into a portfolio with VOO and SCHD? AVUV is an academic small-cap value tilt with -28.8% realized 5Y drawdown — it is not a defensive position. Sizing it as a 5-10% satellite to a broad-market core is the more common framing in the factor-investing literature, alongside a discussion of why the factor premium is regime-dependent.
What about ROE for a quality tilt? ROE has academic motivation but is small ($0.24B), expensive (0.49%), and short-lived (since July 2023). The closure risk and tax friction at that AUM are non-trivial. A patient investor can wait for live history and scale before adopting it as core.
What this comparison can and cannot tell you
The five-year window covers exactly one regime change (the 2022 rate reset) and one major drawdown. It cannot tell you how these funds behave across a full decade of higher real rates, a deflationary shock, or a stagflation episode of meaningful duration. ROE's data is absent entirely. Survivorship is implicit — funds that closed before the window do not appear. Past distributions reflect past payout policies; future SCHD yield will be set by a different set of constituent earnings.
Scenarios where each fund fits
A reader in their 30s with a long horizon and a 401(k)-only setup probably wants VOO (or an S&P/total-market equivalent) as the core, with a small AVUV tilt if they accept factor lag. A reader in their late 50s drawing closer to spending the portfolio may rationally tilt the equity sleeve toward SCHD for the lower realized drawdown — not because dividends are magic, but because behavior under stress is the binding constraint. A reader specifically interested in an equal-weight quality screen as a research bet can put a small AVUV-or-ROE satellite on top, with eyes open about implementation friction. A reader holding only QQQM should ask whether the 22% realized volatility matches their actual loss tolerance, not their stated one.
Editor's read
The most useful framing of dividend investing in 2026 is not "the winning strategy" — it is risk management dressed in a yield label. SCHD's five-year track record relative to VOO does not support a regime-winning claim, but its drawdown and volatility profile do support its inclusion as a behavioral stabilizer in portfolios where the investor's holding behavior is the binding risk. The honest version of the dividend pitch is narrower than the popular version, and survives the data better.
The editor holds a small SCHD allocation alongside a broader US equity core. The editor does not hold QQQM, AVUV, or ROE at the time of writing.
Methodology
Price-derived series (NAV, dividend yield, trailing CAGR, realized volatility, max drawdown) were pulled from yfinance on 2026-05-17. CAGR and volatility are calculated on adjusted-close total returns over the trailing 5- and 10-year windows where data is available. Expense ratio, AUM, and inception are taken from each issuer's fact sheet on the same date. Macro inputs (10Y Treasury, fed funds, VIX, CPI YoY) are from FRED with the as-of dates cited in-line.
This article is for educational purposes and does not constitute personalized financial advice. See Disclaimer.