
The short version
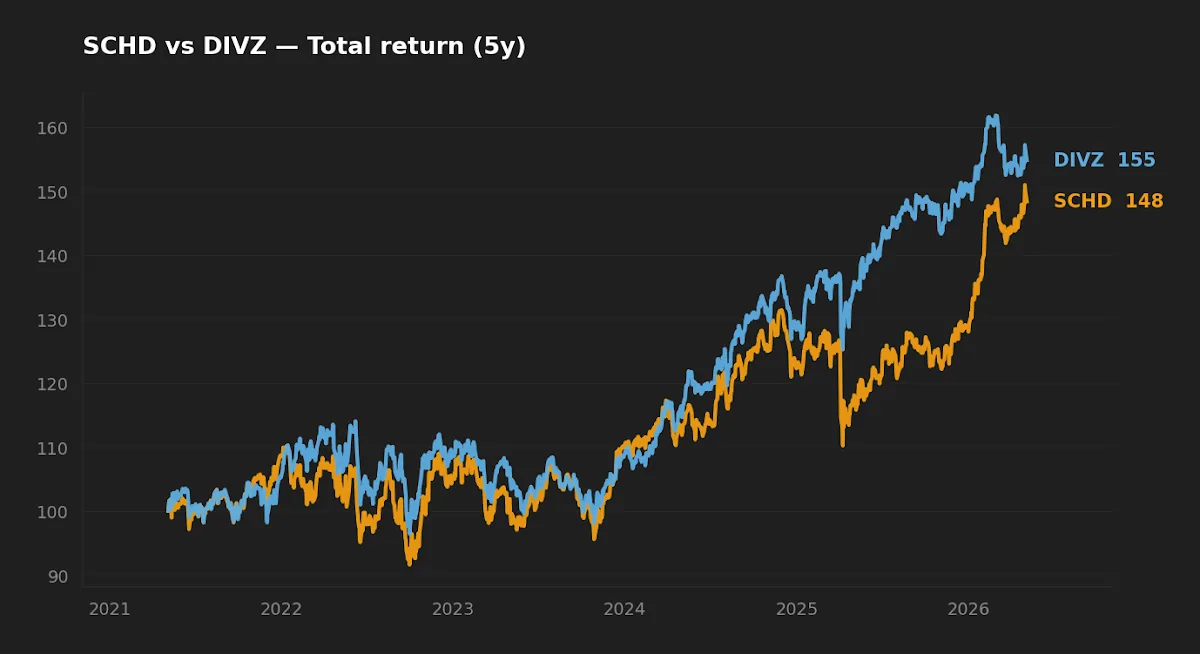
- Over the trailing five years DIVZ outpaced SCHD by roughly 90 bp per year on total return, with lower realized volatility — but at roughly ten times the expense ratio.
- SCHD pays meaningfully more current income (3.4% vs 2.7%) and has 14 years of live data covering multiple regimes; DIVZ's track record is one regime long.
- Bottom line: SCHD is the cleaner long-horizon core; DIVZ is interesting only as a small satellite for an investor who already owns broad exposure and specifically wants quality-defensive concentration.
Over the trailing five years, the Polen Dividend Income ETF (DIVZ) compounded at 9.6% per year against 8.7% for the Schwab U.S. Dividend Equity ETF (SCHD). On the surface that looks like a clean point for the concentrated active strategy. Then the expense ratios enter — 0.06% for SCHD against 0.65% for DIVZ — and the question becomes whether 90 basis points of gross outperformance, drawn from a single regime, is enough evidence to keep paying ten times the management fee for the next twenty years.
The original framing of DIVZ as an "AI-enhanced yield strategy" deserves a quick correction before going further. DIVZ is a discretionary active product run by Polen Capital — a 25-to-35-name portfolio chosen by human portfolio managers, not an algorithmic factor model. The honest comparison is rules-based passive against concentrated discretionary management, and that is what this piece works through.
Two different ways to build a dividend portfolio
SCHD tracks the Dow Jones U.S. Dividend 100 Index, a methodology that is publicly documented and entirely mechanical. A constituent must have paid dividends for at least ten consecutive years, must clear minimum float-adjusted market-cap and liquidity thresholds, and is then ranked on a composite of cash-flow-to-total-debt, return on equity, indicated dividend yield, and five-year dividend growth. The top 100 names are weighted by modified market cap with a 4% per-name and 25% per-sector cap at rebalance. Reconstitution is annual, rebalancing quarterly, no discretionary overlay.
DIVZ inverts almost every part of that process. Launched in January 2021 and now operated under Polen Capital, it holds 25 to 35 large- and mid-cap U.S. dividend payers selected qualitatively by the managers, with an explicit avoidance of the highest-yielding tail where payout coverage is suspect. The defensive tilt is structural rather than tactical: the fund is built to look more like a low-volatility quality sleeve than a yield maximizer.
So the comparison is structural before it is empirical. SCHD delivers a yield-and-quality factor by rule for 6 basis points. DIVZ asks you to pay 65 basis points for a portfolio shaped by manager conviction. Whether that trade pays is a question about what the manager has done with the discretion, evaluated across regimes long enough for the variance to settle — and the live record is short.
The numbers
The table below summarizes current fund data. Expense ratios, AUM, and inception dates are from each issuer's fund page; trailing return, realized volatility, and maximum drawdown are computed from total-return data over the trailing five-year window ending early May 2026 (yfinance).
| Metric | SCHD | DIVZ |
|---|---|---|
| Issuer | Schwab Asset Management | Polen Capital |
| Inception | 2011-10-20 | 2021-01-27 |
| Expense ratio | 0.06% | 0.65% |
| AUM | $84.8B | $0.2B |
| Distribution yield (TTM) | 3.4% | 2.7% |
| 5Y total-return CAGR | 8.7% | 9.6% |
| 10Y total-return CAGR | 12.6% | n/a (under 5y of history) |
| 5Y realized volatility (annualized) | 14.4% | 12.6% |
| 5Y maximum drawdown | -16.8% | -15.4% |
| Approximate holdings | ~100 | ~25–35 |
| Strategy | Passive, rules-based index | Active, concentrated |
Sources: Schwab SCHD fund page; Polen Capital DIVZ fund page. Trailing-return and risk metrics computed from total-return price data through 2026-05-04.
Construction: the funds diverge on a single decision
Both strategies start from broadly the same universe — large- and mid-cap U.S. dividend-paying equities — and diverge on a single question: whether to let a screen pick names or let a manager pick them. SCHD's index sets a hard floor (ten years of consecutive dividends) and ranks survivors on four objective factors. DIVZ applies similar quality criteria as a starting filter, but the final 25–35 names are chosen on qualitative grounds.
The mechanical consequence is portfolio breadth. SCHD spreads $84.8B across roughly 100 names with a 4% single-name cap. DIVZ runs about a third of those positions, so single-stock weights are larger and single-stock outcomes carry more weight in the fund's return. A 4% position that suffers a 30% drawdown costs DIVZ about 1.2 percentage points of NAV; the same event in SCHD barely registers above noise. This is the second-order effect that the headline 5Y CAGR doesn't reveal: the active fund's return distribution has fatter tails on both sides, even though its realized volatility currently looks calmer.
The fee gap, applied to a real allocation
The 0.59-percentage-point fee differential is the active manager's hurdle rate. Every year, in expectation, DIVZ must outperform SCHD by 0.59 points before fees just to deliver the same net result. That is a low bar in any single year and a much higher one across decades.
A concrete illustration: an investor allocating $50,000 to a dividend sleeve, with a 7% gross return assumption sustained over 20 years, ends with roughly $191,000 in SCHD versus $171,000 in DIVZ if the two funds achieve the same gross return. The roughly $20,000 gap is the compounded fee differential alone, before any return advantage or shortfall on the manager's side. This is what Bogle's arithmetic-of-active-management point actually looks like when you put numbers on it. For DIVZ to break even net of fees, its gross return must beat SCHD's gross return by 0.59 points per year on average — sustained across regimes, not just within the post-2021 sample.
For DIVZ to break even net of fees, its gross return must beat SCHD's gross return by 0.59 points per year on average — sustained across regimes, not just within the post-2021 sample.
Realized risk: lower variance for DIVZ, with a sample-size caveat
Across the trailing five years DIVZ posted lower annualized volatility (12.6% versus 14.4%) and a slightly shallower maximum drawdown (-15.4% versus -16.8%). Both differences are consistent with the fund's stated defensive tilt — a tighter portfolio of lower-beta quality names should, all else equal, exhibit less daily variance than a 100-stock yield-and-quality screen carrying more cyclical exposure.
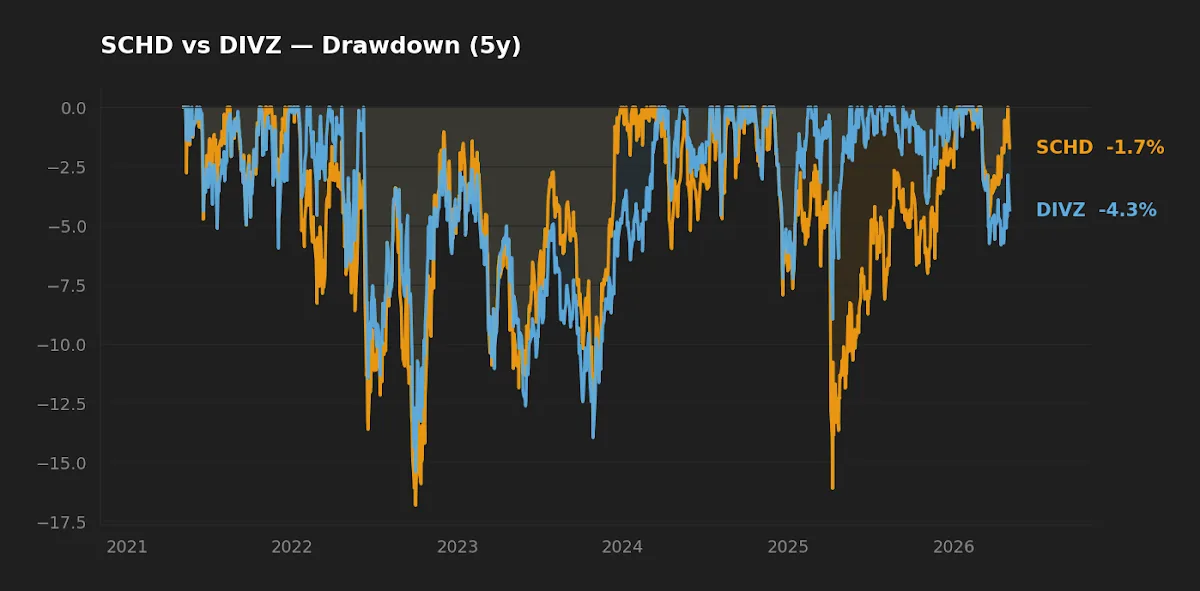
The caveat is sample size. DIVZ has lived through one major drawdown (the 2022 rate-shock equity decline) and one extended recovery. SCHD's 14-plus-year history covers the 2015–2016 commodity selloff, the 2018 Q4 drop, the 2020 COVID shock, and the 2022 bond-equity correlation event. Inferring a steady-state volatility advantage from a single regime is the kind of overfitting that backtest discipline is supposed to discourage. The risk gap is real in the data we have; whether it persists is a separate question. With the VIX at 16.99 (FRED, asof 2026-05-01), we are not currently in a regime that would stress-test either fund.
Income profile: SCHD is closer to a yield product
The 3.4% versus 2.7% distribution-yield gap is structural rather than transient. SCHD's index includes indicated dividend yield as one of four ranking factors, which surfaces higher-yielding qualifying names. DIVZ deliberately excludes the highest-yielding tail where payout sustainability is suspect, which caps the headline distribution rate.
For an investor in the withdrawal phase the 70 bp yield difference matters more than a marginal advantage in total-return CAGR over a short window. Worth noting against the macro backdrop: the 10-year Treasury yields 4.39% (FRED, asof 2026-05-01), so neither fund is competitive with risk-free income on yield alone — both are owned for the equity total return, with the dividend as a structured way of receiving part of it. Some prior pieces here on SCHD and dividend discipline and the SCHD vs VIG factor comparison dig deeper into how the index methodology shapes the distribution profile.
At-a-glance scoreboard
| Category | Winner | Margin |
|---|---|---|
| Cost | SCHD | Material — 59 bp/yr |
| Realized risk (5Y) | DIVZ | Modest, single regime |
| Realized return (5Y, gross) | DIVZ | Marginal — 90 bp/yr |
| Realized return (net of fees) | DIVZ | ~30 bp/yr — within noise |
| Current income | SCHD | 70 bp distribution yield |
| Track record breadth | SCHD | 14 years vs ~5 years |
| Suitability for long-term core | SCHD | Strong |
What this comparison can and can't tell you
The five-year window covers exactly one macro regime: post-COVID recovery, the 2022 inflation and rate shock, and the subsequent partial normalization. We do not have DIVZ data for 2008, 2011, 2015–16, 2018 Q4, or COVID March 2020 — every credit-driven and liquidity-driven stress event of the last two decades. The 12.6% realized volatility and -15.4% drawdown are honest data points, but they are drawn from a sample that does not contain the kinds of events that historically separate good active dividend funds from bad ones. Treat any 2026 verdict on DIVZ as provisional.
Scenarios where each fund fits
- Reader in their 30s, 401(k)-only, no current dividend exposure. SCHD as a 5–15% tilt for the value-and-quality factor exposure is reasonable. Full DIVZ allocation is hard to justify given the fee compounding over a 30-year horizon.
- Reader in their 60s drawing portfolio income. SCHD's higher distribution yield and longer track record make it the cleaner choice for an income sleeve. DIVZ's lower yield works against the use case.
- Reader who already holds VOO/VTI as core, wants a small concentrated quality-defensive satellite. A 3–5% DIVZ position is defensible if the explicit avoidance of high-yield-thin-coverage names matches the investor's preference. Size it knowing the fee drag.
- Korean-based investor in a KRW account. Distribution-yield differences are smaller after withholding tax (15% U.S. withholding on dividends), which compresses one of SCHD's structural advantages. The fee gap is unaffected.
Editor's read
If forced to pick one for the long-term core sleeve, I lean toward SCHD: the 59 bp fee gap is unforgiving over decades, the rules-based screen has 14 years of live data across multiple regimes, and the higher current yield is a real benefit for any reader who eventually uses the holding for income. DIVZ is interesting as a small satellite for an investor who already owns broad market exposure and specifically wants concentrated quality-defensive exposure with explicit valuation discipline — but I would size it small and treat the live track record as provisional until it has been through a credit-driven downturn.
Editor's holdings disclosure: the editor holds SCHD as part of a long-term dividend sleeve; does not hold DIVZ.
Frequently asked questions
Is DIVZ's lower realized volatility worth the 0.65% expense ratio?
It depends on whether the volatility gap persists out of sample. Over the live window DIVZ ran roughly 1.8 percentage points below SCHD on annualized volatility. If that holds, you are paying 59 basis points for a structurally calmer ride. If the gap compresses — common when small samples extend — the fee math gets harder. Either way, 12.6% volatility is still equity-like; DIVZ is not a substitute for fixed income.
Can SCHD and DIVZ be held together?
Mechanically yes, but the diversification benefit is limited. Both target U.S. dividend payers with a quality bias and their factor exposures overlap heavily. Holding both is closer to over-allocating to one factor than to genuine diversification. An investor wanting more defensive exposure on top of SCHD usually gets more from a low-volatility ETF, an international dividend fund, or fixed income than from a second U.S. dividend fund.
Why is DIVZ's yield lower than SCHD's even though it is positioned for income?
DIVZ targets dividend quality and sustainability rather than headline yield, and its mandate explicitly avoids the highest-yielding tail where payout coverage is thin. SCHD's index, by including a yield component in its composite score, surfaces higher-yielding qualifying names and lifts the headline distribution. Same broad universe, different treatment of the yield tail.
Does DIVZ's small AUM matter?
$0.2B in AUM is small by ETF standards. Two practical implications: bid-ask spreads can be wider than for SCHD (which raises trading costs for frequent rebalancers), and small ETFs occasionally close if assets do not grow, forcing investors to sell at an inconvenient moment. Neither risk is acute today, but both are non-trivial considerations for a holding meant to anchor an income sleeve for years.
How does SCHD compare to a total-market fund for a long-term holder?
SCHD's 10-year total-return CAGR of 12.6% has been competitive with broad U.S. market funds, but the sources of return differ. SCHD captures a value-and-quality factor tilt and underweights mega-cap technology. In any single year the gap against a total-market index can be wide in either direction. Over a multi-decade horizon the more useful question is whether you want a factor tilt at all — see the VOO/QQQM/SCHD core-portfolio piece for that framing.
Key takeaways
- Cost is the cleanest differentiator. SCHD's 0.06% expense ratio is roughly one-tenth of DIVZ's 0.65%. Across multi-decade horizons that gap compounds into a meaningful difference in terminal wealth, before any judgment on manager skill.
- DIVZ has been less volatile and slightly less drawdown-prone over the trailing five years, but the track record covers a single macro regime. Treat the risk advantage as provisional.
- SCHD distributes more current income (3.4% vs 2.7%), which matters for portfolios in the withdrawal phase. DIVZ behaves more like a low-volatility quality sleeve that pays dividends than like a yield product.
- Factor exposure overlaps heavily. Holding both funds together provides less diversification than holding either alongside a different asset class or geography.
- The honest verdict on DIVZ requires more time. Five years of live data, all in one regime, is not enough to declare the fee worth paying — but it is enough to keep the fund on a watchlist.
How we built this comparison: expense ratios, AUM, inception dates, and strategy descriptions are from each issuer's official fund page (Schwab Asset Management for SCHD; Polen Capital for DIVZ), accessed 2026-05-04. Trailing 5Y and 10Y CAGR, annualized realized volatility, and maximum drawdown are computed from yfinance total-return price data through 2026-05-04. Macro context (10Y Treasury, VIX) sourced from FRED, asof 2026-05-01.
This article is for educational purposes and does not constitute personalized financial advice. See full Disclaimer.
— by the Mulden editor