
The short version
- QQQM produced the highest five-year CAGR (17.6%), but at 22.3% realized volatility and a −35.0% drawdown — a single-regime number, not a permanent ranking.
- SCHD compounded at 8.2% over five years but 12.7% over ten, with the lowest volatility (14.4%) and shallowest drawdown (−16.8%) of the three.
- The right question is not which fund wins; it is which mix of factor exposures keeps a real investor contributing through eighteen months of stress.
A reader recently asked the question this article tries to answer: if a long-term core can hold three US equity ETFs, should they be VOO, QQQM, and SCHD — and in what proportion? It is the right question because it forces the discussion away from "which fund is best" and toward what the three funds actually do together. The honest answer depends less on five-year performance leaderboards than on factor exposure, realized risk, and how each fund behaves in the drawdowns that test investor discipline.
For readers unfamiliar with the lineup: VOO tracks the S&P 500 (large-cap US, market-cap weighted). QQQM tracks the Nasdaq-100 (the 100 largest non-financial Nasdaq names, heavily tech-tilted). SCHD tracks the Dow Jones U.S. Dividend 100 Index, a rules-based screen for sustainable dividend payers with high return on equity and a ten-year history of growing distributions. All three are large, liquid, and inexpensive — but their factor loadings differ substantially, and that is the point.
The data, as of 2026-05-18
| Ticker | Expense ratio | AUM | Trailing yield | 5Y CAGR | 10Y CAGR | 5Y vol | 5Y max drawdown |
|---|---|---|---|---|---|---|---|
| VOO | 0.03% | $1,600B | 1.1% | 13.9% | 15.6% | 16.8% | −24.5% |
| QQQM | 0.15% | $82.9B | 0.5% | 17.6% | n/a* | 22.3% | −35.0% |
| SCHD | 0.06% | $91.1B | 3.3% | 8.2% | 12.7% | 14.4% | −16.8% |
Source: price and total-return series computed from yfinance daily closes pulled 2026-05-18; expense ratios and AUM from issuer fact sheets — Vanguard (VOO), Invesco (QQQM), Schwab (SCHD). *QQQM launched 2020-10-13 and therefore lacks a ten-year track record.
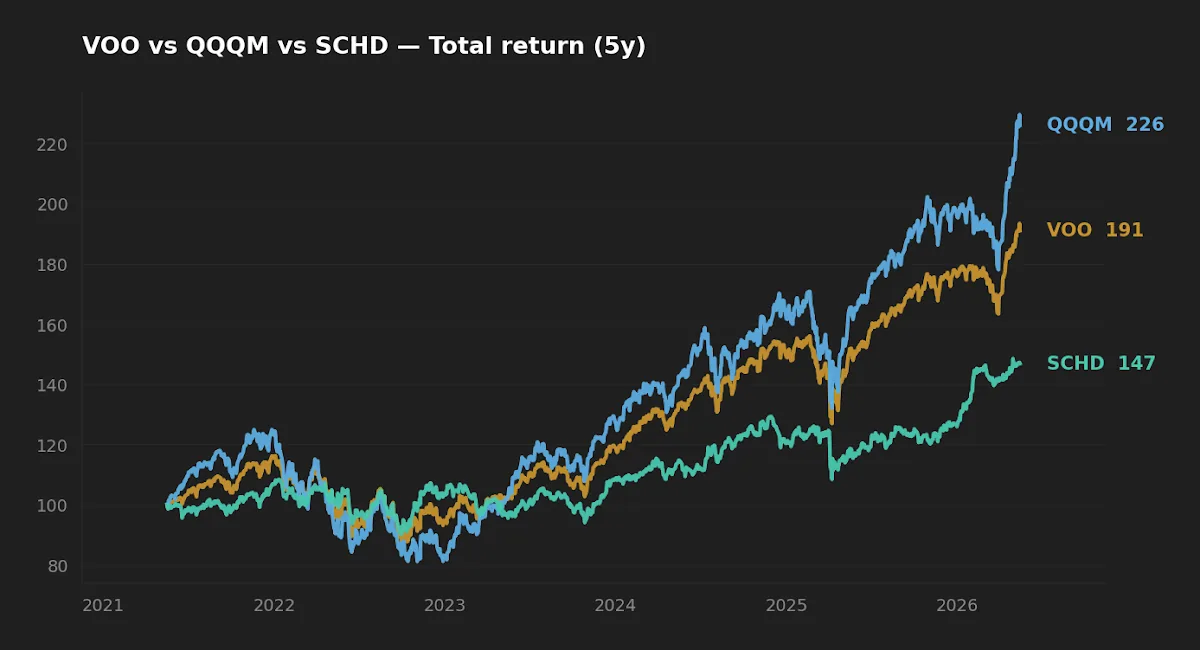
What the factor exposures actually capture
The temptation with cost-and-CAGR tables is to read them as a ranking. They are not. Each fund is a different bet on which equity factors will be rewarded.
VOO is the closest thing to pure US-market beta: roughly 500 names, weighted by float-adjusted market cap, with sector weights that drift toward whatever is winning. The top ten holdings sit near 35% of the index — a level of concentration that reflects mega-cap technology rather than active conviction. The 13.9% five-year CAGR is, broadly, the US equity-risk premium for this regime.
QQQM is a sector bet dressed as a broad index. By construction it excludes financials and is heavily tilted toward information technology and communication services. The 17.6% five-year CAGR and the 22.3% realized volatility both come from the same source: outsized factor loadings on size (the index excludes small companies entirely) and on quality and growth as expressed in the largest US technology balance sheets. The −35.0% drawdown in late 2022 is what that exposure costs in the wrong regime.

SCHD is the most interesting case because its factor profile is non-obvious. The Dow Jones U.S. Dividend 100 screens for cash-flow-to-debt, ROE, dividend yield, and five-year dividend growth, then weights by yield. The result is a portfolio that loads on quality and value, underweights technology, and overweights consumer staples, financials, and healthcare. The 14.4% five-year volatility is genuinely lower than VOO — a 240 basis-point gap that compounds in the investor's behavioral favor during drawdowns.
Initially the editor read the 8.2% five-year CAGR as a punchline against SCHD. Then the window extended to ten years, where SCHD compounded at 12.7% — within shouting distance of VOO over a period that included both the 2022 value drawdown and the 2020–2021 growth surge that ran hard against value and yield. The five-year-versus-ten-year gap is not a permanent indictment of the methodology; it is a snapshot of one factor cycle.
Realized risk: what the drawdowns tell us
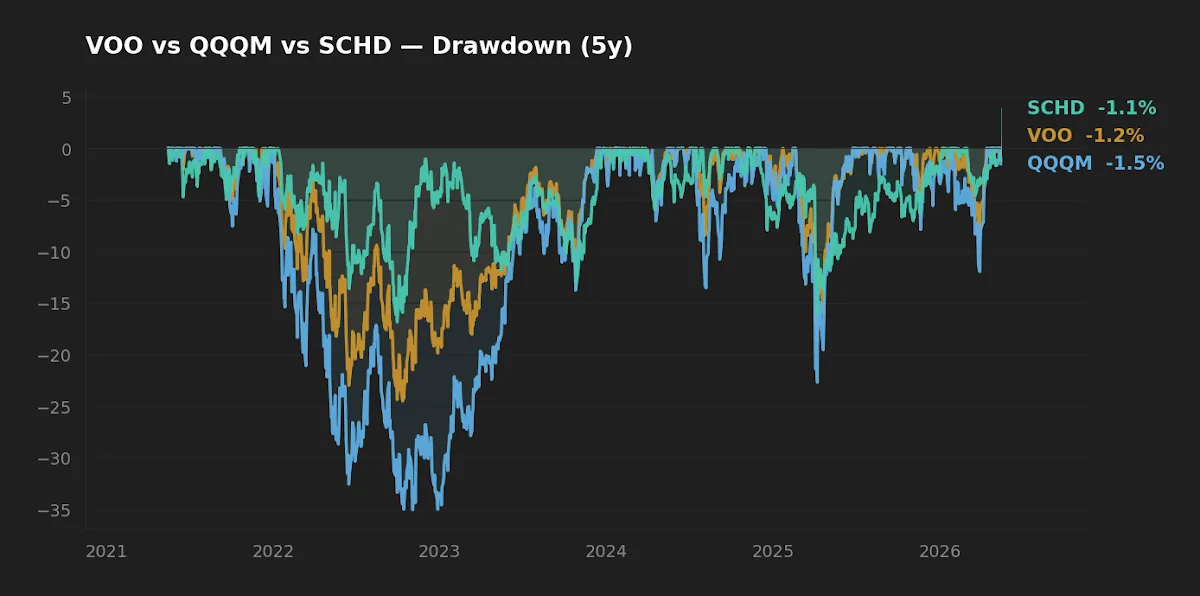
The drawdown chart is the most useful single image in this analysis, because it shows how each fund behaves when the investor is most likely to make a mistake. QQQM lost roughly a third of its value peak-to-trough in 2022 and took several quarters to recover. VOO drew down about −24.5% over a comparable window. SCHD held at −16.8%, less than half the magnitude of QQQM, and recovered faster.
Drawdown duration matters as much as drawdown depth. A 30% drawdown that recovers in six months tests patience; the same drawdown that lingers for eighteen months tests conviction. For a long-horizon investor the relevant question is not "could I tolerate a −35% paper loss in the abstract" but "would I still be contributing on schedule eighteen months into one." The behavioral case for SCHD inside a core is less about its return number and more about the size of the gap between expected drawdown and the drawdown an investor will actually sit through.
The relevant comparison is not which fund has the highest five-year CAGR, but which combination keeps the investor contributing on schedule eighteen months into a drawdown.
The macro regime: why context matters in 2026
The current macro setup tightens the analysis. The 10-year Treasury sits at 4.47%, the Fed funds rate at 3.64%, headline CPI year-over-year near 3.9%, and the VIX at 17.26 (FRED, asof 2026-05-14 and 2026-04-01). In plain terms: the risk-free rate is competitive with SCHD's 3.3% trailing yield on a pre-tax basis, and the discount rate on long-duration growth cash flows is materially higher than it was through most of the QQQM five-year window.
This does not mean QQQM is uninvestable or that SCHD's relative-yield argument is gone — SCHD's distribution is largely qualified dividend income, which carries favorable tax treatment a Treasury coupon does not. It does mean that the implicit "growth always wins" assumption embedded in the five-year CAGR table is the most regime-dependent claim in the dataset. A reader weighing these three funds in 2026 should be comfortable that any allocation works in a regime that is materially different from the one that produced the recent track record.
Implementation friction: the things that don't show up in CAGR
Three frictions affect total returns more than most retail discussions admit.
Tax-cost ratio. SCHD's 3.3% yield is taxable in a taxable account. For most US investors the qualified dividend rate (0/15/20%) is favorable, but it is not zero. QQQM and VOO have lower yields (0.5% and 1.1%) and therefore lower current tax drag — they defer more of the return into long-term capital gains, realized only when sold. For a tax-deferred account this is a non-issue; for a brokerage account it is a real 30–60 basis-point consideration that the CAGR column hides.
Scale and capacity. VOO at roughly $1.6T AUM and QQQM at $82.9B do not face capacity constraints in any practical sense. SCHD at $91.1B does not either, but its rules-based reconstitution means the underlying index can move prices on smaller dividend names during the annual rebalance — a friction Schwab has so far managed competently and one to watch as the fund continues to grow.
Tracking error. VOO tracks the S&P 500 within one to two basis points annually. QQQM tracks the Nasdaq-100 similarly tightly. SCHD's index reconstitutes annually rather than continuously, which creates predictable but bounded tracking divergence. None of this is material for a long-horizon investor; all of it is more honest than ignoring the topic.

The non-obvious insight: SCHD's contribution is not what most readers think
The conventional argument for adding SCHD to a VOO/QQQM core is "income" or "diversification." Both undersell what is actually happening. The realized-volatility numbers above show SCHD at 14.4%, VOO at 16.8%, and QQQM at 22.3%. A 70/20/10 split of VOO/QQQM/SCHD has slightly lower portfolio volatility than 100% VOO — not because SCHD is uncorrelated (it is not; the correlation is roughly 0.8 to VOO over the window) but because its sector weights differ enough to dampen drawdowns from any single sector shock.
Put differently: SCHD's job inside a core is not to win on CAGR. It is to widen the range of regimes the portfolio handles without forcing the investor to make a decision under stress. Compounded across a multi-decade contribution schedule, that dampening can earn back more than its modest return drag in regimes where growth does not dominate. That is a different kind of return, and it does not show up on a one-line performance leaderboard.
Scoreboard: winners by category
| Category | Winner | Why |
|---|---|---|
| Cost | VOO (0.03%) | Cheapest in the comparison; 12 bp under QQQM, 3 bp under SCHD. |
| Realized return (5Y) | QQQM (17.6%) | Highest CAGR — but in a single tech-dominated regime. |
| Realized risk (5Y) | SCHD (14.4% vol; −16.8% DD) | Lowest volatility and shallowest drawdown of the three. |
| Suitability as sole core | VOO | Broadest exposure, no single-factor concentration, lowest cost. |
FAQ
Q: Is SCHD redundant with VOO since both hold US large-caps?
A: There is overlap by ticker but the weighting and sector exposure differ substantially. SCHD underweights technology by roughly 20 percentage points relative to VOO and overweights consumer staples, healthcare, and financials. The five-year volatility gap (14.4% vs 16.8%) reflects that structural difference, not coincidence.
Q: Should QQQM ever be held alongside VOO given the overlap?
A: Roughly half of QQQM by weight already sits inside VOO via the S&P 500. Holding both is a deliberate tilt toward large-cap technology — a coherent choice, but readers should be honest that it is a sector overweight, not diversification. The same question is taken up directly in VOO vs QQQM vs TQQQ: What 5-Year Volatility and Drawdown Tell Us About Leverage.
Q: With the 10-year Treasury at 4.47%, why hold SCHD for its 3.3% yield?
A: SCHD is not a bond substitute. Its distribution is mostly qualified dividend income (favorable tax treatment) and the underlying companies grow distributions over time, while a Treasury coupon does not. The comparison to make is total return plus tax-adjusted yield over a multi-year horizon, not nominal yield today.
Q: How does SCHD really compare to VOO on a total-return basis once dividends are reinvested?
A: Over the trailing five years VOO leads (13.9% vs 8.2% CAGR); over ten years the gap narrows materially (15.6% vs 12.7%). The longer-window numbers are taken apart in SCHD vs VOO: What the Data Actually Says About Dividend Yield and Total Return.
Q: How would adding international or small-cap value exposure change the picture?
A: It would broaden factor coverage in directions VOO/QQQM/SCHD do not reach. The rationale for adding those sleeves is worked through in The Rationale Behind a Five-ETF Long-Term Core and in Beyond a One-ETF Equity Core: What AVUV and VXUS Actually Add to VOO.
What this comparison can and can't tell you
The dataset above is five years of daily total returns ending 2026-05-18 (plus a ten-year reading for VOO and SCHD). That window contains the 2020 recovery, the 2022 growth drawdown, the 2023–2024 AI-led rally, and the 2025 rate normalization. It does not contain a sustained value cycle of the kind seen 2000–2007, a multi-year sideways market, a sovereign credit stress, or a regime where the equity-risk premium is negative for an extended period. QQQM in particular has no ten-year live history; its five-year numbers should be discounted for limited regime coverage. Backtested factor returns prior to fund inception are subject to look-ahead and survivorship bias and are not used here.
Scenarios where each fund fits
Reader in 30s, retirement account, 30-year horizon, no current US large-cap exposure. VOO as the core; a satellite tilt to QQQM or SCHD is a factor preference, not a requirement. The simpler portfolio is usually the one actually held to the horizon.
Reader in 50s, taxable brokerage, behavioral discomfort in drawdowns greater than 20%. A meaningful SCHD weight inside the core (e.g., 30–40% of the US equity sleeve) trades expected return for shallower realized drawdown — a worthwhile trade only if the investor will, in fact, continue contributing in a stress regime.
Reader who already holds VOO and wants a deliberate tech overweight. QQQM is a cleaner instrument than a sector ETF, but the reader should size it understanding that roughly half of the resulting US sleeve will be information technology and communication services by sector weight.
Editor's read
If forced to a single core fund, the editor leans toward VOO — broadest factor coverage, lowest cost, and no single-regime dependency. The SCHD argument is real, but it is an argument for a behavioral overlay, not a substitute. QQQM is a coherent satellite for an investor who explicitly wants the tilt and can describe what regime it underperforms in. The least defensible position is holding all three at equal weight without an explicit reason for each — that is three funds doing the work of one and a half.
The editor holds VOO and SCHD as part of a long-term core; the editor does not hold QQQM at the time of writing.
Key takeaways
- Five-year CAGR rankings are regime-dependent. QQQM's 17.6% leans on a single tech-led cycle; SCHD's 8.2% reverses much of the gap on a ten-year window (12.7% vs VOO's 15.6%).
- Realized risk separates these funds more cleanly than realized return: 22.3% / 16.8% / 14.4% volatility and −35.0% / −24.5% / −16.8% drawdowns are structural, not noise.
- SCHD's real contribution to a core is drawdown dampening, not yield. Its sector weights are different enough from VOO to widen the range of regimes the portfolio handles.
- Implementation friction (tax-cost ratio, reconstitution, tracking error) is small per year but compounds over decades — worth measuring before sizing the sleeves.
- Holding all three at undisciplined equal weight is the weakest answer; pick a core, name the satellite, and size each with a stated reason.
Methodology
Price and total-return series pulled via yfinance on 2026-05-18 for the trailing five-year window (and ten-year window where the inception date allows). CAGR is the geometric annualized total return of dividend-reinvested daily closes; realized volatility is the annualized standard deviation of daily log returns; maximum drawdown is the largest peak-to-trough decline of the cumulative total-return series within the window. Expense ratios, AUM, and inception dates are taken from each issuer's fact sheet linked in the data table. Macro reference points are from FRED with asof dates noted inline. Past performance is not predictive of future results.
This article is for educational purposes and does not constitute personalized financial advice. See Disclaimer.