
Photo by El khalil EL ARFAOUI on Unsplash
The short version
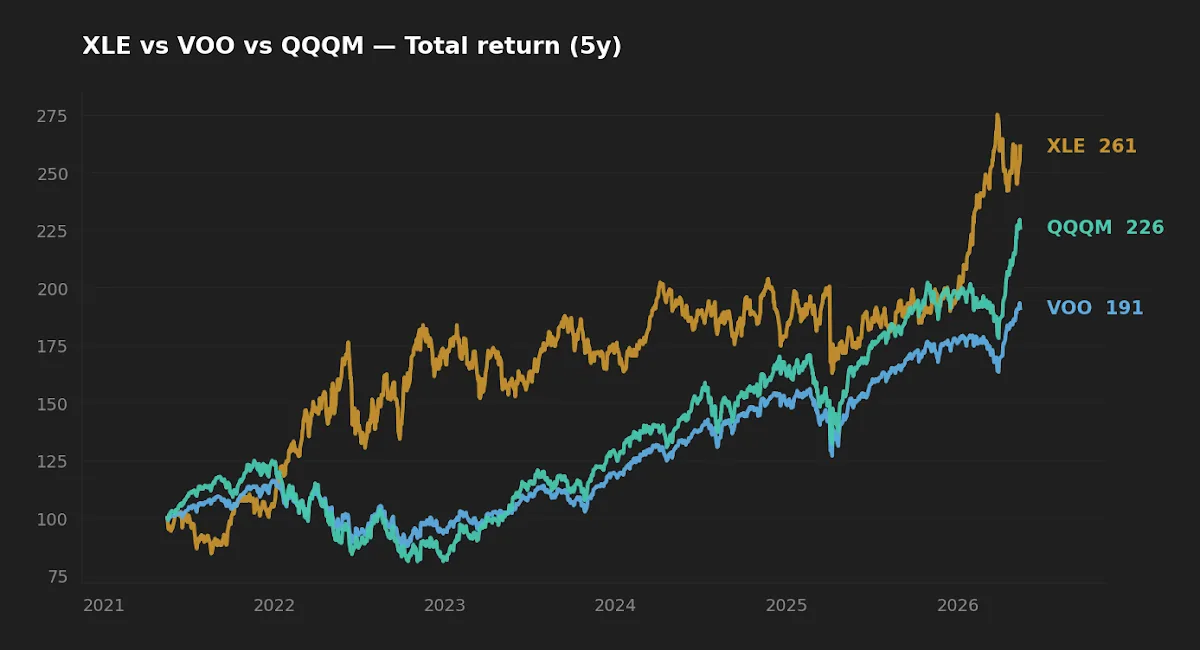
- XLE's trailing 5-year CAGR of 22.3% sits roughly 840 basis points above VOO, but the same fund's 10-year CAGR is 10.7% — a regime readout, not a structural edge.
- At 26.1% realized 5-year volatility versus 16.8% for VOO, XLE delivers most of its return through cycles that mean-revert. Rules-based bands let an investor harvest the windfall without forecasting the cycle's turn.
- The editor's read: XLE is defensible as a small, banded inflation-aware sleeve. Treating it as a buy-and-hold equal to a broad index has been historically punished.
XLE posted a five-year CAGR of 22.3% through mid-May 2026, more than 800 basis points ahead of VOO over the same window. That single number is the kind of trailing-window flattery that quietly damages long-term portfolios when investors mistake it for a permanent edge. The harder question — the one a rebalancing framework is built to answer — is what to do with a cyclical sector sleeve when the trailing math looks its best.
What XLE actually is
XLE tracks the energy holdings of the S&P 500 — large integrateds, refiners, and a handful of services and equipment names — through State Street's sector SPDR series. With $41.4B in assets and a 0.08% expense ratio, it is the most liquid pure-energy exposure available in US ETF form. Its 1998 inception spans three full commodity cycles, so the long-run data is generous, not thin (issuer: State Street Sector SPDRs, asof 2026-05-17).
The current macro backdrop matters for framing. The 10-year Treasury sits at 4.47%, the Fed funds rate at 3.64%, headline CPI at 3.9% year over year, and the VIX at 17.3 — an environment of slow disinflation and sticky real rates rather than acute risk-off (FRED, asof 2026-05-14). Energy is doing what energy does when commodities have been the dominant factor for several years: showing strong trailing numbers and tempting trailing-return chasers.
The data, at issuer prices and yfinance windows
| Ticker | Name | ER | AUM | Yield | 5Y CAGR | 10Y CAGR | 5Y Vol | 5Y Max DD | Inception |
|---|---|---|---|---|---|---|---|---|---|
| XLE | Energy Select Sector SPDR | 0.08% | $41.4B | 2.5% | 22.3% | 10.7% | 26.1% | -26.0% | 1998-12 |
| VOO | Vanguard S&P 500 | 0.03% | $1,600.2B | 1.1% | 13.9% | 15.6% | 16.8% | -24.5% | 2000-11 |
| QQQM | Invesco NASDAQ-100 | 0.15% | $82.9B | 0.5% | 17.6% | n/a | 22.3% | -35.0% | 2020-10 |
Sources: yfinance for price-derived metrics (CAGR, volatility, drawdown); State Street, Vanguard, and Invesco fact sheets for expense ratio, AUM, and yield. Data pulled 2026-05-17.
The five-year window is a regime, not a forecast
The most important fact in the table is the gap between XLE's 5Y CAGR (22.3%) and its 10Y CAGR (10.7%). The five-year window starts in mid-2021 — months after the COVID-era oil collapse, then runs through the 2022 commodity shock, the rate-hiking cycle, and the subsequent geopolitical risk premium. It is a near-best-case sample for a cyclical sector.
Extend the lens to ten years and the same fund returns roughly 4.9 percentage points less per year than VOO. Extend further — XLE's 1998 inception lets you check — and broad indexes have won across most rolling 10- and 15-year windows. The structural drivers are unflattering for the sector: capital intensity, commodity-price take, regulatory risk, and an investable universe that mean-reverts against the broader index because energy is already part of that broader index.
Initially I thought a 5Y CAGR that large might point to a regime change in energy. Then I pulled rolling 10-year returns and found nothing structurally different from the 2005–2008 commodity cycle — same shape, same flattering trailing data near the top, same reversion that followed. The lesson is not that energy is bad; it is that trailing returns are a regime readout, not a forecast.
Why XLE belongs in a sleeve, not the core
Sector ETFs have a structural problem the headline numbers obscure: they are concentrated bets on a single factor (here, commodity-price beta) inside a broader index that already owns the same names. The issuer holdings file shows XLE roughly 40% concentrated in two integrated majors. That is not diversification; it is a leveraged opinion on oil priced through the equity wrapper.
The realized risk numbers confirm the shape. XLE's 5Y volatility of 26.1% is about 55% higher than VOO's 16.8%, and the 5Y maximum drawdown of -26.0% is comparable to VOO's -24.5% only because both series ran through the same 2022 macro shock. In a true commodity bust — 2014–2016, or the brief 2020 collapse — XLE drew down 40–55% peak to trough. The drawdown chart below shows the recovery profile against VOO and QQQM and is worth more attention than the trailing-return line.
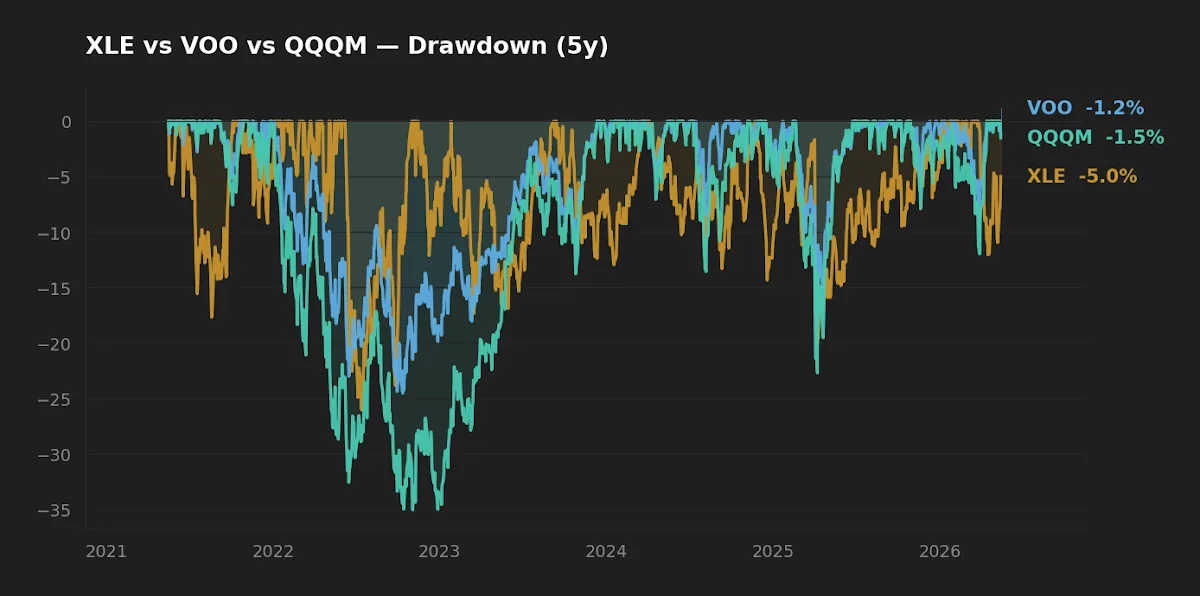
XLE's 5Y CAGR of 22.3% is the kind of trailing-window flattery that quietly damages long-term portfolios when it is mistaken for a permanent edge.
A 5% target weight in XLE inside a balanced portfolio behaves nothing like a 5% increment to the broad equity sleeve. It introduces non-trivial single-factor risk that the rest of the portfolio does not compensate for, and it correlates more with inflation surprises than with the broad equity factor — which is why some investors hold it deliberately as an inflation-aware satellite. That use case is defensible. Treating it as a long-term core compounder equal to the broad index is not.
Rebalancing bands as discipline, not prediction
The cleanest answer to "when do I trim XLE?" does not come from oil-price forecasting or geopolitical commentary; it comes from a rules-based band the academic literature has studied carefully. Daryanani's 2008 framework formalized opportunistic rebalancing through correlation-aware bands, and Vanguard's 2024 update on rebalancing best practices settled on a practical heuristic that is hard to beat: rebalance when an asset drifts by an absolute 5 percentage points from target, or by roughly ±25% of its target weight (proportional band) — whichever triggers first for the position.
In concrete terms, a 5% target XLE sleeve with a ±25% band triggers a trim when XLE grows to 6.25% of the portfolio. If XLE has appreciated 30–40% while the rest of the portfolio sits flat — exactly the scenario the 2022 and 2026 energy runs produced — the band fires without any judgment call on oil prices. The investor sells into strength because the math says so, not because they have predicted a peak.
Two second-order points the bands handle that intuition usually does not. First, they cut both ways: when XLE falls to 3.75% of the portfolio, the same rule forces buying into weakness, which is psychologically harder than selling into strength. Second, the proportional band scales correctly across position sizes — a 5% sleeve and a 25% core position can be governed by the same rule even though their dollar drift differs by an order of magnitude. Earlier coverage on what rebalancing discipline actually adds to long-term ETF returns walks through the empirical contribution; the short version is that the alpha from bands is modest in any given year and compounds meaningfully over decades.
What this comparison can and can't tell you
The 5-year and 10-year windows above both miss the prior energy super-bust (2014–2016, when XLE drew down roughly 40% against a flat S&P). They also miss the 2008 financial crisis. A reader concluding from the table that XLE's realized risk is "only" -26% in stress is reading a single-cycle sample. The honest framing is that XLE has produced 10-year CAGRs ranging from roughly -1% to +15% across rolling decade windows since 1999, depending on entry point. That dispersion is the sector's signature, and no rebalancing framework eliminates it — bands shape behavior, not outcomes.
Scenarios where each fund fits
Reader in their 30s, 401(k)-only, no current sector tilts: The broad index carries the core. Adding XLE means accepting single-factor risk for a sector that historically lags. Defensible at 0–5% if there is a specific inflation-hedge thesis; not defensible at 15%+.
Reader with taxable brokerage and explicit inflation concern: A 3–5% XLE sleeve with a ±25% band can sit alongside a broad-index core as an inflation-aware satellite. The qualified-dividend split on XLE's 2.5% yield helps the after-tax math relative to actively managed energy funds.
Reader chasing the 22% trailing CAGR: The window includes the largest commodity move since 2008. Reversion to the long-run mean is the base case. Earlier analysis on 2026 energy policy covers the regulatory backdrop; nothing in that file supports a structural overweight relative to the index.
Scoreboard
| Category | Winner | Why |
|---|---|---|
| Cost | VOO (0.03%) | Lowest expense ratio in the comparison; 5 bp below XLE and 12 bp below QQQM. |
| Realized risk (5Y) | VOO (16.8% vol) | Lowest realized volatility and a non-sector-specific drawdown profile. |
| Trailing return (5Y) | XLE (22.3%) | Highest 5Y CAGR — explicitly regime-driven, not structural. |
| Long-run return (10Y) | VOO (15.6%) | Broad index leads across most rolling decade windows since XLE's inception. |
| Suitability for core | VOO | Single-fund diversification, lowest fee, lowest realized vol. |
| Suitability for sleeve | XLE | Defensible as a small, banded inflation-aware satellite — not a long-term core compounder. |
FAQ
Should I sell XLE if it has grown past my target weight? A rules-based band (proportional ±25% of target, or 5 absolute percentage points from target — whichever triggers first) gives a non-discretionary answer. If XLE has appreciated past the upper band, trim back to target. The decision does not require an oil-price forecast.
Why is XLE's 5-year return so much higher than VOO's? The 5-year window starts in mid-2021 and captures the 2022 commodity shock plus the subsequent geopolitical risk premium. Energy has been the dominant factor for much of this window. The 10-year CAGR (10.7% versus VOO's 15.6%) is closer to XLE's long-run profile.
Does XLE work as a long-term core holding? Historically, no. Across most rolling 10- and 15-year windows since XLE's 1998 inception, broad indexes have delivered higher risk-adjusted returns. XLE is a sector concentration bet, not a diversifier.
How big should an XLE sleeve be? The academic literature on satellite sizing does not give a universal answer, but most rebalancing frameworks cap single-sector sleeves at 3–7% of the portfolio. Beyond that, single-factor risk starts dominating portfolio variance.
Is XLE's 2.5% dividend yield attractive versus the 10-year Treasury at 4.47%? Not on yield alone — the Treasury wins by 197 bp. XLE's case is total return plus inflation correlation, not income. Investors looking purely for income have cleaner options in short-duration Treasuries like SGOV.
Key takeaways
- XLE's 22.3% 5Y CAGR is real but regime-driven; the 10Y CAGR of 10.7% is the long-run reference point.
- Sector concentration introduces single-factor risk the broad index already prices; XLE is a sleeve, not a core.
- Rules-based rebalancing bands (Daryanani 2008; Vanguard 2024) remove the prediction problem from the trim decision.
- The 5Y and 10Y windows miss the 2014–2016 energy bust; assume a wider dispersion of future outcomes than the table suggests.
Editor's read
If forced to size XLE today, the editor would treat it as a 3–5% inflation-aware satellite, governed by a ±25% proportional band, and would not let the trailing 5-year number drift the sleeve north of that. The 840 bp 5Y outperformance versus VOO is the signature of a sector running hot, not of a structural edge — and rebalancing bands are designed for exactly this situation, where intuition resists selling into strength.
The editor does not currently hold XLE; the long-term core is built around broad-index and factor-tilt positions with no dedicated single-sector sleeve at the time of writing.
Methodology: Price-derived metrics (CAGR, volatility, maximum drawdown) computed from yfinance daily total-return series through 2026-05-17. Expense ratio, AUM, and dividend yield from issuer fact sheets (State Street, Vanguard, Invesco). Macro reference values from FRED, asof dates noted in text. Rebalancing-band heuristics reference Daryanani (2008) on opportunistic rebalancing and Vanguard's 2024 best-practices update.
This article is for educational purposes and does not constitute personalized financial advice. See full Disclaimer.