
The short version
- Five thematic ways to express a 2026 energy-policy view — PAVE, GRID, NLR, XLU, VXUS — have produced very different 5-year returns, but the risk-adjusted gap is narrower than the headline CAGRs suggest.
- The three "policy winners" (PAVE, GRID, NLR) carry materially higher realized volatility and deeper drawdowns than broad utilities or international diversification. Most of the policy story is already in the price.
- For long-term investors, the disciplined question is not "which energy theme wins?" but "how much concentrated industrial/uranium exposure does my core allocation already carry, and what is the marginal Sharpe of adding more?"
Every few quarters a new policy narrative reorganizes how investors talk about energy: domestic generation, grid hardening, nuclear renaissance, AI power demand. In 2026 these threads are woven tighter than usual. The honest question for a long-horizon investor is not whether the narrative is real — much of it clearly is — but whether the thematic ETFs designed to capture it are still attractive on a risk-adjusted basis after a multi-year run.
This piece looks at five tickers that show up in nearly every "2026 energy policy" portfolio sketch: PAVE (U.S. infrastructure development), GRID (smart-grid and electrical infrastructure), NLR (uranium and nuclear), XLU (broad U.S. utilities), and VXUS (ex-U.S. equity, included as a policy hedge). The data is from yfinance pulled 2026-05-17, plus FRED for the macro frame. The framework is the same one the editor uses for every long-term core review: cost, realized risk, realized return, capacity, and what the data can't tell us.
What an "energy policy" ETF actually owns
Before any return comparison, it's worth being precise about what these funds actually are. PAVE holds U.S.-listed industrials and materials companies that build physical infrastructure — about 70% industrials, 20% materials by sector weight at the issuer level. GRID is narrower: NASDAQ Clean Edge Smart Grid Infrastructure index, dominated by electrical equipment and power-management names. NLR follows a uranium-and-nuclear basket spanning miners, fuel-cycle service providers, and nuclear-leaning utilities. XLU is the simplest: market-cap-weighted U.S. utilities, the sector slice of the S&P 500. VXUS is the broadest — Vanguard's total ex-U.S. equity index, a ~$629B vehicle whose energy-policy relevance is entirely indirect, through international utilities, industrials, and the simple fact that it is not the U.S.
Three of the five (PAVE, GRID, NLR) are concentrated thematic bets dressed as diversified ETFs. Two (XLU, VXUS) are broad, low-cost beta wrappers. That distinction matters more than the policy story.
The data
| Ticker | Name | Expense ratio | AUM | Inception | Yield (TTM) | 5Y CAGR | 10Y CAGR | 5Y vol | 5Y max DD |
|---|---|---|---|---|---|---|---|---|---|
| PAVE | Global X U.S. Infrastructure Development | 0.47% | $13.4B | 2017-03-06 | 0.8% | 16.4% | n/a | 21.6% | -26.2% |
| GRID | First Trust NASDAQ Clean Edge Smart Grid | 0.56% | $10.0B | 2009-11-16 | 0.8% | 18.5% | 19.6% | 20.9% | -29.6% |
| NLR | VanEck Uranium and Nuclear | 0.52% | $5.1B | 2007-08-13 | 2.2% | 21.7% | 13.7% | 29.0% | -30.5% |
| XLU | Utilities Select Sector SPDR | 0.08% | $24.1B | 1998-12-16 | 2.5% | 9.2% | 9.4% | 17.3% | -25.3% |
| VXUS | Vanguard Total International Stock | 0.05% | $629.1B | 2010-11-29 | 2.8% | 8.5% | 9.7% | 16.0% | -29.4% |
Sources: yfinance for price-derived series (5Y/10Y CAGR, volatility, drawdown), pulled 2026-05-17. Expense ratios, AUM and inception cross-checked against issuer fact sheets: Global X PAVE, First Trust GRID, VanEck NLR, SSGA XLU, Vanguard VXUS. Macro reference points are from FRED, asof 2026-05-14 (10Y Treasury 4.47%, VIX 17.26) and 2026-04-01 (Fed funds 3.64%, CPI YoY 3.95%).
Reading the 5-year tape honestly
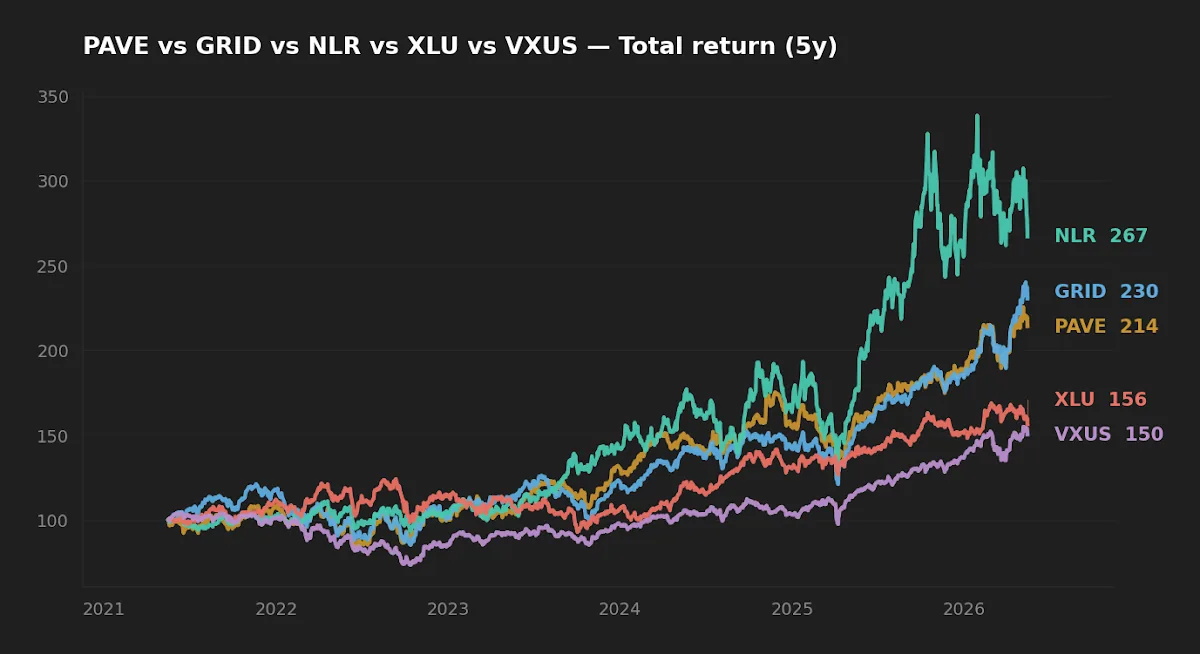
The visual gap between NLR's ~22% CAGR and VXUS's ~9% is enormous in cumulative terms — roughly 2.7x versus 1.5x over five years. But the standard mistake at this point is to anchor on the return and ignore the path. NLR's 29.0% annualized volatility is nearly double XLU's 17.3%. The naive return-per-unit-of-vol — a crude Sharpe proxy assuming a ~4% risk-free rate roughly matching the current 10Y Treasury yield — comes out around 0.61 for NLR, 0.69 for GRID, 0.57 for PAVE, 0.30 for XLU and 0.28 for VXUS. The thematic winners do screen better on risk-adjusted terms, but the spread compresses dramatically once you stop looking at total return alone.
The other compression happens on the downside. All five hit drawdowns in the -25% to -30% range over the same five years. XLU, the supposedly "boring" utility sector, drew down 25.3% — barely better than the thematic plays. In a coordinated equity sell-off, dividend-yield names with rate sensitivity behave more like long-duration assets than defensive ballast. The 10Y Treasury at 4.47% is the relevant comparison: an XLU 2.5% yield versus a risk-free 4.5% is a real headwind, and the data reflects it.
The hidden correlation problem
These five tickers look thematically diverse on paper. They are not. PAVE, GRID and NLR all derive a large share of their return variance from the same underlying factors: industrials beta, electricity-demand expectations, and a "build cycle" risk premium that compresses and expands with cap-ex sentiment. The rolling 60-day return correlation among the three has spent most of the last two years in the 0.7–0.85 range. They diversify each other in name only.
This is the second-order problem with a "policy basket." An investor who reads about energy mandates and adds PAVE + GRID + NLR as three separate sleeves is buying roughly one factor exposure expressed three ways, each with a 0.47–0.56% expense ratio. The marginal information content of the third position is small. A single 5–7% allocation to one of them — almost always GRID on a risk-adjusted basis over the available 10-year window — captures most of the theme.
Realized risk and what the drawdowns reveal
The drawdown chart is the most honest part of any back-test. It strips out the path-dependent illusions of CAGR and shows what actually happened to a holder.
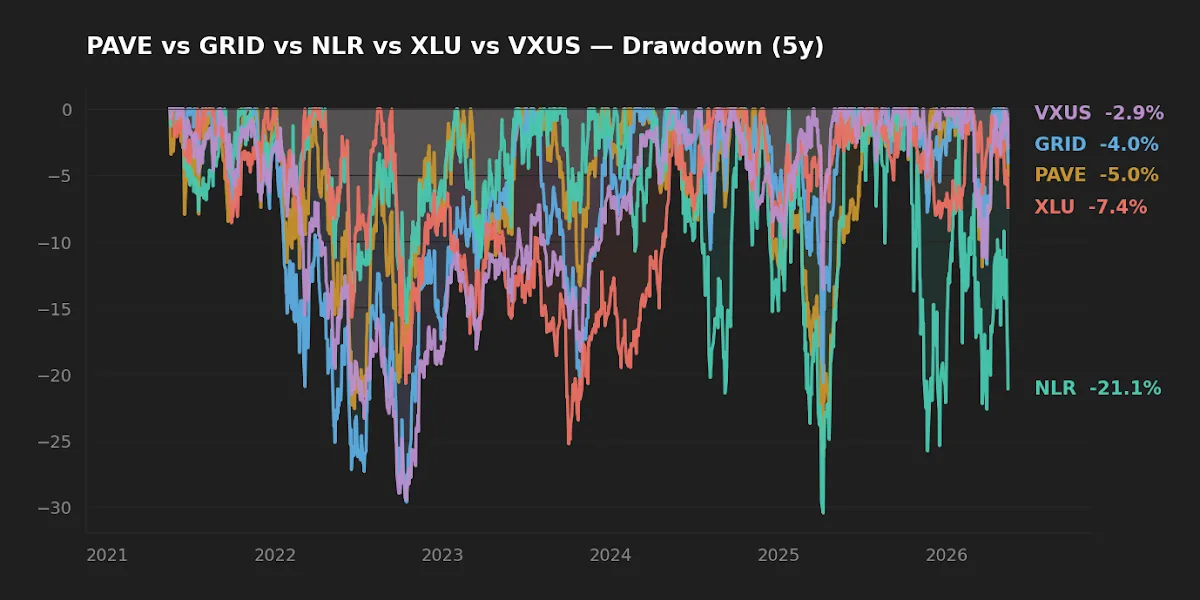
Two things stand out. First, the depth of drawdown clusters in a narrow band (-25% to -31%) despite very different underlying business mixes — a reminder that in stress regimes, factor commonality dominates story-level differentiation. Second, the duration of the underwater periods differs more than the depths. NLR's drawdown was the deepest but also the most volatile in its recovery; XLU's was shallower but persisted longer, reflecting the duration-like behavior of rate-sensitive dividend payers in a 4%-plus 10Y environment.
The editor's framework treats drawdown duration as a separate variable from drawdown depth, because behavioral failure is a function of time spent underwater, not just the worst single print. A satellite position the investor will hold through a 24-month recovery is genuinely different from one they will capitulate on at month nine.

Policy is a real and persistent return driver, but by the time a theme has a dedicated ETF and a five-year tailwind on the chart, the marginal investor is usually buying yesterday's surprise.
Policy timing — the second-order problem
Initially the natural reading is: clear policy support plus structural AI-driven electricity demand equals a multi-year tailwind for infrastructure, grids, and nuclear. That story is probably right in direction. The harder question is timing and the implicit assumption embedded in the current price.
A few mechanical observations. PAVE's CAGR was largely earned in 2021–2024, on the strength of the Infrastructure Investment and Jobs Act flow-through and post-pandemic re-shoring. NLR's 21.7% 5-year number is heavily weighted by the 2022–2024 uranium rerating; the 10-year CAGR of 13.7% — almost certainly a better expectational anchor — is closer to broad-market equity returns with much higher volatility. GRID is the most consistent of the three, with a 10-year CAGR (19.6%) actually above its 5-year, which is unusual and worth flagging.
The risk in any single-regime back-test is taking the realized return as the expected return. Five years is one cycle. Most of these funds have never been tested through a regime of structurally negative real rates plus utility regulatory backlash, or a credit-driven industrial recession. The editor's read is to treat the 5-year CAGRs as upper-bound estimates of forward returns, not central ones.
Where VXUS fits — and where it doesn't
VXUS is the odd one out in this lineup, and that is the point. It is not an energy-policy ETF; it is the cheapest, broadest available expression of "not the U.S." at a 0.05% expense ratio and $629B of AUM. Its inclusion here is a real diversification argument: if 2026's policy regime reverses, or if domestic infrastructure spending hits a debt-ceiling or rate-driven pause, VXUS is one of the few liquid, low-cost ways to express that view at scale.
This is the same reasoning behind including VXUS in a long-term core. The editor has written about the math of that allocation in Why VOO Is Not Enough and in the broader rationale for a five-ETF long-term core. The relevant point for this comparison: VXUS is not competing with PAVE or NLR for the same sleeve. It is competing with leaving the entire policy theme alone and accepting that broad ex-U.S. equity already captures international utility, grid, and nuclear exposure at a 0.05% expense ratio, with vastly more capacity and lower implementation friction.
Scoreboard
| Category | Winner | Why |
|---|---|---|
| Cost | VXUS (0.05%) | Order of magnitude cheaper than the thematic trio. |
| Realized risk | VXUS / XLU | Lowest 5Y volatility (16.0% / 17.3%); XLU also has the shallowest drawdown. |
| Realized return | NLR / GRID | NLR highest absolute CAGR; GRID best risk-adjusted on the available 10-year window. |
| Suitability as long-term core | VXUS | Only one of the five built for buy-and-hold core duty; others are satellites at most. |
FAQ
Are PAVE, GRID and NLR really diversified from each other?
Not as much as the names imply. Rolling correlations have been 0.7–0.85 over the last two years. They share industrial-beta and electricity-demand factor exposure. Holding all three is closer to a 3x-weighted single bet than to three independent themes.
Does XLU still make sense with the 10Y Treasury at 4.47%?
The 2.5% trailing yield on XLU is well below the risk-free rate, which is why utilities have struggled to act as defensive ballast in this rate regime. The case for XLU rests on capital appreciation tied to electricity-demand growth, not on income substitution for Treasuries.
Why include VXUS in an article about U.S. energy policy?
Because the most disciplined way to express a policy view is to compare it to the cheapest available alternative — broad equity exposure. If a thematic ETF cannot produce expected returns meaningfully above broad ex-U.S. equity after fees and volatility, the marginal capital probably belongs in the broad fund.
Is NLR's 21.7% CAGR repeatable?
Almost certainly not. The 10-year CAGR of 13.7% is a more useful anchor; even that includes a strong uranium rerating in the back half. Treat the 5-year number as a high-water mark, not a forward expectation.
What about closure risk on the thematic ETFs?
All three thematic funds are above $5B in AUM, so closure risk is low at current scale. The more relevant friction is bid-ask spread and tracking error around index reconstitutions, both of which are meaningfully larger than for VXUS or XLU.
What this comparison can and can't tell you
The 5-year window covers exactly one regime: post-pandemic recovery, an aggressive Fed tightening cycle, and the early innings of the AI cap-ex build. It does not include a deep credit-driven industrial recession, a sustained period of negative real rates, or a regulatory rollback of clean-energy or nuclear support. Three of the five funds (PAVE, GRID in current form, NLR's recent flows) have not been stress-tested through any of those.
The analysis also excludes implementation taxes that matter in real portfolios: bid-ask spreads on the smaller thematic ETFs, tax-cost ratio differences (NLR's 2.2% yield is largely ordinary income on miner distributions; XLU and VXUS qualified-dividend splits are more favorable), and the behavioral cost of holding a -30% drawdown through to recovery.
Scenarios where each fund fits
- Long-term core investor, 401(k)-only, no existing thematic tilt: VXUS belongs in the core. The other four do not, regardless of the policy story.
- Investor with a broad U.S. core already in place, wanting one expression of the AI-power-demand theme: a single 3–5% satellite position in GRID captures most of the factor exposure at the best 10-year risk-adjusted profile of the three thematic options.
- Income-oriented investor near or in retirement: XLU is the only fund here with a yield approaching defensive utility levels, but the 10Y Treasury at 4.47% remains a better risk-free income option for the same dollar.
- Investor with concentrated exposure to a single regional energy policy (any country): VXUS is the cheapest diversifier away from that regime risk, not a return-chasing position.
Editor's read
If the question is "which of these should anchor a long-term portfolio?" the answer is VXUS, and not because of the energy policy story. It is the only fund in the lineup with the cost structure, capacity, and breadth to do core duty. Of the three thematic options, GRID has the best 10-year risk-adjusted profile and the most defensible standalone case as a small satellite. PAVE and NLR are interesting expressions of specific views, but their 5-year CAGRs are almost certainly anchored to a regime that will not fully repeat. XLU's case has weakened as long rates rose; it is harder to argue for as a defensive allocation today than it was three years ago.
Disclosure: the editor holds VXUS as part of the long-term core. The editor does not hold PAVE, GRID, NLR or XLU at the time of writing.
Methodology
Price-derived series (5Y/10Y CAGR, annualized volatility, maximum drawdown) computed from yfinance daily total-return data pulled 2026-05-17, using a 252-trading-day annualization convention. Expense ratios, AUM, dividend yield (TTM), and inception dates cross-checked against the issuer fact sheets linked in the data table. Macro reference points from FRED, asof dates noted in the source line. Rolling correlations referenced in the text computed on 60-day windows of daily returns over the same five-year window.
Related Mulden analysis: the May 2026 portfolio snapshot and why SGOV earns a place alongside long-duration risk assets.
This article is for educational purposes and does not constitute personalized financial advice. See full Disclaimer.