
The short version
- Daryanani-style threshold bands (±15% of target) reduce rebalance frequency and tax drag versus naive calendar rebalancing — but only if the chosen "destination" sleeve is genuinely uncorrelated with the "source" sleeve.
- The reflexive trade of trimming a nuclear/AI-power sleeve into broad utilities (XLU) is partially circular: utility demand has become a downstream beneficiary of the same data-center power thesis, so the apparent diversification is smaller than it looks.
- SGOV is the cleanest waiting room for trimmed proceeds when the goal is preserving optionality rather than reaching for yield; PAVE adds infrastructure exposure that overlaps less with the AI factor than utilities do.
After a sharp AI-adjacent run, the rebalancing question is rarely "should I trim?" It is "what does trimming actually accomplish — and where does the cash sit while waiting to be redeployed?" The answer depends on two things most retail commentary skips: the factor overlap between source and destination, and the implementation friction of each ticker in the rotation.
This article looks at five ETFs commonly named in that rotation — NUKZ (nuclear), PSCU (small-cap utilities and communication services), SGOV (ultra-short Treasuries), XLU (large-cap utilities), and PAVE (infrastructure) — using current yfinance data and asking whether the standard "trim AI satellite, rotate into utilities and cash" prescription actually does what investors think it does.
Context: what the macro tape says about the rotation
The current regime matters for this discussion. The 10-year Treasury sits at 4.47% (FRED, asof 2026-05-14), the effective federal funds rate at 3.64% (FRED, 2026-04-01), and headline CPI year-over-year at 3.9% (FRED, 2026-04-01). VIX at 17.3 indicates a calm-but-not-complacent equity tape. In plain terms: cash equivalents pay a real return for the first time in roughly fifteen years, and that single fact changes the math of holding rebalance proceeds in SGOV rather than rushing them back into equities.
The five tickers, side by side
| Ticker | Fund | ER | AUM | Yield | 5Y CAGR | 5Y vol | 5Y max DD |
|---|---|---|---|---|---|---|---|
| NUKZ | Range Nuclear Renaissance | 0.85% | $0.9B | 0.8% | n/a* | n/a* | n/a* |
| PSCU | Invesco S&P SmallCap Utilities & Comm. | 0.29% | $15.8M | 1.0% | 1.5% | 18.4% | -30.0% |
| SGOV | iShares 0-3 Month Treasury | 0.09% | $85.2B | 3.9% | 3.5% | 0.2% | -0.03% |
| XLU | Utilities Select Sector SPDR | 0.08% | $24.1B | 2.5% | 9.2% | 17.3% | -25.3% |
| PAVE | Global X U.S. Infrastructure Dev. | 0.47% | $13.4B | 0.8% | 16.4% | 21.6% | -26.2% |
Source: yfinance pulled 2026-05-17; ER and AUM from issuer fact sheets linked above. *NUKZ inception 2024-01-10, so 5-year statistics are not available — a meaningful gap when comparing realized risk.
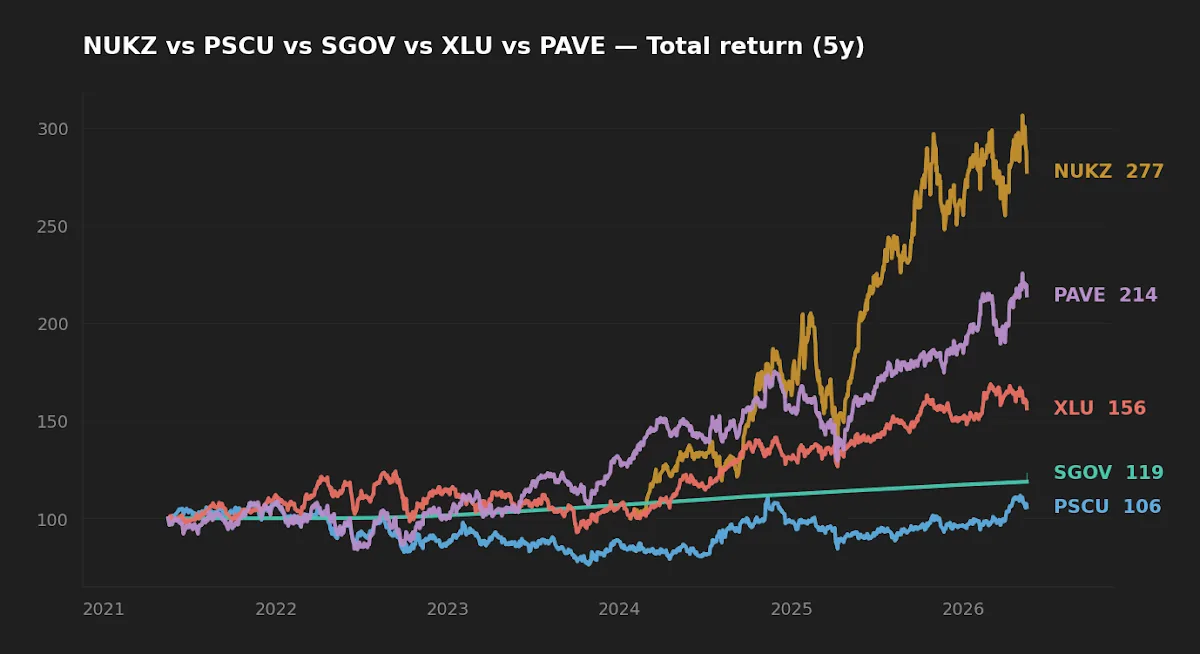
What a Daryanani-style trigger actually says to do
The academic rebalancing literature converged some time ago on threshold-based rather than calendar-based triggers. Daryanani (2008) demonstrated that rebalancing only when an asset class deviates by a relative band — commonly ±15% of its target weight for core equities and ±25% for satellites — captures most of the diversification benefit while substantially reducing turnover, transaction costs and unnecessary tax events. Vanguard's 2024 update reached broadly similar conclusions.
Concretely: if a "nuclear and AI-power" satellite sleeve was set at a 5% target, the ±25% band fires at 6.25% or 3.75%. A 5% absolute deviation rule, by contrast, fires at 10% — by which point the sleeve has doubled in weight and the portfolio is meaningfully more concentrated than the policy. The narrower threshold isn't perfectionism; it is what keeps the realized risk profile close to the planned one.
The honest caveat: thresholds were studied in a relatively benign rate regime. Taxable-account investors should still net rebalance cash flows (new contributions, dividends) against the trim, rather than reflexively selling appreciated lots, because the tax-cost ratio of liquidation often exceeds the rebalancing benefit on shorter horizons.
The factor-overlap problem the standard rotation misses
The reflexive rebalancing trade — trim a nuclear-power satellite, rotate into "defensive" utilities — assumes utilities are uncorrelated with the AI factor. That assumption is weaker now than it was five years ago. Hyperscaler data centers are the marginal new electricity buyer in several U.S. regional grids, and large utilities have been re-rated partly on that basis. XLU's 9.2% 5-year CAGR is not purely a defensive bond-proxy story; a non-trivial share of it is a derivative AI-power story.
This matters when computing the realized factor exposure after rebalancing. Trimming NUKZ into XLU reduces single-name nuclear concentration but leaves the broader "power-for-compute" thesis intact. If the original goal of the trim was to reduce sensitivity to AI-capex enthusiasm, the rotation only partly accomplishes it. PAVE — which holds engineering, materials and construction names benefiting from broader infrastructure spend — has lower thematic overlap with the AI-power factor than utilities do, though it carries its own cyclicality risk and a higher 21.6% realized volatility.

PSCU and the AUM threshold most retail comparisons ignore
PSCU appears in many sector-rotation lists, but at $15.8M in assets it sits in a different regime than its peers in this table. ETFs below roughly $50M typically trade with wider bid-ask spreads, exhibit larger NAV-to-price gaps during stress, and face elevated closure risk — Vanguard, BlackRock and SSGA have all closed sub-scale products in the past five years. The 1.5% 5-year CAGR with 18.4% realized volatility is, by itself, an unattractive Sharpe contribution; combined with the implementation friction, the reasonable question is whether the small-cap utilities thesis can be expressed through a larger fund or simply skipped.
Trimming a satellite into a "defensive" sector that has been quietly re-rated on the same underlying thesis reduces position size without meaningfully reducing factor exposure. The diversification is mostly cosmetic.
The realized risk picture: shape matters more than peak depth
The drawdown chart below shows what the 5-year max-drawdown column hides: SGOV stayed within ten basis points of par throughout, XLU and PAVE drew down 25-26% but recovered on materially different paths, and PSCU's -30% drawdown took longer to recover from. NUKZ has no comparable history; investors holding it are accepting a single-regime track record.
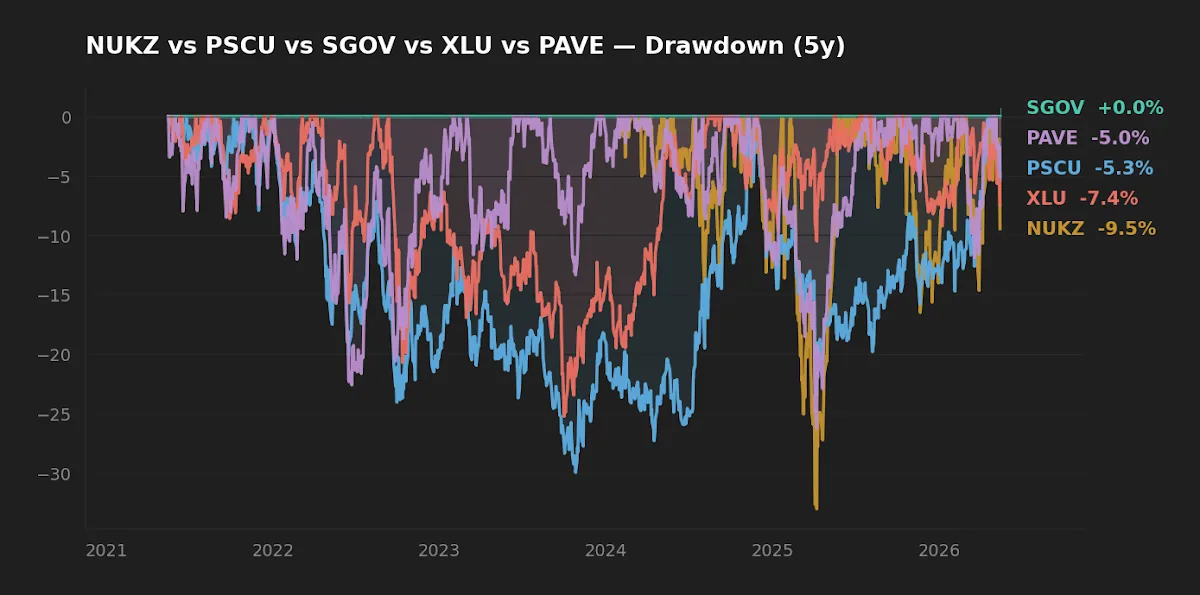
The asymmetry the data hides: drawdown duration matters more than depth for behaviorally constrained investors. A fund that lost 26% and recovered in nine months is operationally different from one that lost 30% and took two years, even though a summary statistic table treats them as comparable.
Scoreboard — winner by category
| Category | Winner | Why |
|---|---|---|
| Cost | XLU (0.08%) | Lowest expense ratio of the equity sleeve. |
| Realized risk (lowest) | SGOV | 0.2% 5Y vol; -0.03% max drawdown. |
| Realized return (5Y) | PAVE (16.4%) | Highest CAGR among funds with full 5Y history. |
| Suitability as rebalance waiting room | SGOV | 3.9% yield, scale, no duration risk while you decide. |
FAQ
Q: How wide should my rebalance band be on a sector satellite like NUKZ?
For a satellite sleeve of 2–5% of total portfolio, the academic literature (Daryanani 2008; Vanguard 2024) supports ±25% relative bands. A 5% target fires at 6.25% or 3.75%. Tighter bands generate more turnover without proportionally improving the risk profile.
Q: Why not rotate trimmed gains directly into VOO instead of waiting in SGOV?
You can, and for tax-advantaged accounts it's often the cleaner choice. The argument for SGOV is optionality: at a 3.9% yield, parking proceeds for 30–90 days while you wait for a contribution window or a market pullback costs little, and avoids buying broad equities at a tactically inopportune moment. SGOV and the role of cash buffers covers this trade-off in more depth.
Q: Is XLU really overlapping with the AI thesis, or is that overstated?
It's partial, not total. Large utilities still derive most revenue from residential and industrial load, but marginal earnings revisions and re-rating multiples in 2024–2025 have been disproportionately driven by data-center power-purchase agreements. Treat XLU as having a modest AI-factor beta, not zero.
Q: Should I avoid PSCU entirely because of its $15.8M AUM?
For most long-horizon investors, yes — the closure risk and bid-ask drag outweigh the small-cap utilities thesis at this scale. If you specifically want the exposure, the exposure exists more efficiently inside a broader small-cap value fund.
Q: When rotating, should I worry about wash-sale rules?
Wash-sale concerns apply to realized losses, not gains, so a trim of an appreciated sleeve is not directly affected. The relevant tax friction on trimming gains is the short-term vs. long-term holding period and the capital-gains rate that applies.
What this comparison can and can't tell you
The 5-year window covers one full rate-hiking cycle, the post-2022 inflation regime and the 2023–2025 AI-led equity rally. It does not cover a sustained recessionary equity bear market, a sovereign-credit stress event or a sustained period of declining real rates. Backward-looking statistics for NUKZ in particular are limited; investors holding the fund are extrapolating from a single regime. Tracking-error and tax-cost ratios are not shown here and would refine the picture further. Related reading on this kind of regime-coverage limitation: market rotation through a long-horizon lens.
Scenarios where each ticker fits
- Investor in 30s, 401(k)-only, no thematic satellite yet: the rebalancing question is hypothetical — the core decision is broad index exposure, not which sector to trim.
- Taxable-account investor with a NUKZ position that has appreciated past target band: trim to the upper threshold, route proceeds to SGOV, redeploy across the next 60–90 days as contribution cash flow arrives. Avoid concentrated reallocation in a single trade.
- Investor seeking "defensive" exposure but wary of utilities-as-AI-derivative: PAVE provides infrastructure exposure with lower thematic overlap to AI-power, accepting higher cyclicality.
- Income-oriented investor: the cleanest yield in this table is SGOV at 3.9% with effectively zero duration risk — a meaningful comparison point against XLU's 2.5% dividend yield with full equity drawdown risk.
Editor's read
If forced to pick one waiting-room ticker for trimmed AI-adjacent gains in the current regime, the editor leans toward SGOV. The 3.9% yield against a 10Y Treasury at 4.47% means cash is no longer free of opportunity cost, and the optionality of redeploying into broad index funds at a future entry point is genuinely valuable. XLU and PAVE are reasonable destinations for portions of the proceeds, but the implicit AI-factor exposure in XLU should be acknowledged rather than ignored. PSCU is hard to recommend at current AUM regardless of the underlying thesis.
The editor does not hold NUKZ, PSCU or XLU at the time of writing. The editor holds SGOV as part of a cash-equivalent sleeve.
Methodology footer
Price, return, volatility and drawdown statistics computed from daily adjusted close data via yfinance, pulled 2026-05-17. Expense ratio, AUM, inception date and yield from issuer fact sheets (links above). Macro reference rates from FRED, asof dates noted inline. 5-year window covers May 2021 through May 2026; readers should note this is a single-regime sample and not representative of all possible market environments. Rebalancing-band framework references Daryanani (2008) and Vanguard's 2024 rebalancing research.
This article is for educational purposes and does not constitute personalized financial advice. See full Disclaimer.