
The short version
- "Infrastructure" is not one asset class. XLU (regulated utilities), PAVE (industrial buildout), and GRID (smart-grid equipment) have different factor loadings, different sensitivities to the 10-year yield, and very different drawdown profiles.
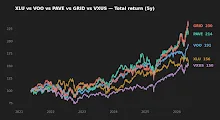
- The five-year CAGRs are loud (GRID 18.5%, PAVE 16.4%); the ten-year numbers are quieter and more honest, and PAVE has no ten-year track record at all.
- Most infrastructure mistakes reduce to four: overpaying for narrative, conflating yield with total return, ignoring expense-ratio drag, and abandoning the position when the macro regime shifts.
Infrastructure investing in 2026 sits at an awkward intersection. The "physical AI" story — data centers, transmission, transformers, copper — is real, the buildout is funded, and the leading thematic ETFs have meaningfully outperformed the S&P 500 over the past five years. None of that makes them low-risk holdings, and none of it tells a reader how to size them inside a long-term core. Most of the errors the editor sees in reader questions are not exotic; they are familiar mistakes applied to a sector that happens to be in the news.
This article works through the four most common ones, using current yfinance data on the most widely held infrastructure ETFs (XLU, PAVE, GRID), with VOO and VXUS as the reference benchmarks. The goal is not to talk anyone into or out of the theme — it is to make the trade-offs legible so a long-horizon investor can decide what role, if any, these funds should play.
Context: what "infrastructure ETF" actually means
The label hides three quite different things. XLU holds regulated U.S. utilities — rate-base businesses whose cash flows are essentially bond-like and whose price behaves accordingly. PAVE tracks industrials, materials, and engineering firms exposed to U.S. infrastructure capex (cement, aggregates, machinery, electrical equipment). GRID is narrower still: smart-grid hardware, transmission, and clean-energy infrastructure suppliers. The macro regime — 10-year Treasury at 4.47%, fed funds at 3.64%, CPI YoY 3.95% (FRED, as of 2026-05-14 and 2026-04-01) — affects each of these differently. A rate move that helps utilities can hurt cyclicals, and vice versa.
The data, as of today
| Ticker | Expense ratio | AUM | Yield | Inception | 5Y CAGR | 10Y CAGR | 5Y vol | 5Y max DD |
|---|---|---|---|---|---|---|---|---|
| XLU | 0.08% | $24.1B | 2.5% | 1998-12 | 9.2% | 9.4% | 17.3% | -25.3% |
| PAVE | 0.47% | $13.4B | 0.8% | 2017-03 | 16.4% | n/a | 21.6% | -26.2% |
| GRID | 0.56% | $10.0B | 0.8% | 2009-11 | 18.5% | 19.6% | 20.9% | -29.6% |
| VOO | 0.03% | $1,600.2B | 1.1% | 2000-11 | 13.9% | 15.6% | 16.8% | -24.5% |
| VXUS | 0.05% | $629.1B | 2.8% | 2010-11 | 8.5% | 9.7% | 16.0% | -29.4% |
Sources: yfinance for price-derived CAGR, volatility, and drawdown (window ending 2026-05-17). Expense ratio, AUM, yield, and inception from issuer fact sheets — SSGA (XLU), Global X (PAVE), First Trust (GRID), Vanguard (VOO), Vanguard (VXUS).
Mistake 1: treating "infrastructure" as a single asset class
The most expensive error is conceptual. A reader decides "I want infrastructure exposure" and buys whichever ticker is highest on a recent-performance list. That is not a sector allocation; it is a momentum bet on the specific slice the screen happened to surface.
Look at what the three funds actually do. XLU has a 17.3% five-year volatility and a -25.3% drawdown — close to VOO's risk profile, because regulated utilities behave like long-duration bonds with equity beta. GRID, on the other hand, posts 20.9% volatility and a -29.6% drawdown — closer to a focused industrial momentum sleeve. PAVE sits between them but is the youngest of the three (inception 2017-03), meaning its entire live track record is one cycle of low rates, one inflation shock, and one buildout boom. That's not enough regime coverage to extrapolate confidently.
If the goal is durable diversification away from a market-cap index, XLU and GRID belong in different conversations. Holding both does add real category exposure; holding GRID and PAVE together is mostly a leveraged industrial cyclical bet with a clean-energy tilt. The earlier sector-by-sector breakdown goes into the holdings overlap in more detail.
Mistake 2: confusing 5-year CAGR with expected return
GRID's 18.5% five-year CAGR is genuine, but the window is everything. That five-year stretch begins at a 2021 trough for energy-and-grid names and runs through an unusually large U.S. capex cycle driven by the IRA, CHIPS Act, and the AI data-center buildout. Reading 18.5% as the steady-state expected return is a textbook look-ahead and regime-selection bias — using the past five years to forecast the next thirty is exactly the move the academic literature on factor returns warns against.
GRID's ten-year CAGR (19.6%) is actually higher than its five-year, which sounds reassuring until you remember that the ten-year window starts at the late-2015 energy bust. The numbers are real, but two windows from two specific starting points are not a distribution; they are two draws. A reasonable prior for a narrow thematic ETF over a multi-decade holding period is much closer to broad-market equity returns plus or minus a factor premium — not high-teens annualized in perpetuity.
PAVE deserves its own asterisk here: no ten-year history exists, so any long-horizon claim about the fund is an extrapolation from a single regime. That is not a reason to avoid it; it is a reason to size it modestly and to be honest about what the data can and cannot tell you. The earlier piece on what risk actually means in ETF investing covers this distinction between realized and expected returns in more depth.
Reading a five-year CAGR as an expected return is one of the most expensive habits in retail investing — particularly when the window happens to coincide with a once-a-generation capex cycle.
Mistake 3: ignoring expense-ratio drag at multi-decade horizons
GRID charges 0.56%. VOO charges 0.03%. The 53-basis-point gap looks small in any single year and is invisible inside a year where GRID outperformed by hundreds of basis points. Compounded over thirty years, on a portfolio that would otherwise grow at 8% real, that fee gap is roughly 14% of terminal wealth. PAVE's 0.47% is in the same neighborhood.
This is not an argument against thematic ETFs. It is an argument for thinking about them the way one would think about an active manager: the gross excess return has to clear the fee in expectation, not just in the most recent window. For a satellite tilt sized at, say, 5–10% of equity, the dollar drag is small and the diversification or factor-tilt argument can pay for it. For a 30% allocation, the fee is doing real damage on a thirty-year horizon and needs a much higher conviction premise.
The implementation friction goes beyond the headline ER. Thematic funds with $10–13B AUM (GRID, PAVE) trade with wider bid-ask spreads than VOO or VXUS, and their underlying holdings include mid-cap names where rebalancing trades move prices. None of that is disqualifying; all of it is part of the total cost.

Mistake 4: abandoning the position when the regime changes
The realized-risk picture is where most readers underestimate what they are signing up for. All three infrastructure ETFs drew down 25–30% within the past five years. With the 10-year Treasury at 4.47% and CPI YoY still running near 3.95% (FRED, 2026-04-01), the rate environment is materially less friendly to long-duration cash flows than the period in which these CAGRs were earned. Initially the editor expected utilities specifically to compress sharply against the rate move; the realized 5Y vol of 17.3% suggests the market is treating them more like equity than like duration, but the relationship is not stable across regimes.
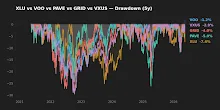
The behavioral mistake is to size the position based on the appealing CAGR and then to discover the drawdown only when it arrives. A -30% drawdown in a sleeve sized at 20% of the portfolio is a 6% hit to total equity, which is uncomfortable but survivable; in a sleeve sized at 40% based on recent-performance enthusiasm, the same drawdown is twice as painful and far more likely to trigger capitulation. Position sizing decided before the regime shifts is much cheaper than position sizing decided during one. The companion piece on when to stop investing and how to think about cash buffers covers the related discipline of preserving optionality at the wrong time of the cycle.
Scoreboard: what each ETF wins on
| Category | Winner | Why |
|---|---|---|
| Lowest cost | XLU (0.08%) | Cheapest of the three; closer to broad-market index ER than to thematic. |
| Realized 5Y return | GRID (18.5%) | Highest CAGR, but caveat the window selection. |
| Realized risk (lowest DD) | XLU (-25.3%) | Bond-like cash flows; smallest drawdown of the three. |
| Income | XLU (2.5%) | Only one of the three with a meaningful yield; PAVE and GRID are ~0.8%. |
| Track record across regimes | XLU (1998) | 27 years live, multiple rate and macro regimes; PAVE has only ~8. |
Editor's read
For a long-term core sleeve, the editor leans toward XLU as the only one of the three that has earned its place across multiple regimes at a low enough fee to compound. PAVE and GRID are interesting as satellite tilts — sized modestly (single-digit percent of equity), held with the understanding that their realized vol is roughly 25% higher than the broad market and their fees only get paid back if the buildout cycle continues. The temptation to chase the 18.5% number is what makes Mistake 2 the most expensive on this list.
The editor does not hold any of XLU, PAVE, or GRID at the time of writing. Allocation framework follows in-house portfolio review rules grounded in the rebalancing literature (Daryanani 2008; Vanguard 2024).
What this comparison can — and can't — tell you
- It can tell you the funds' realized returns, volatility, and drawdowns over the windows shown, and the structural costs of holding them.
- It cannot tell you whether the next ten years will resemble the last ten. PAVE has no ten-year record; GRID's record sits inside one large capex cycle and one rate cycle.
- The data does not include a true stress test — there has been no infrastructure-specific crisis in this window (no major utility default, no transmission grid policy reversal). Realized drawdowns are a lower bound on what's possible, not an upper bound.
- FRED macro data is end-of-period; the rate environment will move, and so will the relative attractiveness of duration-sensitive cash flows like XLU's.
FAQ
Q: Is XLU really an "infrastructure" ETF, or is it a utility ETF?
It's a sector utility ETF. It's marketed as infrastructure-adjacent because regulated utilities own the wires and generation that the AI buildout depends on, but the underlying holdings are equities, not infrastructure cash flows directly. Treat it as a utilities sleeve with infrastructure exposure, not as a pure infrastructure fund.
Q: Why does PAVE have no 10-year CAGR?
Inception was 2017-03-06, so it has not yet existed for a full decade. Any long-horizon claim about PAVE is necessarily an extrapolation from less than ten years of live performance, all of it inside a single broad regime.
Q: GRID has the highest expense ratio. Is it worth it?
Conditionally. The fee is roughly 18× VOO's. For a satellite position (single-digit percent of equity), the dollar drag is manageable and the focused exposure may justify it. For a core-sized position, the gross excess return has to clear 0.56% reliably over decades, which is a high bar to set on the basis of one buildout cycle.
Q: Should I add VXUS as international infrastructure exposure?
VXUS is not an infrastructure ETF — it's a broad total-international fund. It does provide diversification away from U.S. capex risk, which matters if a reader's infrastructure thesis is U.S.-specific, but the exposure to international utilities and industrials inside VXUS is diluted across all sectors. Use it for global equity diversification, not as a substitute for an infrastructure allocation.
Q: How big should an infrastructure sleeve be?
That depends on the rest of the portfolio and on the reader's tolerance for the realized drawdowns shown above. The editor's general framework treats high-conviction thematic sleeves as satellites in the 5–15% range, not as core. The companion piece on the full AI infrastructure framework walks through one way to think about sizing.
Key takeaways
- "Infrastructure" hides three distinct exposures. Decide which one the portfolio actually needs before picking a ticker.
- Five-year CAGRs in 2026 are inflated by a once-a-generation capex cycle. Anchor expectations on a wider range of outcomes.
- The 53-bp gap between GRID and VOO is meaningful at multi-decade horizons — roughly 14% of terminal wealth on plausible assumptions.
- Realized drawdowns of 25–30% are the floor of what these ETFs can do, not the ceiling. Size positions before the regime changes.
- XLU is the only one of the three with cross-regime evidence and a fee structure that survives long-horizon compounding scrutiny.
Methodology
Price-derived statistics (CAGR, volatility, max drawdown) computed from yfinance daily total-return series, window ending 2026-05-17. Expense ratio, AUM, dividend yield, and inception from issuer fact sheets (links inline above). Macro context from FRED (10Y Treasury and VIX asof 2026-05-14; fed funds rate and CPI YoY asof 2026-04-01). All percentages rounded to one decimal place. Past performance does not predict future returns; reported drawdowns are lower bounds drawn from a single five-year window.
This article is for educational purposes and does not constitute personalized financial advice. See full Disclaimer.