Photo by Behnam Norouzi on Unsplash
The short version
- Sector rotation is empirically real as cross-sectional dispersion, but the academic evidence that retail investors can trade it profitably after costs is thinner than the marketing suggests.
- The factor premia underneath rotation — size, value, quality, momentum — are already accessible through a diversified broad-market core like VOO (0.03% ER, $1,600.2B AUM); a tactical overlay rarely adds factor exposure that wasn't already available cheaper.
- For a 30-year ETF investor, rotation is most useful as a rebalancing prompt, not a trading signal. Disciplined ±15/±25 bands do the work; predictions usually don't.
Sector rotation is one of the most-cited and least-understood ideas in retail investing. The phrase surfaces whenever leadership flips — technology to financials, growth to value, US to non-US — and the framing is almost always the same: a hidden force, a great shift, a playbook to act on right now. For an investor on a thirty-year horizon, the interesting question isn't whether rotation is real. It is. Whether it is useful at that horizon, after honest costs and taxes, is a much more conditional answer than the headlines suggest.
At a high level, rotation refers to the empirical observation that returns across the eleven GICS sectors are not synchronous. Over rolling 12-month windows in US data, the historical spread between the best- and worst-performing sectors has averaged 30–40 percentage points — a gap large enough that any investor who could systematically position ahead of it would meaningfully outperform a broad index. That dispersion is the entire premise of the rotation industry. The question is whether the premise survives contact with implementation.
The reference point: what a broad-market core actually delivers
Before discussing rotation strategies, it is worth pinning down the alternative they are competing against — the diversified broad-market core most long-horizon investors already own.
| Metric | VOO — Vanguard S&P 500 ETF |
|---|---|
| Expense ratio | 0.03% |
| AUM | $1,600.2B |
| Inception | 2010-09-07 |
| NAV | $679.29 |
| Distribution yield (TTM) | 1.1% |
| 5Y CAGR | 13.9% |
| 10Y CAGR | 15.6% |
| 5Y annualized volatility | 16.8% |
| Max drawdown (5Y) | -24.5% |
Source: yfinance pull, 2026-05-16; Vanguard VOO issuer fact sheet (investor.vanguard.com/etf/profile/VOO). Macro figures: FRED, asof 2026-05-14 (10Y, VIX), 2026-04-01 (fed funds, CPI YoY).
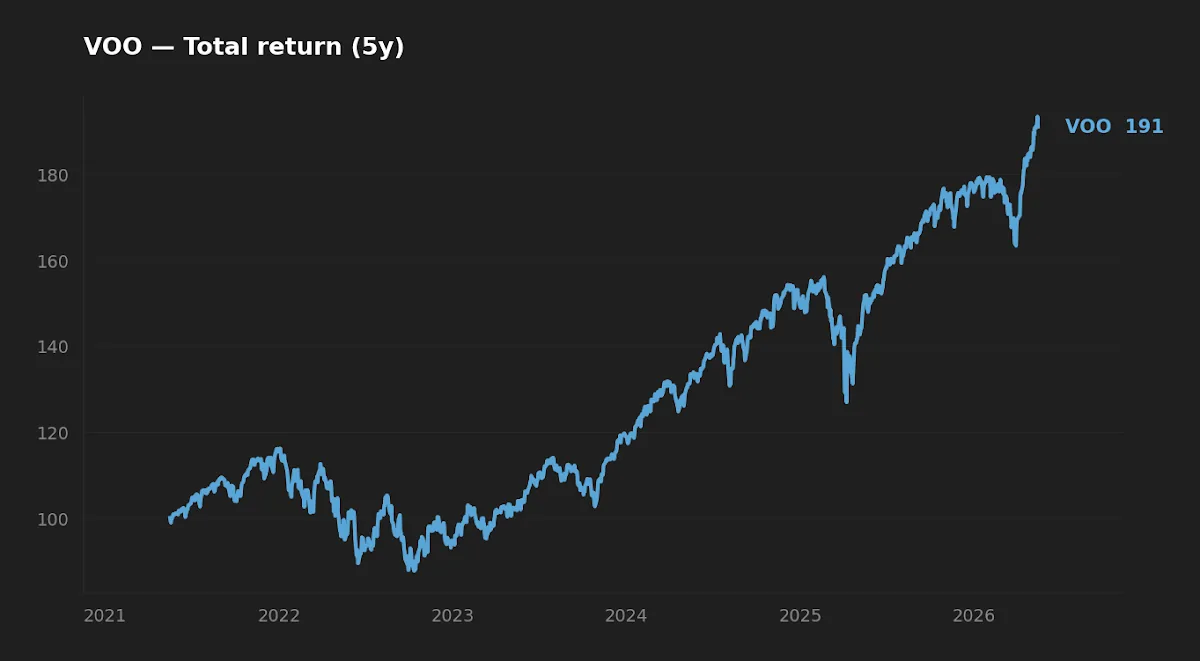
This is the bar a rotation strategy must clear net of costs and taxes: a 13.9% five-year CAGR with a -24.5% peak-to-trough drawdown, at 0.03% all-in cost. The question isn't whether sector dispersion exists. It is whether any tactical overlay on top of this can add net basis points after frictions.
Rotation, in technical terms
In the academic literature, sector rotation is a special case of cross-sectional dispersion combined with momentum. Jegadeesh and Titman (1993) documented that past 6–12-month winners tend to outperform past losers at the individual-stock level; Moskowitz and Grinblatt (1999) extended the finding to industry portfolios. The factor structure underneath is intuitive: when a macro regime favors a particular set of factor exposures — value during periods of rising real yields, quality during late-cycle slowdowns, low-volatility when credit spreads widen — the sectors with concentrated loadings on those factors lead.
So "rotation" is the surface phenomenon. Underneath are time-varying factor premia. This is why the standard retail-friendly chart of "what to buy in early/mid/late cycle" overstates its case. Cycle phase only loosely predicts the regime, and the regime only loosely predicts which factor will be paid. There is compounding noise at every step from macro to factor to sector to stock.
Why capital rotates — practitioner and academic accounts diverge
The practitioner story emphasizes flows: institutional rebalancing, sector-ETF creation and redemption, derivatives positioning. That story is accurate as a description of intraday and weekly mechanics, but it tends to confuse cause with effect. Flows respond to the same fundamental shifts — rates, earnings revisions, credit spreads — that academic models try to capture directly. Saying "the rotation is happening because money is flowing into financials" is roughly equivalent to saying "the rotation is happening because of the rotation."
The academic framing is sharper. Time-varying expected returns conditional on the macro state, in the Fama–French (1993, 1996, 2015) tradition and extended by Asness, Frazzini, and Pedersen on the quality factor, give a coherent reason why value, momentum, quality, and low-volatility premia all wax and wane with the cycle. Sector-level returns are essentially the projection of these underlying factor returns onto the GICS classification. Sectors are not a factor with independent existence; they are a particular slicing of the underlying loadings.
Taking the academic framing seriously has an uncomfortable implication for the rotation industry: a portfolio that already holds diversified exposure to size, value, quality, and broad-market beta is, in effect, already holding the rotation.
A portfolio that already holds diversified exposure to size, value, quality, and broad-market beta is, in effect, already holding the rotation.
Three frictions that consume the edge
Three things tend to go wrong when retail investors try to trade rotation directly.
Lag. By the time a rotation has been named in financial media, the bulk of the relative move has typically already happened. Buying the new leader after the headline locks in regime-late valuations and creates an asymmetry: upside-already-realized, downside-still-possible.
Cost asymmetry. Sector ETFs typically run 8–15 basis points in expense ratio versus 3 basis points for the broadest US-equity wrappers like VOO. Smaller sector ETFs add bid-ask spreads of 5–30 basis points round-trip. Two or three rotations a year and a meaningful share of any timing edge is consumed before the tax authority is even involved.
Tax drag. In a taxable account, realizing gains on a winning sector to chase a new one is structurally inefficient. At federal short-term capital-gains rates, a 25% taxable gain on a one-year hold consumes roughly the equivalent of two years of expected sector-dispersion alpha at historical medians. In a Roth or 401(k) the calculus changes, but most investors hold both account types and route tactical activity through the wrong one more often than they would care to admit.
Sharpe's arithmetic of active management (1991) applies, even at the sector level. Before costs, every dollar that rotates away from a sector is matched by a dollar rotating in. The active rotation game is zero-sum gross and negative-sum net. The question for a long-horizon investor is whether any specific timing signal is reliable enough to clear the cost hurdle. The published evidence on retail-implementable rotation strategies is sobering.
The realized-risk picture
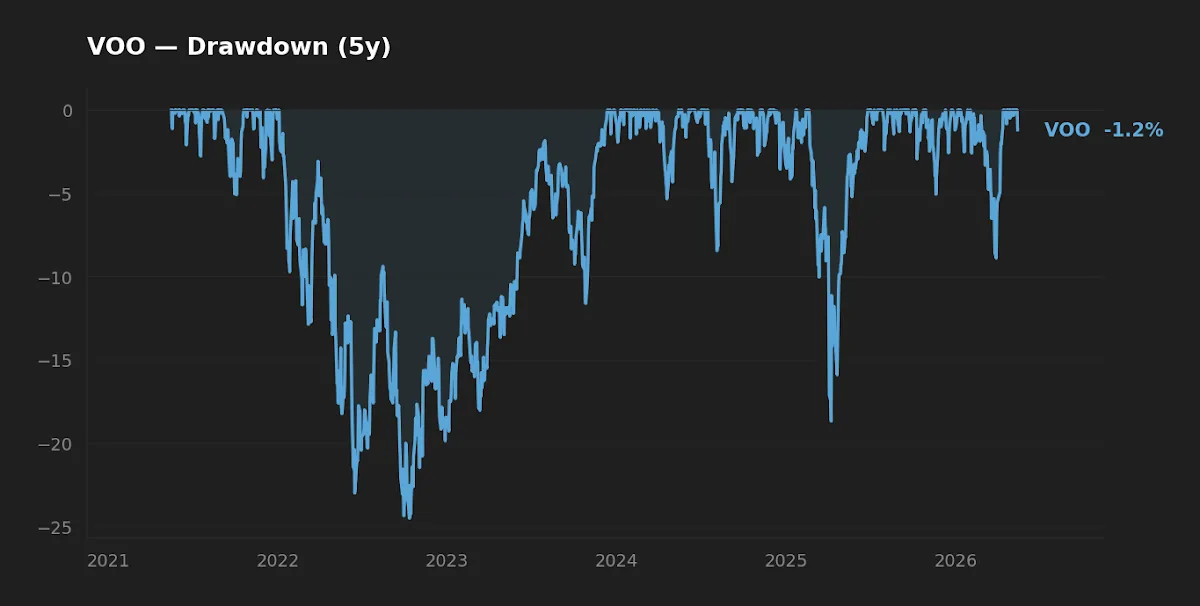
The 5-year drawdown profile is worth dwelling on. VOO's -24.5% peak-to-trough is the kind of stress event a rotation strategy must protect against to justify its costs. Initially I expected that historical sector-rotation models would have meaningfully blunted that drawdown; the published evidence is more mixed. In practice, the sectors that lead going into a drawdown are not reliably the same sectors that protect during it, and the cross-over often happens faster than discretionary rebalancing can respond. The cleanest defense in this dataset has been allocation discipline — pre-committed cash and bond buffers — not sector timing.
The 2026 regime read, calibrated
The current macro context is informative if read carefully rather than dramatized. The 10-year Treasury at 4.47% (FRED, asof 2026-05-14) sits well above the 1.5–2.5% range that defined most of the 2010s — a regime where falling discount rates structurally favored long-duration growth assets. Fed funds at 3.64% (FRED, asof 2026-04-01) remains restrictive relative to a 2% inflation target, with CPI YoY still running 3.9% (FRED, asof 2026-04-01). The VIX at 17.3 (FRED, asof 2026-05-14) is consistent with a non-stressed equity regime — neither the complacent 12–13 of late 2017 nor the 25+ that signals genuine credit-cycle concern. Equity participants have priced the rate path; they have not yet priced meaningful credit consequences.
What this combination favors in factor terms is debatable, and the honest version of the debate matters. Higher real yields create a tighter discounting environment that historically pressures the longest-duration assets — high-multiple growth, unprofitable companies, long-dated nominal bonds. That is the textbook case for value's relative attractiveness. Live evidence over the last several years has been mixed, and a single regime window is not a sample. Anyone claiming the 2026 regime "obviously" favors X over Y is overstating the certainty of factor models that themselves carry considerable error bars.
Rotation as a rebalancing prompt, not a trading signal
For a long-horizon ETF investor, the genuinely useful framing is this: rotation tells you when the existing diversification is doing its job. If a US large-cap sleeve is up 28% over a window where an international sleeve is up 6% and a dividend sleeve is flat, the diversification has worked — different parts of the portfolio responded to different parts of the regime. The signal is a rebalancing signal, not an exit signal.
Daryanani (2008) on opportunistic rebalancing and Vanguard's 2024 rebalancing research provide a disciplined framework. A ±15% relative band on each sleeve catches meaningful drift without over-trading; a ±25% absolute band gives a cleaner trigger. When rotation pushes one sleeve materially above its target weight, the band-rebalance trims the leader and adds to the laggard — mechanically buying low and selling high inside an allocation already chosen for long-horizon reasons. This is what the literature shows actually adds basis points to long-horizon outcomes. Chasing rotation forecasts does not.
The implementation side of positioning around the current macro setup is covered in how to position an ETF portfolio for the 2026 rotation, with a fuller version in the great rotation playbook. The case for diversifying beyond a single broad-market US exposure is laid out in why VOO is not enough. For the cross-asset side of the regime question, gold, the dollar, and risk assets in 2026 walks through the non-equity lens.
Scoreboard: rotation overlay vs. broad-market core with bands
| Category | Winner | Why |
|---|---|---|
| Cost | Broad-market core | 0.03% ER vs. 8–15 bp for sector ETFs, before spreads. |
| Realized risk | Inconclusive | Sector timing has not reliably shortened drawdown duration in published live evidence. |
| Realized return | Broad-market core (net) | Sharpe (1991) arithmetic; backtested rotation edges shrink after costs and taxes. |
| Suitability for 30Y horizon | Broad-market core + bands | Rules-based rebalancing captures the dispersion without paying for timing. |
FAQ
Is sector rotation real, or is it a narrative built after the fact?
Empirically real as a description of cross-sectional dispersion — industry returns vary substantially across cycles. The narrative built after the fact is the part that overreaches. Clean cycle-phase-to-sector mappings are tidier in retrospect than they were in real time, and most published "phase tables" are sensitive to how phases are dated.
Should I hold a tactical sector ETF allocation to play rotation?
For most long-horizon investors, no. The combination of expense-ratio differential, bid-ask cost, and tax drag in taxable accounts erodes most of the available alpha unless timing is unusually accurate. A diversified broad-market core with rules-based rebalancing captures the underlying factor exposures more efficiently.
What about industry-momentum strategies? The academic evidence supports those.
It does, in-sample and gross of costs. Published Sharpe ratios drop substantially once realistic transaction costs and capacity constraints are applied. Live retail implementations have generally not replicated the paper results, which is consistent with the edge being smaller than backtests suggest after honest frictions.
How do I know if my portfolio is responding correctly to rotation?
Look at within-portfolio dispersion. If sleeves all move together, the diversification is more nominal than real — fund-name diversification disguising factor concentration. If they diverge meaningfully across a 12-month window, that is diversification doing what it is supposed to do, and the right response is a band-rebalance rather than an emotional one.
Does the 2026 regime justify a more defensive allocation?
That depends on what "defensive" means at the horizon. The current setup — restrictive policy, sticky inflation at 3.9% CPI YoY, non-stressed equity vol — is consistent with forward equity returns potentially lower than the post-2009 average but not catastrophic. A 30-year investor adjusting allocation based on a single year's regime read is generally trading expected long-horizon return for current emotional comfort, which is a poor exchange.
What this analysis can and can't tell you
The factor framing of rotation rests on regression evidence that is robust in long-horizon US data and noisier in shorter or non-US samples. The 2026 macro context is a single observation; reading it as a clear directional signal for any particular factor would be overreach. The "rebalancing beats timing" conclusion holds on average across investors and regimes, but it does not guarantee that band-rebalancing will outperform a static buy-and-hold portfolio in any specific decade. The case is probabilistic, not deterministic — that distinction is precisely what most rotation marketing erases.
Where each approach fits
- Reader in their 30s, 401(k)-only, broad-market core already in place. Rotation overlay is unnecessary friction. Continue contributions; rebalance on bands at year-end.
- Reader in their 50s, taxable + tax-advantaged accounts mixed. Concentrate any tactical activity inside the tax-advantaged side; let the taxable side stay in low-turnover broad-market exposure.
- Reader genuinely interested in factor tilts. Use dedicated factor ETFs (value, small-value, momentum) sized as 10–20% satellites of a broad-market core — not a rotating sector deck.
Key takeaways
- Sector rotation is empirically real but harder to trade profitably than retail content suggests; the edge is largely consumed by costs and taxes for typical retail implementations.
- The factor premia underneath rotation are already accessible through diversified low-cost ETFs like VOO (0.03% ER); layering a tactical overlay rarely adds net factor exposure that wasn't already available cheaper.
- The 2026 regime — 10Y at 4.47%, fed funds at 3.64%, CPI at 3.9%, VIX at 17.3 — is a structurally tighter discounting environment than the 2010s, with implications for long-duration assets, but it is one observation rather than a regime sample.
- For a long-horizon ETF portfolio, rotation is most useful as a rebalancing prompt. Disciplined ±15/±25 bands capture the value of dispersion without paying for timing.
Editor's read
The honest position on rotation is that it is interesting as an explanation and unreliable as a trading prompt. The strongest argument for paying attention to it isn't to position ahead of the next move — it is to recognize the next move when it happens, so the response is a rebalancing trade rather than a panic trade. For buy-and-hold investors holding diversified ETF portfolios across full cycles, that distinction is most of the long-term game.
Editor's holdings. The editor holds broad-market US equity exposure (including VOO) inside a diversified long-term core. The editor does not currently hold dedicated sector-rotation ETFs.
Methodology. ETF metrics pulled from yfinance on 2026-05-16; expense ratio, AUM, NAV, and inception cross-checked against the Vanguard VOO issuer fact sheet. CAGR and drawdown computed on 5- and 10-year total-return windows ending 2026-05-16. Macro figures sourced from the Federal Reserve Economic Data (FRED), Federal Reserve Bank of St. Louis, with asof dates noted inline. Academic citations refer to Jegadeesh & Titman (1993), Moskowitz & Grinblatt (1999), Fama & French (1993, 1996, 2015), Asness, Frazzini & Pedersen on the quality factor, Sharpe (1991) on the arithmetic of active management, Daryanani (2008) on opportunistic rebalancing, and Vanguard (2024) rebalancing band research.
This article is for educational purposes and does not constitute personalized financial advice. See the full Disclaimer.