
Photo by Mahdi Bafande on Unsplash
The short version
- "Smart money" is mostly a narrative device. The honest version of the question is which 2026 capital flows are large and persistent enough to look structural rather than tactical.
- Three flows qualify: utility and physical-infrastructure sleeves tied to AI-driven power demand, short-duration Treasuries pulling cash off the sidelines at meaningful nominal yields, and a quieter rotation toward developed-international equities.
- All three trace to the same macro fact. With the 10Y at 4.47% against CPI at 3.9%, real yields are positive for the first time in over a decade — and that changes what defensive sleeves are for, not just how they perform.
"Smart money" is one of the more abused phrases in retail finance writing. Most of the time it labels whichever allocators got the last call right — survivorship bias dressed up as insight. The more disciplined version of the question is narrower: which observable capital flows in 2026 are large and persistent enough to look structural rather than tactical, and what does the macro arithmetic underneath them actually say?
Three such flows are visible so far this year. Each is downstream of the same fact — real yields are positive enough that defensive sleeves no longer carry the opportunity cost they did for most of the last fifteen years.
The macro backdrop in four numbers
The starting point for any 2026 capital-flow conversation is the rate environment. The 10-year Treasury yield sits at 4.47% (FRED, asof 2026-05-14). The effective fed-funds rate is 3.64% (FRED, asof 2026-04-01). Headline CPI is running at 3.9% year-over-year (FRED, asof 2026-04-01). That puts the real 10-year yield near 0.5% — modest, but a meaningful shift from the post-2008 stretch when real yields were negative or pinned near zero for years at a time. The VIX, at 17.3 (FRED, asof 2026-05-14), is calm — well below the 20–25 range that has historically marked elevated stress. So the backdrop is not a crisis rotation. It is a re-pricing of defensive sleeves under positive real carry, and that changes what those sleeves are for.
The three ETFs at the center of the rotation
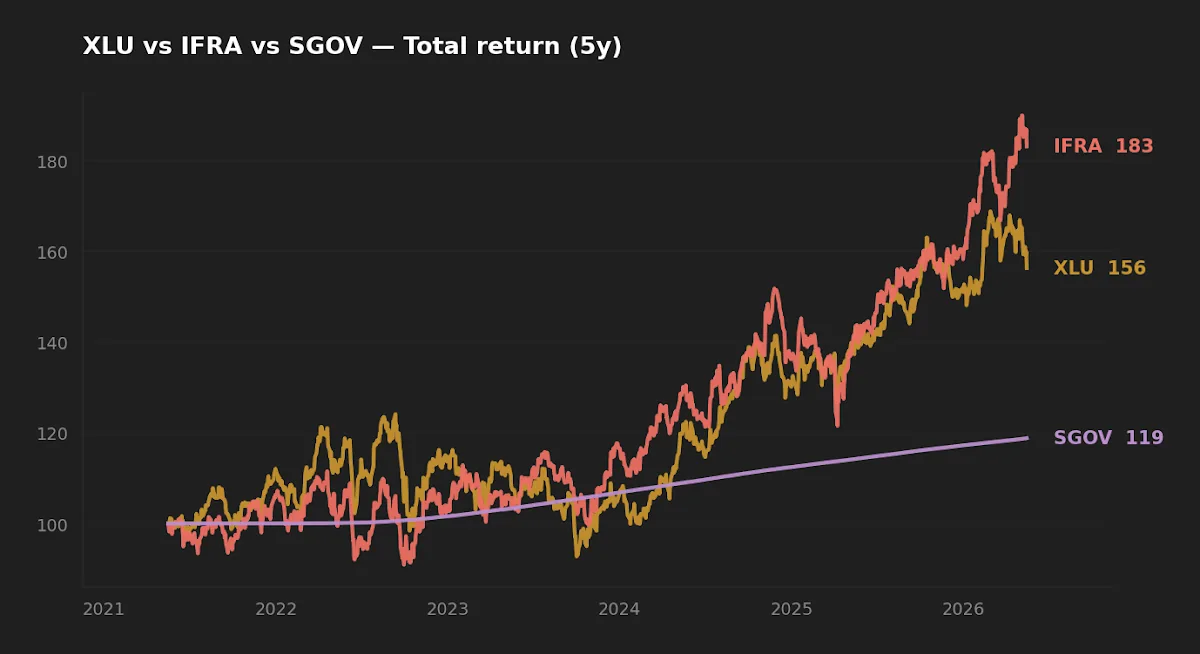
The clearest passive wrappers for the three flows discussed below are XLU (utilities), IFRA (US infrastructure), and SGOV (0–3-month Treasuries). Numbers below come from yfinance (pulled 2026-05-16) and each issuer's published fact sheet.
| Ticker | Expense | AUM | Inception | Yield | 5Y CAGR | 5Y Vol | Max DD (5Y) |
|---|---|---|---|---|---|---|---|
| XLU | 0.08% | $24.1B | 1998-12-16 | 2.5% | 9.2% | 17.3% | −25.3% |
| IFRA | 0.30% | $4.1B | 2018-04-03 | 1.6% | 12.8% | 18.0% | −19.9% |
| SGOV | 0.09% | $85.2B | 2020-05-26 | 3.9% | 3.5% | 0.2% | −0.03% |
What "smart money" actually means in flow data
The popular framing assumes a homogeneous block of allocators making coordinated moves. The data shows something messier. Pension funds, sovereign wealth funds, endowments, and large mutual-fund AUM all carry different liability structures, reporting cadences, and risk constraints. Their aggregate "rotation" is the sum of those constraints adjusting to a changed rate environment, not a single conviction trade.
What is actually observable, in rough order of usefulness: 13F filings (with a 90-day reporting lag) for long-only equity positions of allocators above the $100M threshold; ETF creations and redemptions as a high-frequency proxy for sector preference; Treasury auction bid-to-cover ratios and indirect-bidder share for institutional appetite on duration; and ICI / Morningstar fund-flow tapes. None of these tells you where capital "should" go. Together, they describe directional pressure. In 2026, that pressure has three coherent themes.
The AI-to-utility rotation, and why the wrapper matters
The most-discussed flow is into utility and physical-infrastructure sleeves — XLU- and IFRA-style exposures framed as benefiting from data-center power demand. The narrative is intuitive: the AI buildout needs electrons, and the grid hasn't kept up. The flows are real. The question is whether the math justifies treating utilities as a core position or as a satellite tilt.
Two structural reasons it isn't a clean core swap. First, utilities are roughly a 2.5% weight in the S&P 500. If you're long broad-market exposure, you already own them — adding a sector ETF on top is a deliberate factor tilt, not a diversifying move. Second, regulated utilities are not pure-play data-center beneficiaries. Most state-regulated utilities operate under rate-of-return frameworks that cap upside on capex. The companies most exposed to merchant power pricing — independent power producers — sit largely outside XLU's index methodology. The popular "utilities = AI infrastructure" trade is partially mispriced as a passive vehicle: the wrapper doesn't fully capture the trade the narrative describes. Initially I assumed XLU's 9.2% 5Y CAGR was the AI-power story showing up in returns; the constituent breakdown says most of it predates the thesis. For broader rotation framing, see The Great Rotation Playbook: Full ETF Strategy for 2026.
Short-duration Treasuries — when cash earns its keep
The second flow is into short-duration Treasury instruments — SGOV, BIL, direct T-bill purchases. With fed funds at 3.64% and SGOV's distribution yield at 3.9%, an investor can hold ultra-short Treasury exposure and earn a nominal yield that, after 3.9% inflation, sits roughly at break-even on a real basis — and well above the negative real returns cash carried through the ZIRP years.
The realized-risk picture is the cleanest part of the analysis. SGOV's 5-year max drawdown is −0.03% — effectively a flat line on the chart below. XLU drew down 25.3% over the same window; IFRA, 19.9%. These instruments do different jobs. SGOV is a yield-bearing parking spot; XLU and IFRA are equity sleeves with full equity drawdown profiles, even when their narratives sound defensive.
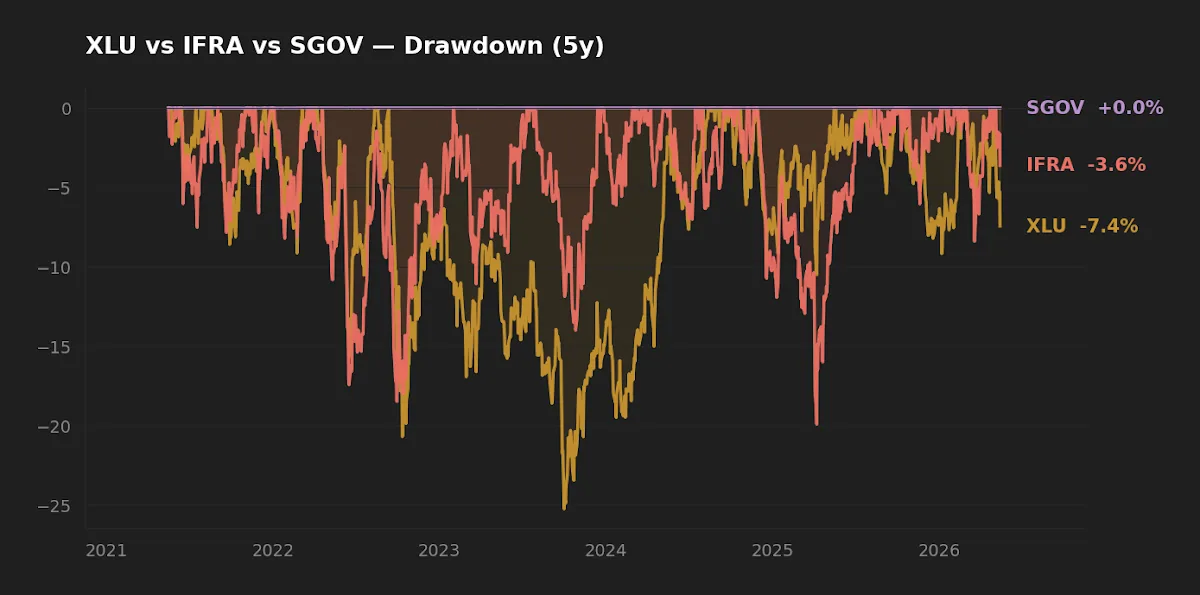
The implication is not "go to cash." It is that sleeve sizing assumptions calibrated under near-zero real yields may no longer be correct. For an investor mentally anchored to a small cash sleeve because "cash earns nothing," 2026 is a regime where that anchor is worth re-examining. The companion question — gold vs. short-duration Treasuries — is treated in Gold vs Bonds in 2026: Where Smart Money Hides During Uncertainty.
Sector tilts require a view. Sleeve sizing requires arithmetic. The structural change of 2026 is on the arithmetic side — and that's the part most retail portfolios haven't repriced yet.
International equities and the valuation-gap argument
The third flow is quieter but persistent: developed-international equity AUM has been growing relative to US-only AUM. The pitch is the valuation gap. The S&P 500's forward P/E sits well above its long-term median; broad developed-international indices trade at meaningful discounts on the same metric. This argument has been made for most of the last fifteen years and, by and large, has not worked — US equities have outperformed international by a wide margin since 2009.
Two structural changes are worth taking seriously before dismissing the 2026 version. Currency: the dollar index is off its 2022 highs, and some of the historical US outperformance came from dollar appreciation that mechanically depressed USD-denominated international returns. Concentration: US large-cap is more concentrated in a small number of mega-cap names than at any point in modern index history. Some institutional allocators are using international as a deliberate concentration hedge — not because they expect international to win on expected return, but because they want capital that isn't correlated to the same handful of US tech balance sheets. For more on this flow, see Is Capital Leaving the US? Global Money Flow Trends Explained and VXUS vs VOO: Where Should You Invest in 2026?.
Scoreboard: which fund does which job
| Category | Winner | Why |
|---|---|---|
| Cost | XLU (0.08%) | Edge over SGOV (0.09%) and IFRA (0.30%). |
| Realized risk (5Y) | SGOV | Max DD −0.03% vs. equity-style drawdowns in XLU and IFRA. |
| Realized return (5Y) | IFRA (12.8%) | Highest CAGR, but with a tilt that took full equity risk. |
| Defensive sleeve fit | SGOV | Only one of the three that actually behaves defensively. |
FAQ
Is now the time to sell broad-market exposure and rotate into utilities or international?
The data here doesn't support that as a default. A long-horizon investor's broad-market allocation already includes utilities and (through a global-equity sleeve) international. Reallocating away from broad exposure into a sector tilt is concentrated active risk on a thesis that may or may not play out.
How much cash is reasonable to hold in 2026 given the higher real yield?
There is no universal number, and individual circumstances dominate. The directional point is that cash holdings in the 10–20% range are far less costly to long-term CAGR than they were when the front end paid 0%. The May 2026 portfolio review walks through what that looked like in practice: May 2026 Snapshot.
Does "smart money" actually beat the broad index over multi-decade horizons?
The aggregate answer in the active-vs-passive literature (Sharpe 1991; SPIVA reports) is that the average institutional allocator, after costs, does not consistently beat broad-index exposure. The specific allocators who do tend to be unidentifiable in advance.
What about gold? Isn't that the obvious defensive trade?
Gold and short-duration Treasuries serve different functions. Gold is closer to an insurance premium against currency debasement; T-bills are a yield-bearing parking spot. They are not substitutes.
How should a long-term investor actually use this analysis?
As a check on whether the existing allocation is internally consistent. If a portfolio's sleeve sizing was calibrated for negative or zero real yields, that assumption no longer holds in 2026. The decision framework is in The Full Framework for Scientific Investing.
What this analysis can and can't tell you
Flow data is correlational, not causal. A surge in utility-sector ETF creations tells you allocators are buying; it doesn't tell you why, whether the buying will persist, or whether the underlying thesis is correct. 13F has a 90-day lag — by the time a position is publicly visible, the allocator may have already trimmed it. The 5-year return window covers a single regime (post-2020 inflation cycle plus the AI capex wave) and contains no genuine equity bear market for IFRA, which began trading in 2018. And the entire premise of an enlarged defensive sleeve is rate-conditional: if the Fed cuts aggressively and real yields compress back toward zero, the arithmetic weakens.
Scenarios where each fund fits
Reader in their 30s, 401(k)-only, broad-market core already in place: a small (1–3%) IFRA tilt is the cleanest expression of the AI-infrastructure thesis, with the understanding that it's an active call on top of the existing market-cap weight. XLU duplicates exposure they already hold.
Reader carrying a 5% cash sleeve in a taxable account, anchored on "cash earns nothing": SGOV at 3.9% distribution yield is the direct beneficiary of the regime change. The qualified-vs-ordinary split is the catch — interest income is ordinary, so the after-tax yield in a high bracket is materially lower than the headline.
Reader within 5 years of a planned drawdown: the SGOV drawdown profile (−0.03% over five years) is the relevant metric, not the higher CAGR of an equity sleeve. Sequence-of-returns risk is the binding constraint in that window.
Editor's read
If forced to extract one practical implication from the 2026 macro picture, the editor focuses on the cash-sleeve question rather than the sector rotations. Sector tilts require a view; sleeve sizing requires arithmetic. With positive real yields on the front end, an investor carrying a deliberately small cash sleeve — anchored on a heuristic from the ZIRP era — may be using the wrong default. That's worth a one-time review even if the conclusion is to leave the allocation unchanged. The utility and international rotations are interesting; they are not load-bearing for a long-horizon plan.
The editor maintains short-duration Treasury exposure and broad-market equity exposure within a long-horizon allocation framework; specific positions and amounts are not disclosed. The editor does not hold XLU or IFRA at the time of writing.
Methodology: macro figures from FRED (10-year Treasury constant maturity, effective fed-funds rate, CBOE VIX, CPI YoY), pulled 2026-05-14 / 2026-04-01. Price-history and return statistics from yfinance, pulled 2026-05-16, with 5-year windows ending May 2026. Expense ratios, AUM, distribution yield, and inception dates from each issuer's published fact sheet (SSGA for XLU; iShares for IFRA and SGOV). Flow framing draws on standard ETF creation/redemption and 13F data conventions; specific institutional holdings are not named because of reporting lag.
This article is for educational purposes and does not constitute personalized financial advice. See Disclaimer.