
Photo by Katie Harp on Unsplash
The short version
- A durable long-horizon portfolio is a system of roles — broad equity, factor tilt, income/quality, defensive cash — not a list of favorite tickers.
- The five ETFs analyzed here (VOO, SPLG, QQQM, AVUV, SCHD) populate three of those four roles. Their realized 5-year numbers expose what each role can and cannot do.
- Rules-based rebalancing on drift bands does more work over decades than picking the optimal fund inside any single role.
Most retail portfolio writing answers the wrong question. It tells the reader which ETF to buy. The harder question — and the one that actually decides whether a portfolio survives multiple decades — is what each holding is for. Tickers are substitutable; the role a holding plays usually is not.
This piece works through that distinction with five concrete instruments and the data they have actually produced over the last five years. The argument is simple: a portfolio assembled from four well-defined roles, populated with reasonable funds and held through a rules-based rebalancing discipline, tends to outperform a portfolio built from "the best ETFs of 2026" almost regardless of which specific tickers fill each slot.
Why role-based thinking precedes ticker selection
The empirical case for allocation over selection is older than most retail content acknowledges. Brinson, Hood and Beebower (1986; updated 1991) found that asset-allocation policy — not security selection, not market timing — explained the majority of variation in pension-fund returns over time. Ibbotson and Kaplan (2000) refined the magnitude. The headline survives intact: the structural decision about which asset classes you own, in what proportions, dominates the within-class question of which fund fills each slot.
Translated into a building procedure: before asking "VOO or SPLG," ask "what role does broad US equity play here, and what would the portfolio lose if it were missing?" Before asking "SCHD or some other dividend fund," ask "do I need a quality-yield sleeve at all, given my horizon and account type?" Most decisions get easier — and more honest — once the role is named.
The simplest defensible long-horizon frame uses four roles. There are reasonable arguments for adding a fifth — gold, long-duration Treasuries, broad commodities — for ballast in specific scenarios, and the framework absorbs the addition without changing shape.
Five funds, three roles — what the realized data shows
The five ETFs in this analysis are not direct competitors. They sit in three of the four roles described above, and a clean comparison treats them that way. Numbers below are pulled from yfinance and issuer fact sheets on 2026-05-16; trailing 5- and 10-year figures end on that date.
| Ticker | Role | Expense ratio | AUM | Yield | 5Y CAGR | 10Y CAGR | 5Y vol | 5Y max drawdown |
|---|---|---|---|---|---|---|---|---|
| VOO | Broad equity core | 0.03% | $1,600.2B | 1.1% | 13.9% | 15.6% | 16.8% | -24.5% |
| SPLG | Broad equity core | 0.02% | $97.3B | 1.1% | 13.7% | 15.6% | 16.8% | -24.5% |
| QQQM | Factor / growth tilt | 0.15% | $82.9B | 0.5% | 17.6% | n/a | 22.3% | -35.0% |
| AVUV | Factor / value tilt | 0.25% | $26.2B | 1.3% | 10.8% | n/a | 22.8% | -28.8% |
| SCHD | Income / quality sleeve | 0.06% | $91.1B | 3.3% | 8.2% | 12.7% | 14.4% | -16.8% |
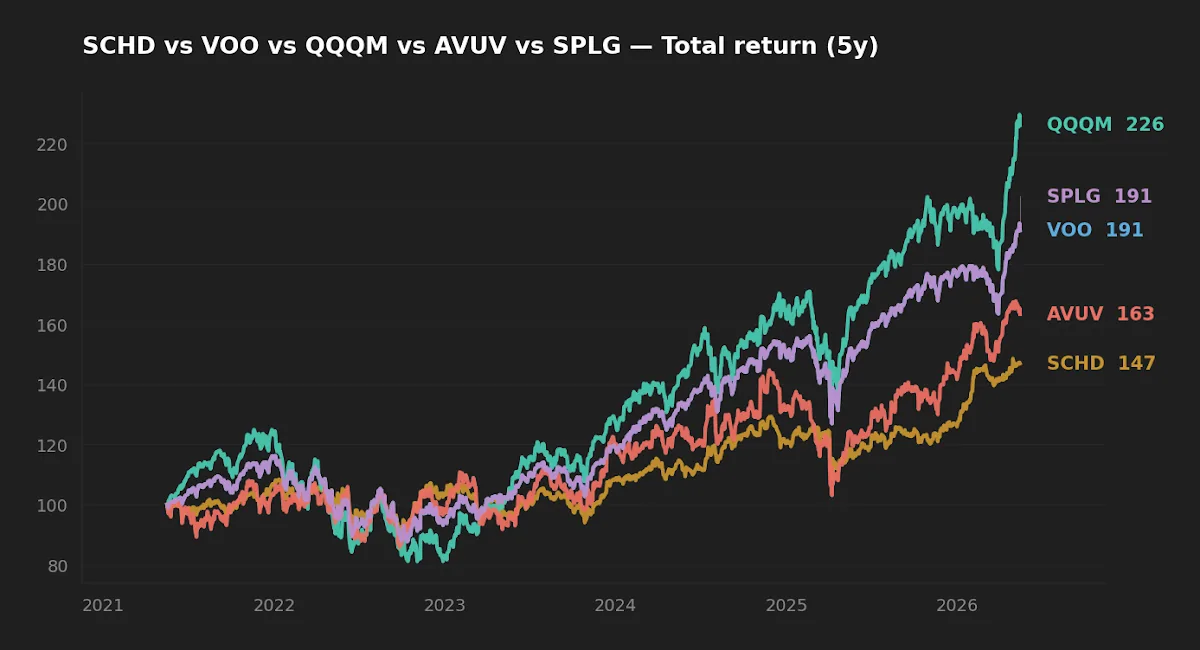
VOO and SPLG are functionally identical: both track the S&P 500, both have realized 13.7-13.9% 5-year CAGR and 16.8% volatility. They are substitutable instruments for the same role, with SPLG's 0.02% expense ratio undercutting VOO by a single basis point. Over decades that gap is real but small — the choice between them sits closer to a tax-lot or brokerage decision than an analytical one.
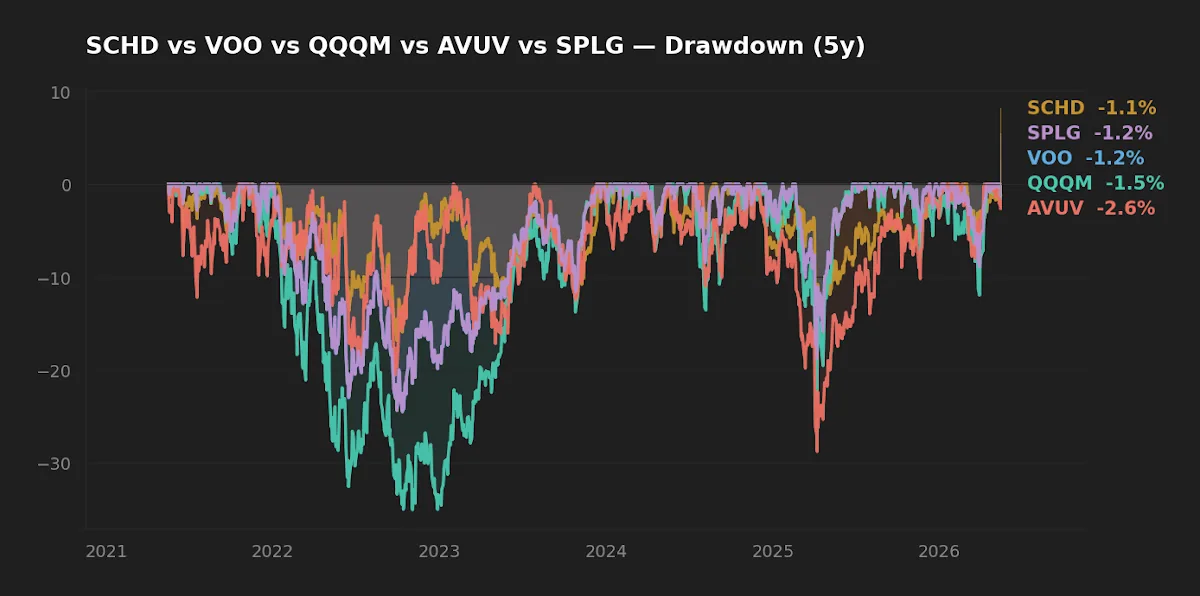
QQQM, AVUV and SCHD do different things. The 18-point spread between SCHD's -16.8% trough and QQQM's -35.0% trough over the same five-year window is the clearest illustration: these are not three flavors of the same exposure. Each is solving a different problem.
What each role can and — more importantly — cannot do
Every role is defined as much by its limitations as by its function. The "cannot do" column is the part most retail content skips, and it is where most portfolio mistakes get made.
Broad equity core (VOO, SPLG). Captures the broad return of US listed equity and delivers long-term real return. Cannot protect against a deep drawdown; cannot provide cash in stress. The realized -24.5% trough over the trailing five years is roughly what readers should pencil in as a normal-bad outcome for this sleeve, not an outlier.
Factor / growth tilt (QQQM, AVUV). Adds exposure to priced risks — large-cap growth concentration via QQQM, or the size and value tilts that Fama and French (1992, 1993, 2015) documented via AVUV. Cannot reduce overall portfolio volatility; both funds ran at 22%+ realized vol over the period, well above the broad market. QQQM's 17.6% 5Y CAGR rewarded that risk; AVUV's 10.8% has not yet, at least over this single regime. Factor sleeves underperform for stretches that exceed most investors' patience — that is the design, not the bug.
Income / quality sleeve (SCHD). Generates distributable cash flow at a 3.3% yield, tilts toward lower-beta firms with stronger balance sheets, and clipped its 5-year drawdown to -16.8% — roughly two-thirds of the S&P 500's trough. Cannot outpace the broad core in a growth regime; the 8.2% 5-year CAGR versus VOO's 13.9% is the price paid for that lower drawdown, and the spread is uncomfortable to hold without a clear reason for owning the sleeve.
Defensive cash / short duration. None of the five ETFs here fills this role. With the 10-year Treasury at 4.47% and the federal funds rate at 3.64% (FRED, asof 2026-05-14 and 2026-04-01), short T-bill ETFs are paying real, positive yields after headline CPI of 3.9% (FRED, asof 2026-04-01). The sleeve cannot outpace inflation over decades, but for the first time in roughly fifteen years its near-term carry is no longer punitive — which changes the cost-benefit of holding optionality.
Most portfolios fail not because the tickers were wrong, but because the system never existed in the first place — there was only a list of favorite holdings, none of which had been given a job description.
Discipline, not selection, does most of the compounding
Once roles exist and reasonable instruments fill them, the highest-leverage decision left is not "what to buy." It is "when, if ever, do I touch this." The literature on rebalancing — Daryanani's 2008 work on opportunistic drift bands, Vanguard's 2024 update, decades of pension-fund practice — converges on a few findings worth knowing.
- Drift bands tend to beat the calendar. A portfolio rebalanced when a role drifts outside a tolerance (commonly ±15% relative or ±25% absolute on the position weight) tends to capture more of the rebalancing premium than one rebalanced on a fixed quarterly or annual cadence. It acts only when something has moved enough to matter.
- Doing nothing is also a decision. A 60/40 that quietly drifts to 80/20 over a long bull run is no longer the portfolio whose risk profile the investor signed up for. The drift compounds, just not in the direction the investor wanted.
- The behavior is harder than the spreadsheet. The hardest rebalancing — trimming the winner, adding to the laggard — is exactly the trade the data says works. The arithmetic is clean; the execution is psychological.
An investor who picks a slightly worse ETF for a role and rebalances on rules will, over a multi-decade horizon, very likely beat an investor who picks the optimal ETF for every role and trades it on conviction. The arithmetic of long-horizon compounding is unforgiving in both directions — small frictions compound, and small disciplines compound, and behavior usually decides which dominates.
Reading the current regime through the framework
As of mid-May 2026, the 10-year Treasury sits at 4.47% and the federal funds rate at 3.64% (FRED, asof 2026-05-14 and 2026-04-01). Headline CPI is running at 3.9% year over year (FRED, asof 2026-04-01). The VIX closed at 17.26 on 2026-05-14 — calm by historical standards, though that calm sits on top of unusual single-name dispersion under the index surface.
Each piece of this regime has implications for the role-based portfolio, and none of them is "rotate aggressively." The defensive cash sleeve has become unusually productive: real yields are positive for the first time in over a decade, so the optionality of holding short-duration paper no longer carries a punitive carry cost. The income sleeve is competing with a 4.47% risk-free rate, which compresses the spread that quality-yield strategies historically earned over Treasuries — SCHD's 3.3% yield is currently below the 10Y, and that is worth knowing without being, by itself, a reason to redesign the role. The broad equity core continues to do what broad equity cores do.
Scoreboard: which ETF wins on which dimension
| Dimension | Winner | Reason |
|---|---|---|
| Cost | SPLG | 0.02% expense ratio — one basis point below VOO, the lowest in the group. |
| Realized 5Y risk (lowest drawdown) | SCHD | -16.8% trough versus -24.5% to -35.0% for the others. |
| Realized 5Y return | QQQM | 17.6% CAGR — but at 22.3% volatility and a -35.0% drawdown. |
| Suitability as long-horizon core | VOO or SPLG | Lowest cost, broadest exposure, deepest historical record; substitutable for each other. |
FAQ
Is VOO or SPLG meaningfully different for a long-horizon investor?
No. Both track the S&P 500. Their 5-year CAGRs (13.9% vs 13.7%), volatilities (16.8% each), and drawdowns (-24.5% each) are within rounding distance. SPLG's 0.02% expense ratio is one basis point below VOO's 0.03%, which over decades is real but small. Pick whichever your broker handles cleanly on fractional shares or the cleaner tax-lot history; the analytical difference is negligible.
Why include QQQM if it has the worst drawdown?
Because the role of a factor or growth tilt is to add exposure to a priced risk, not to lower portfolio volatility. QQQM's -35.0% drawdown is the cost of access to its 17.6% 5-year CAGR. Investors who can't behaviorally hold a sleeve through that kind of trough shouldn't size it large; investors who can are usually rewarded over multi-decade horizons. The mistake is treating it as a substitute for the broad core rather than a satellite to it.
Should SCHD replace the broad-market core in a retiree portfolio?
It cannot. The 5-year CAGR gap between SCHD (8.2%) and VOO (13.9%) is the structural penalty paid for the dividend tilt's lower drawdown. SCHD has a real role in a distribution-phase portfolio — its 3.3% yield reduces forced sales into a drawdown — but as a replacement for the core it sacrifices too much long-tail growth. See the dividend versus total-return discussion for the longer treatment.
Where is the defensive cash sleeve in this analysis?
Deliberately absent from the data table because none of the five ETFs fills the role. Short T-bill ETFs (SGOV, BIL) or money-market funds do. With the 10Y at 4.47% and headline CPI at 3.9%, the carry on the defensive sleeve is no longer negative in real terms — the first time in roughly fifteen years that has been true. A 5-15% allocation to short-duration paper, sized to a year or two of expected withdrawals or opportunistic deployment, is the practical implementation.
How does this framework interact with tax-aware account placement?
Significantly. SCHD's qualified-dividend yield is tax-efficient in a taxable account; AVUV's higher portfolio turnover and small-cap distributions are usually better held in a tax-advantaged account; QQQM is reasonably tax-efficient because of its low dividend yield. The role-based framework sits one layer above account placement — see the asset-location piece for the operational layer.
What this analysis can and cannot tell you
It can tell readers whether their current holdings, taken together, cover the four roles or leave one empty. It can separate first-order decisions (does an income sleeve exist at all?) from second-order ones (which specific income ETF). It can give a defensible reason to rebalance in months when nothing in the news demands action.
It cannot say what the next twelve months will do, whether this is a good year to add risk, or whether any specific factor sleeve is currently mispriced. The 5-year window spans one cycle, not several. The 10-year column is blank for QQQM (inception 2020-10-13) and AVUV (inception 2019-09-24), which means their factor exposures have not yet been tested across multiple regimes in live trading. That is a real limit of the evidence, not a footnote.
Scenarios where the role-based view changes a real decision
- A reader in their 30s with only a broad-market index fund in a 401(k). The framework's suggestion is not "more growth" but a defined cash sleeve outside the retirement account and possibly a small factor tilt — roles, not more of the same instrument.
- A reader entering distribution at 60-65. The income sleeve graduates from optional to load-bearing; the cash sleeve sizes up to absorb 1-3 years of expected withdrawals; the broad equity core stays roughly intact rather than collapsing into bonds.
- A reader who already owns SCHD, QQQM and AVUV in a taxable account. The question is no longer "which to add" but "is the income sleeve in the wrong account?" — qualified-dividend treatment fits taxable, factor turnover fits tax-advantaged.
- A reader with a watchlist of fifteen ETFs. The framework collapses the watchlist by asking which role each candidate fills and which roles still have nothing in them at all.
Editor's read
The highest-leverage idea here is not the role definitions or the data table. It is the disposition that a long-horizon portfolio is a system to be maintained, not a list of bets to be optimized. Most damage to long-horizon portfolios is self-inflicted, and most of the self-infliction comes from the conviction that the next decision will be the clever one. If forced to name a preference inside this group, the editor leans toward a broad core — VOO or SPLG, interchangeable on cost — as the dominant role, with a measured factor tilt and an income sleeve sized to the investor's relationship with cash flow rather than to a yield target. The framework's main use is to make most decisions unnecessary in the first place.
The editor holds positions consistent with the four-role framework described here; specific holdings and weights are not disclosed at the article level.
Key takeaways
- Define the role before picking the instrument. Most retail portfolio mistakes are role-shaped, not ticker-shaped.
- VOO and SPLG are interchangeable on the data shown; QQQM, AVUV and SCHD solve genuinely different problems and are not substitutes for each other.
- Rules-based rebalancing (drift bands or a disciplined calendar) does most of the work that ticker-picking arguments are trying to do.
- The defensive cash sleeve is the role most often missing — and the one whose carry has improved most under the current regime.
Methodology
Return, volatility and drawdown figures are computed from yfinance daily total-return data over the trailing 5- and 10-year windows ending 2026-05-16. Expense ratios, AUM, dividend yields and inception dates are pulled from issuer fact sheets (linked in the data table) on the same date. Macro figures are pulled from FRED on 2026-05-16: 10-year Treasury asof 2026-05-14; federal funds rate asof 2026-04-01; VIX asof 2026-05-14; headline CPI YoY asof 2026-04-01. The 10-year CAGR column is blank for QQQM (inception 2020-10-13) and AVUV (inception 2019-09-24) because the funds have not yet produced ten years of live history. The conceptual frame draws on Brinson, Hood and Beebower (1986/1991), Fama and French (1992/1993/2015), Daryanani (2008) on opportunistic rebalancing, and Vanguard's 2024 rebalancing research.
This article is for educational purposes and does not constitute personalized financial advice. See the full Disclaimer.