
The short version
- Applied to realized 5-year CAGRs, the Rule of 72 gives doubling estimates ranging from 4.1 years (QQQM) to 20.6 years (SGOV) — but that range collapses sharply once inflation and drawdowns enter the picture.
- With CPI running at 3.9% YoY, SGOV's 3.5% 5-year CAGR doesn't actually double real purchasing power within any reasonable window.
- The rule is a useful first-pass yardstick, not a forecast. The 2021–2026 window is a particular regime, and the doubling estimate it produces is conditional on that regime repeating.
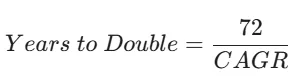
The Rule of 72 reduces compounding to one line of arithmetic: divide 72 by an assumed annual return to estimate how long a balance takes to double. It's a useful first pass — but the more carefully it is applied to real ETF data, the more cracks appear. The five-year window through May 2026 produces doubling estimates that span 4.1 years for QQQM down to 20.6 years for SGOV. The interesting question isn't which is fastest; it's how much of that gap survives inflation, variance, and the unrepresentative slice of history we happen to be looking at.
What the rule actually approximates
The exact doubling time at a fixed continuously-compounding rate r is ln(2)/ln(1+r) — roughly 0.693/r. Using 72 instead of 69.3 trades a sliver of precision for divisibility: 72 has clean factors at 2, 3, 4, 6, 8, 9 and 12, which is why it survived in finance pedagogy long before calculators. The approximation is tightest near 8%; at 3% it understates true doubling time by about three months, at 18% it understates by closer to five months. For comparing ETFs side-by-side, the error is small enough to ignore. The much larger problem is that the rule assumes a single, fixed nominal return with no contributions, no withdrawals, and no variance — none of which describe an actual portfolio.
The four ETFs, their realized numbers
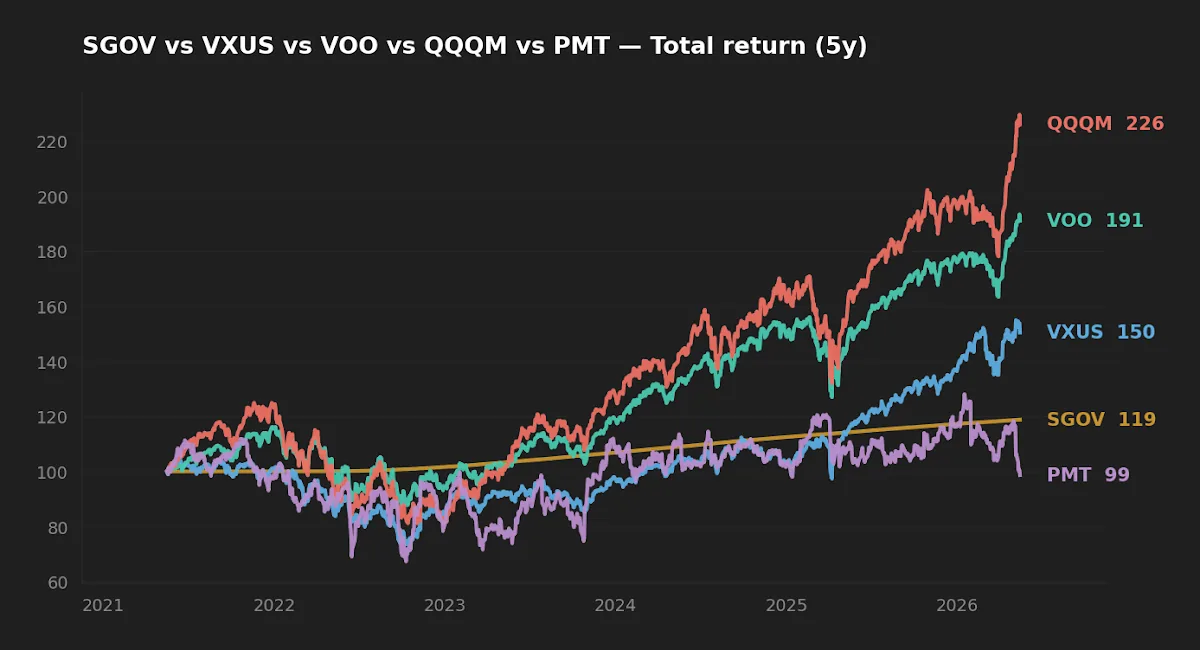
Four funds cover the rough spectrum a long-term investor faces: short-duration Treasuries, international developed-plus-emerging equities, US large-cap, and US large-cap growth concentration. Returns and AUM are pulled from yfinance on 2026-05-16; expense ratios and inception dates are from each issuer's fact sheet.
| Ticker | Expense ratio | AUM | 5Y CAGR | 10Y CAGR | 5Y vol | 5Y max drawdown | Yield | Rule-of-72 doubling (5Y CAGR) |
|---|---|---|---|---|---|---|---|---|
| SGOV | 0.09% | $85.2B | 3.5% | — | 0.2% | −0.0% | 3.9% | 20.6 yr |
| VXUS | 0.05% | $629.1B | 8.5% | 9.7% | 16.0% | −29.4% | 2.8% | 8.5 yr |
| VOO | 0.03% | $1,600.2B | 13.9% | 15.6% | 16.8% | −24.5% | 1.1% | 5.2 yr |
| QQQM | 0.15% | $82.9B | 17.6% | — | 22.3% | −35.0% | 0.5% | 4.1 yr |
Source: yfinance price/return series fetched 2026-05-16; issuer fact sheets linked above for expense ratio, AUM, inception. SGOV and QQQM both inception in 2020, so neither has a 10-year track record.
Doubling time using realized returns
Plug each fund's 5-year CAGR into 72/r:
- SGOV at 3.5% → 20.6 years.
- VXUS at 8.5% → 8.5 years.
- VOO at 13.9% → 5.2 years.
- QQQM at 17.6% → 4.1 years.
At face value, QQQM looks like it doubles in roughly the time it takes to finish a graduate program. The 10-year window — where it's available — moderates the picture: VOO's trailing 10Y CAGR of 15.6% gives a 4.6-year doubling estimate, and VXUS's 9.7% gives 7.4 years. The 10-year numbers are still inside one of the longest US equity bull runs in the post-war record. Sharpe (1991) showed that average active returns must equal the index by arithmetic identity before costs; long-run real index returns for developed equities have historically clustered closer to 5–7% real, not 13–17% nominal. A doubling estimate built on a five-year slice that excludes 2008 and 1973–74 is not a forecast of the next five years.
The Rule of 72 doesn't lie. The number you feed it does.
Inflation is the part the rule omits
Doubling a nominal balance is not the same as doubling purchasing power. With CPI at 3.9% YoY (FRED, as of 2026-04-01), the real version of the rule — 72 divided by (CAGR − inflation) — produces materially different numbers. SGOV's 3.5% 5Y CAGR against 3.9% inflation gives a negative real rate; in real terms it doesn't double on any horizon, it slowly shrinks. VXUS at 8.5% nominal becomes 4.6% real, which pushes real doubling from 8.5 years out to roughly 15.7. VOO at 13.9% nominal becomes 10.0% real → 7.2 years to double real purchasing power. QQQM's 17.6% becomes 13.7% real → 5.3 years.
The 10-year US Treasury yield sits at 4.47% and the fed funds rate at 3.64% (FRED, 2026-05-14 and 2026-04-01). That matters because SGOV's distribution yield essentially tracks short rates: the current 3.9% yield is forward-looking in a way the trailing 5Y CAGR is not. The realized 3.5% includes a long stretch where short rates were near zero. The rule-of-72 estimate based on history understates SGOV's near-term carry; what it doesn't change is the underlying point — short-duration Treasuries are a liquidity sleeve, not a doubling vehicle. Cash equivalents are about not losing, measured in real terms; they shouldn't be asked to compound.
Realized drawdowns and variance drag
The rule treats r as a constant. Real returns arrive with variance, and variance subtracts from compounded outcomes through the well-known gap between arithmetic and geometric mean: g ≈ μ − σ²/2. QQQM's 22.3% annualized 5-year volatility implies a variance drag of roughly 2.5 percentage points before any other friction; VOO's 16.8% implies about 1.4 points. The CAGRs in the table already reflect this drag — they're geometric — but the drag has another consequence the rule hides: the distribution of outcomes around the central estimate widens with σ, and it widens faster for higher-volatility funds.
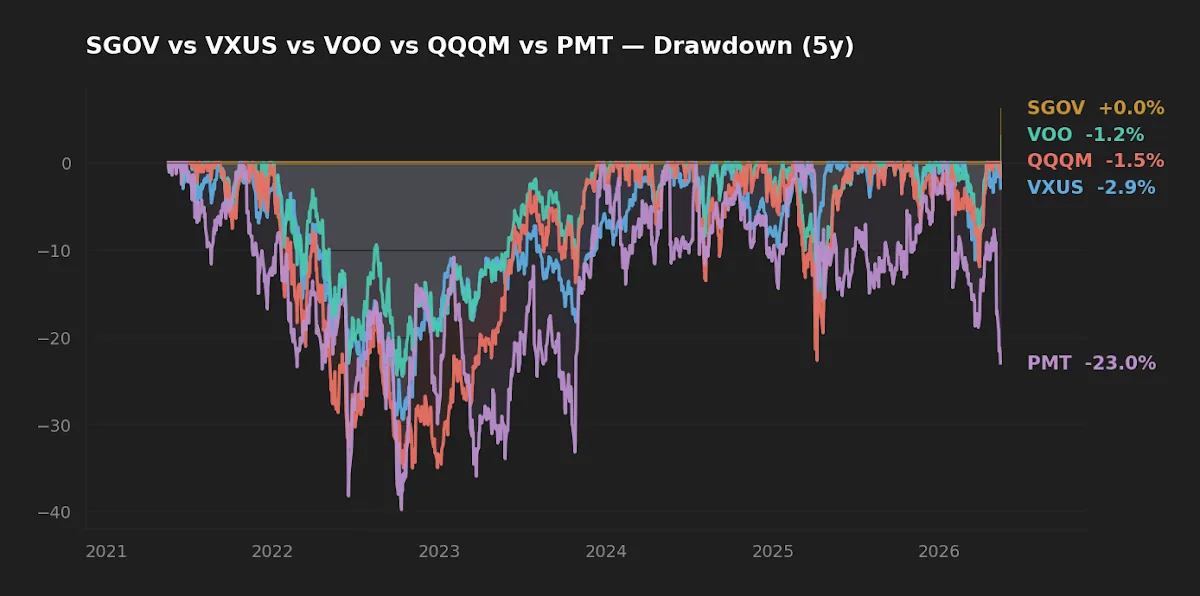
Realized 5-year maximum drawdowns tell the same story from the path-dependent side: SGOV essentially zero, VXUS −29.4%, VOO −24.5%, QQQM −35.0%. A 35% drawdown requires a 54% recovery just to return to the prior peak. For a holder using the rule to plan a doubling, a deep drawdown in the wrong year doesn't just delay the result — it can break the contribution behavior that the plan implicitly assumed (panic selling, contribution pauses, leverage being called). This is where the brutal math behind market crashes intersects the Rule of 72: the arithmetic is correct, but it lives in a world without behavior.
What this analysis can and can't tell us
The honest constraints on the numbers above:
- Sample window. May 2021 to May 2026 is one realization of one regime — post-pandemic stimulus, rapid hike cycle, AI-led mega-cap rally. SGOV and QQQM have no track record outside it. Treating any 5Y CAGR as the expected return for the next decade is a category error.
- Survivorship. The funds analyzed are all large, low-fee, still trading. Funds that closed during the window aren't here.
- Single regime, single starting point. Doubling time is path-dependent for any investor making contributions. A rolling-window analysis (which would need 30+ years of data and isn't available for SGOV/QQQM) would show how unstable the point estimate actually is.
- Pre-tax, pre-friction. The CAGRs are gross of taxes on distributions. VOO's qualified-dividend share is high; SGOV's distributions are ordinary income at the federal level, which compresses its after-tax doubling further for a taxable holder.
Scenarios where each fund actually fits
- Reader in 30s, long contribution runway, equity-heavy core. VOO is the obvious anchor by cost and breadth. Doubling math is a sanity check, not a stock-picking shortcut. See why VOO alone may not be enough for the international tilt argument.
- Reader who wants ex-US diversification. VXUS at 0.05% expense covers ~8,500 holdings outside the US. Its trailing 10Y CAGR is below VOO's, which is the cost of diversification when the dollar and US mega-caps led. Whether that gap persists is a separate question.
- Reader seeking factor concentration in large-cap growth. QQQM is a sector-tilted bet (heavy on tech/communication services), not a market portfolio. A 4.1-year nominal doubling looks attractive; a 35% drawdown without the floor of a market-cap-weighted index is the realized cost.
- Reader sizing a cash sleeve for known liabilities or behavioral buffer. SGOV does what it claims: ~zero drawdown, daily liquidity, current 3.9% yield. It's a liquidity instrument, judged on whether it lets the rest of the portfolio stay invested through a drawdown.
Scoreboard
| Category | Winner | Note |
|---|---|---|
| Cost | VOO (0.03%) | Cheapest by 2 bp over VXUS, 12 bp over QQQM. |
| Realized 5Y return | QQQM (17.6%) | Inception inside the strongest tech regime on record. |
| Realized risk | SGOV (0.2% vol) | Behaves as cash equivalent should. |
| Risk-adjusted long-term core | VOO | Broadest cap-weighted US exposure at the lowest fee, 10Y track record. |
FAQ
Is the Rule of 72 accurate for high returns? It's an approximation tuned to be cleanest near 8%. At 17.6%, the rule estimates 4.1 years; the exact figure is closer to 4.3 years. The error is small relative to the uncertainty in the return itself.
Should I use 5-year or 10-year CAGR? Neither is "right." The 10-year window is longer but still inside one regime. For long-horizon planning, most academic work suggests using long-run averages (real US equity returns around 6–7% over a century) rather than recent trailing returns.
Does it apply to dividends? Only if dividends are fully reinvested and the analysis uses total return. The yields shown are distribution yields — actual compounding depends on whether the holder reinvests them and at what tax cost.
How do I include monthly contributions? The rule doesn't model contributions. A future-value annuity formula does. The simplest sanity check: at 9% nominal, $1,000/month for 10 years grows to roughly $193,000 — contributions matter enormously in the first decade, returns dominate by the third.
Why doesn't this article use a "9% core portfolio" assumption? Picking a fixed expected return invites confirmation bias. The realized 5Y CAGRs for these four funds — calculated from market data, not assumed — are what they are, with the caveats above. Assuming 9% would have produced a more comfortable doubling estimate and a less honest one.
Editor's read
Editor's read
The Rule of 72 is most valuable not as a return target but as a discipline. It forces the question "what nominal return am I assuming, and why?" — and once that number is on the page in real (inflation-adjusted) terms, most retail expectations get smaller. The editor uses the rule the way a navigator uses dead reckoning: a quick estimate good enough to bound the answer, never accurate enough to plan a landing.
Holdings disclosure: The editor holds positions in VOO, VXUS and SGOV at the time of writing; does not hold QQQM. No position changes are implied by this article.
Methodology
Price and total-return data: yfinance, pulled 2026-05-16. CAGRs computed on 5-year (and 10-year where available) trailing windows ending on the fetch date. Volatility annualized from daily log returns. Maximum drawdown computed as worst peak-to-trough decline within the window. Expense ratio, AUM and inception date from each issuer's fact sheet (linked in the data table). Macro reference points: 10-year Treasury yield 4.47% (FRED, 2026-05-14), fed funds rate 3.64% (FRED, 2026-04-01), VIX 17.26 (FRED, 2026-05-14), CPI YoY 3.95% (FRED, 2026-04-01).
This article is for educational purposes and does not constitute personalized financial advice. See full Disclaimer.