
The short version
- Five funds with non-overlapping roles — broad US beta (VOO), large-cap growth tilt (QQQM), dividend-quality (SCHD), ex-US developed and emerging (VXUS), and small-cap value (AVUV) — cover the four exposures most equity portfolios end up implicitly betting against: size, value, international, and dividend quality.
- Over the trailing 5 years the size/value and international sleeves both lagged US large-cap by 5+ percentage points annualized. That isn't a reason to abandon them; it's the realized cost of holding a diversified frame during a single-regime run.
- The framework is most useful as a way to reason about why each sleeve exists. The specific weights matter far less than understanding what each fund actually owns and what it cannot do.
The most useful question is rarely "which ETF is best." It is: which exposures do I want, and which fund implements each one with the least friction? This article walks through a five-fund equity frame — VOO, QQQM, SCHD, VXUS, and AVUV — and the reasoning behind why each one earns a slot. The numbers are pulled from yfinance on 2026-05-16; sources for fund-level details are linked below.
Context: what each fund actually owns
Before any allocation discussion, it helps to be precise about exposures. VOO is the Vanguard S&P 500 ETF — roughly 500 large-cap US companies, weighted by float-adjusted market cap, dominated at the top by the largest mega-caps. QQQM is the Invesco NASDAQ-100 ETF — the 100 largest non-financial Nasdaq listings, currently with a heavy tilt toward technology and communication services. SCHD tracks the Dow Jones US Dividend 100, a rules-based screen for high-quality dividend payers (cash-flow-to-debt, ROE, dividend growth, yield). VXUS holds roughly 8,500 stocks across developed and emerging markets ex-US. AVUV is an actively managed US small-cap value ETF from Avantis, with explicit profitability and value tilts.
The exposures barely overlap. The intersection of VOO and QQQM is meaningful (large-cap US growth), but VOO holds about 500 names versus QQQM's 100 and weights them differently. SCHD is mostly large-cap US value with very little tech exposure — almost the inverse of QQQM. VXUS shares essentially no holdings with the others. AVUV has near-zero overlap with VOO because the S&P 500 caps out before small-cap territory even begins.
The data, as of 2026-05-16
| Ticker | Expense ratio | AUM | Yield (TTM) | 5Y CAGR | 10Y CAGR | 5Y volatility | 5Y max drawdown |
|---|---|---|---|---|---|---|---|
| VOO | 0.03% | $1,600B | 1.1% | 13.9% | 15.6% | 16.8% | −24.5% |
| QQQM | 0.15% | $82.9B | 0.5% | 17.6% | n/a | 22.3% | −35.0% |
| SCHD | 0.06% | $91.1B | 3.3% | 8.2% | 12.7% | 14.4% | −16.8% |
| VXUS | 0.05% | $629B | 2.8% | 8.5% | 9.7% | 16.0% | −29.4% |
| AVUV | 0.25% | $26.2B | 1.3% | 10.8% | n/a | 22.8% | −28.8% |
Source: yfinance pulled 2026-05-16. Macro context: 10-year Treasury 4.47%, Fed funds 3.64%, VIX 17.26, CPI YoY 3.9% (FRED, asof 2026-04 to 2026-05).
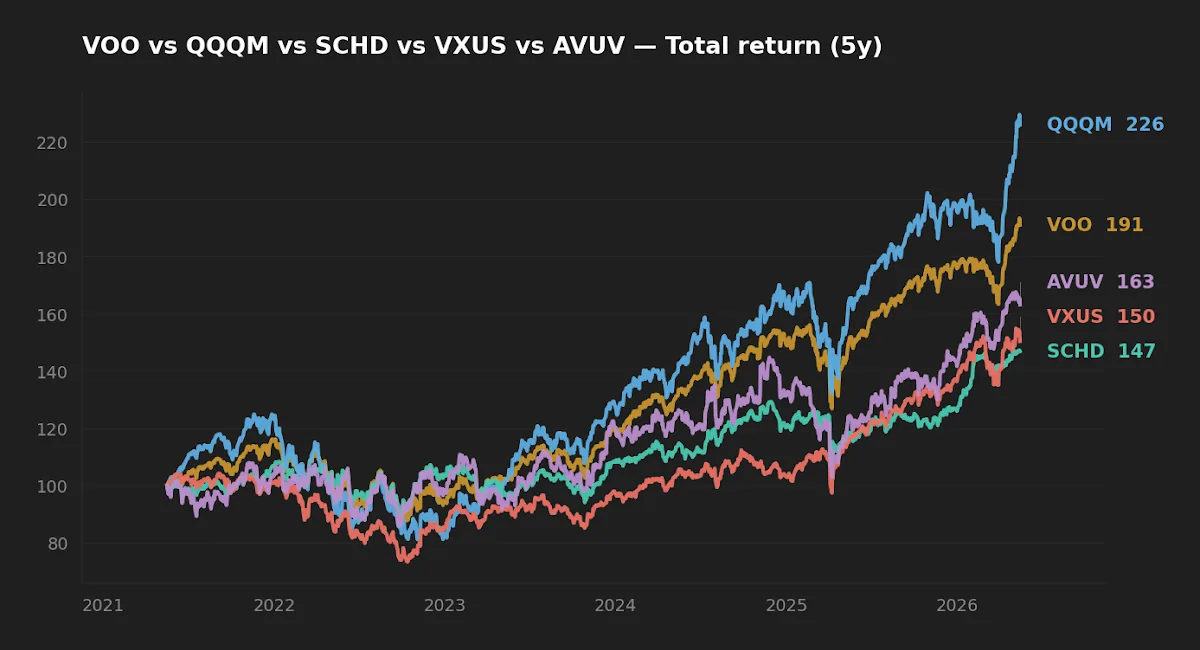
The 5-year window: what actually happened, and what it doesn't prove
Over the trailing five years, QQQM (17.6% CAGR) led, followed by VOO (13.9%), AVUV (10.8%), VXUS (8.5%), and SCHD (8.2%). The gap between the best and worst sleeve is 9.4 percentage points annualized — large enough that someone evaluating each fund on 5-year return alone would conclude that only QQQM and VOO were worth holding.
That conclusion would be a mistake, for two related reasons. First, five years is one regime. The 2021–2026 window was unusually kind to US large-cap growth and unusually rough on long-duration international assets and small-caps. The case for adding AVUV and VXUS rests on factor literature spanning multiple decades and geographies (Fama-French; Asness, Frazzini, and Pedersen), not on the last 60 months. Second, the academic literature itself does not promise that the size/value premium shows up in any particular five-year window. It promises that it has historically been positive over long horizons, with substantial decade-by-decade variation.
One concrete observation from the data: AVUV ran with 22.8% volatility — slightly higher than QQQM's 22.3% — and delivered 10.8% CAGR versus QQQM's 17.6%. On a realized Sharpe basis over this window, the small-cap value sleeve underperformed the Nasdaq-100 sleeve dramatically. The honest read is that the factor premium did not show up in this window. The framework still includes the sleeve because the alternative — concluding that small-cap value is dead based on one regime — is exactly the look-ahead-style mistake the literature warns against.
Realized risk: the drawdowns the framework had to survive
Annualized volatility is a thin description of risk. Drawdown depth and duration tell you what the position actually felt like to hold. Over the past five years, the deepest drawdown for each fund was: QQQM −35.0%, VXUS −29.4%, AVUV −28.8%, VOO −24.5%, SCHD −16.8%.
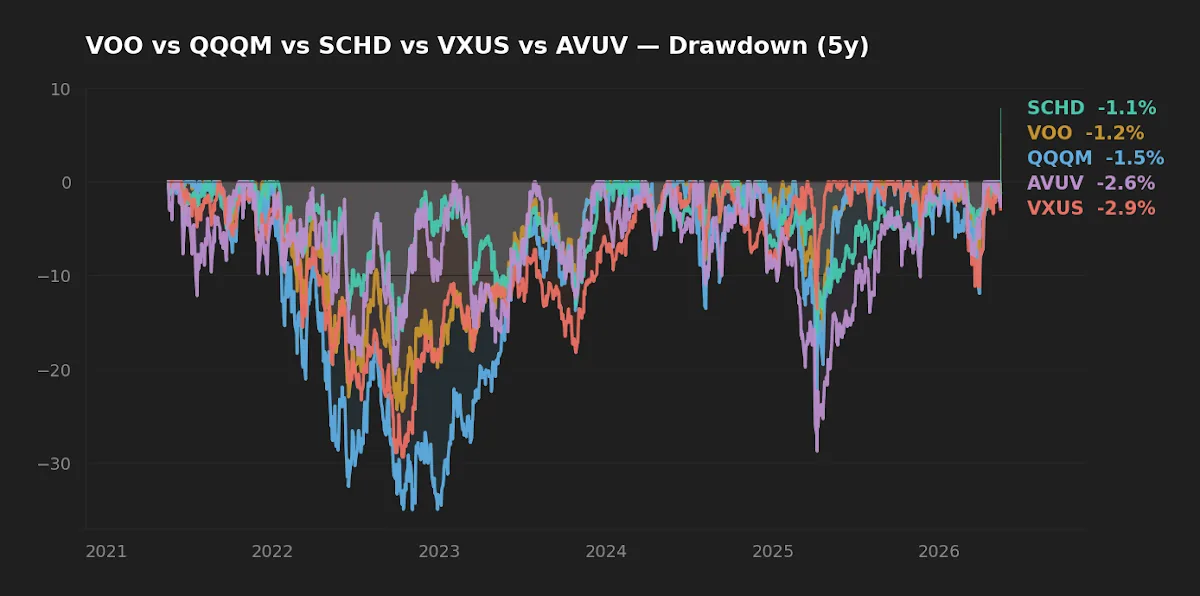
SCHD's drawdown is the headline number worth sitting with. It fell roughly 30% less deeply than QQQM in the same macro regime, despite holding equity. That is not a coincidence — the dividend-quality screen tilts toward profitable, low-leverage businesses that derate less under stress. It is also why SCHD plays a different role than VOO or QQQM in a long-horizon frame: not return maximization, but behavioral stability when the rest of the portfolio is down 25–35%.
The framework's job is not to predict which sleeve will win. It is to keep the investor in the seat long enough that whichever sleeve does win actually compounds.
Cost, capacity, and implementation friction
Expense ratios in this set range from 0.03% (VOO) to 0.25% (AVUV). On a $100,000 portfolio over 30 years at 8% gross, the gap between 0.03% and 0.25% compounds to roughly $66,000 of foregone wealth. The case for AVUV's higher fee is that it is actively managed with explicit value and profitability tilts that a passive small-cap value index does not replicate. Reasonable people disagree on whether that justifies the 22 bp premium over a passive equivalent.
AUM is the second implementation question. VOO ($1,600B) and VXUS ($629B) are too large to face closure risk in any plausible scenario. SCHD ($91B) and QQQM ($83B) are similarly safe. AVUV at $26B is well above the danger zone but worth noting — small-AUM factor ETFs sometimes close or merge, forcing a taxable event for taxable-account holders.
Dividend yield matters mostly because of where it is held. SCHD's 3.3% yield is mostly qualified dividends, taxed at long-term capital gains rates in a US taxable account. VXUS's 2.8% yield includes a meaningful share of non-qualified foreign distributions and carries foreign tax withholding (typically recoverable as a credit, but only in taxable accounts). VOO and QQQM yield very little, which makes them tax-efficient in taxable accounts. AVUV's 1.3% yield includes some non-qualified income from its active screen. The order of operations: dividend-heavy sleeves (SCHD, VXUS) belong in tax-advantaged space first when there is room.
How the sleeves combine: framework, not recipe
The point of the framework is to identify what each sleeve is doing, not to prescribe weights. A reasonable long-term core might allocate the majority to broad US beta (VOO), a meaningful slug to large-cap growth (QQQM), and smaller positions to dividend-quality (SCHD), international (VXUS), and small-cap value (AVUV). The exact percentages depend on age, account type mix, tax situation, and personal tolerance for tracking error versus a market-cap-weighted global benchmark.
One non-obvious effect worth flagging: the more sleeves you add, the more behavioral discipline rebalancing requires. With five funds and rebalancing bands of ±15/±25% on relative drift (after Daryanani 2008), a portfolio that started at neutral weights will hit a band several times per year in volatile regimes. That is fine — the bands are designed to catch material drift — but it means the framework only works if the operator actually rebalances on signal rather than on instinct. A simpler two-fund frame may compound better than a five-fund frame for an investor who will not rebalance.
FAQ
Q: Is small-cap value still worth holding after five years of underperformance?
The factor literature spans 90+ years and multiple geographies; five years of underperformance is within the historical distribution of decade-level outcomes. The honest answer is that no one knows whether the premium will reappear in the next five years or the next twenty. Holding it is a bet that the long-run pattern is closer to true than the short-run pattern.
Q: Why not just hold VOO and skip the diversification?
Because the 2021–2026 regime in which US large-cap dominated is one of several historical regimes. The 2000–2010 decade had VOO essentially flat in nominal terms while international and small-cap value compounded positively. The framework cost over the last 5 years is roughly 2–4 percentage points annualized in opportunity cost; the insurance is against the next decade being different from the last one.
Q: How does SCHD's 3.3% yield compare to the 10-year Treasury at 4.47%?
The Treasury yield is risk-free and locked. SCHD's yield is unlocked equity income that historically grows with corporate earnings, but it comes with equity drawdown risk. They are not substitutes — the comparison only sharpens the point that an investor seeking pure yield in 2026 can do it more efficiently in fixed income than in equity.
Q: Does QQQM duplicate VOO too much to hold both?
Roughly 40–45% of QQQM's holdings by weight overlap with VOO's top names. Holding both is therefore a deliberate overweight to large-cap US growth, not a separate exposure. Whether that overweight is appropriate depends on the investor's view on mean reversion in mega-cap concentration.
Q: Where does an emergency cash or bond sleeve fit?
Outside this comparison. The five funds above are all equity. A long-term core typically pairs equity sleeves with a fixed-income or T-bill reserve sized to the investor's actual cash needs over a 1–3 year horizon — separate from the equity allocation discussion.
What this comparison can and can't tell you
It can tell you what these five funds did over the trailing 5–10 years, where they overlap, what each one costs, and what each one's worst drawdown looked like. It cannot tell you the next 30-year compounding rate of any sleeve, whether the small-cap value premium will recover, or which weights will prove optimal in retrospect. Anyone presenting "the right allocation" with numerical precision is selling something the data does not support.
Scenarios where each sleeve fits
- Reader in 30s, 401(k)-only, no current dividend exposure: A heavy weight to VOO with a smaller satellite tilt to QQQM is the simplest reasonable frame. SCHD adds little in a tax-deferred account where behavioral stability is less the bottleneck.
- Reader in 50s, taxable + IRA mix, focused on income transition: Increase SCHD weight, prefer holding it in the IRA, reduce QQQM weight to dampen drawdown depth as the runway shortens.
- Reader uncomfortable with US-only: A 15–25% VXUS sleeve aligns the portfolio closer to global market-cap weights and reduces single-country regime risk, at the cost of recent performance drag.
Editor's read
The five-fund frame is more useful as a way of thinking than as a recipe. If forced to defend any single decision, the editor leans toward keeping AVUV despite the recent regime — the factor literature is robust enough that one bad five-year window is not evidence the premium is gone. Conversely, SCHD's role is behavioral as much as financial; an investor who would never panic-sell a deep equity drawdown gets less from it than someone who would.
Editor's holdings: The editor holds positions in VOO, QQQM, SCHD, VXUS, and AVUV as part of the long-term core. Specific weights are not disclosed.
Methodology: All return, volatility, and drawdown figures computed from yfinance daily total return series pulled on 2026-05-16; 5-year window covers 2021-05 to 2026-05, 10-year window 2016-05 to 2026-05 where available. Expense ratios and AUM from issuer fact sheets (linked above), retrieved the same day. Macro figures from FRED, asof dates noted inline. CAGR and 10Y figures are unavailable for QQQM and AVUV because both funds were launched after 2016-05.
Related reading: May 2026 Snapshot: Where the Portfolio Stands and ETF Allocation Notes for 2026.
This article is for educational purposes and does not constitute personalized financial advice. See full Disclaimer.