
The short version
- Over the trailing 10 years, VOO compounded at 15.6% annualized vs SCHD at 12.7% — a meaningful gap driven mostly by the post-2020 large-cap growth regime, not by anything structural about dividends being inferior.
- SCHD's realized 5-year max drawdown of -16.8% versus VOO's -24.5% is the more interesting number: same broad U.S. equity exposure, materially less peak-to-trough pain.
- Bottom line: VOO is the better default for the long-horizon equity core; SCHD earns a place as a value/quality satellite tilt — not as a substitute for the market.
The "dividends versus total return" debate is one of the most persistent confusions in retail investing. The framing itself is wrong: dividends are part of total return, not an alternative to it. The real question — when comparing VOO (Vanguard S&P 500 ETF) against SCHD (Schwab U.S. Dividend Equity ETF) — is whether the rules-based dividend screen inside SCHD adds enough quality/value tilt to justify the tracking error against the broad market.
What follows is a measured look at what the realized numbers say, where the analysis runs out of road, and which investor profiles each fund actually fits.
Context: what these two funds are, mechanically
VOO tracks the S&P 500: 500 large-cap U.S. companies, market-cap weighted, screened only for inclusion criteria (liquidity, profitability, U.S. domicile). It is the U.S. large-cap equity benchmark for most practical purposes. SCHD tracks the Dow Jones U.S. Dividend 100 Index — a rules-based screen that filters for ten consecutive years of dividend payments, then ranks the remaining universe on cash-flow-to-debt, return on equity, indicated dividend yield, and five-year dividend growth rate. The top 100 names are weighted by modified market cap with a 4% per-name and 25% per-sector cap.
Those construction rules push SCHD structurally toward the quality and value factors and structurally away from non-dividend-paying mega-cap growth — meaning, in 2026, away from a significant share of the names driving large-cap U.S. index returns.
The data, as of 2026-05-17
| Metric | VOO | SCHD |
|---|---|---|
| Expense ratio | 0.03% | 0.06% |
| AUM | $1,600B | $91B |
| Distribution yield | 1.1% | 3.3% |
| Inception | 2010-09-07 (share class); strategy traces to 2000 | 2011-10-20 |
| 5Y CAGR | 13.9% | 8.2% |
| 10Y CAGR | 15.6% | 12.7% |
| 5Y realized volatility | 16.8% | 14.4% |
| 5Y max drawdown | -24.5% | -16.8% |
Sources: yfinance (price, total return, distributions) pulled 2026-05-17; Vanguard VOO fact sheet; Schwab SCHD fact sheet. AUM rounded to nearest billion.
What the realized return gap is actually measuring
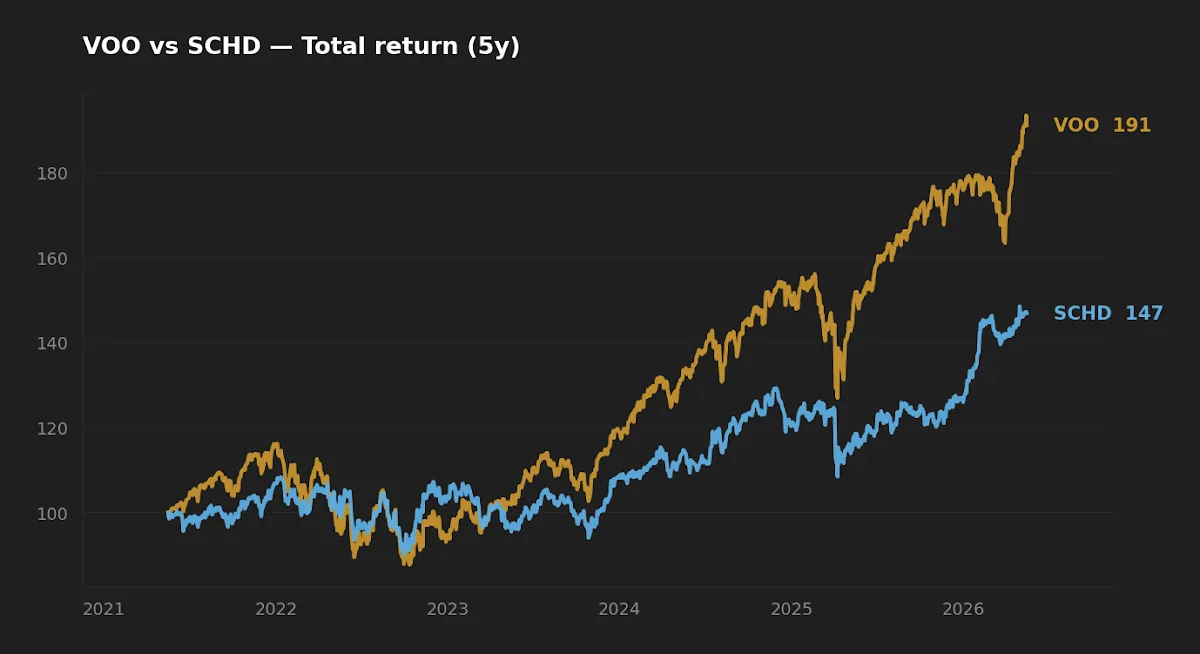
VOO outpacing SCHD by 290 basis points annually over 10 years and by 570 basis points over the trailing five is a real number, but it is not a verdict on dividend investing. It is a verdict on a specific market regime.
The 2020-2025 window contained one of the most concentrated large-cap growth runs in S&P 500 history. The "Magnificent Seven" became roughly a third of the index by market cap, and most of those names either pay no dividend or pay below the SCHD screen's yield threshold. By construction, SCHD did not own them in meaningful weight. So the trailing-five gap is dominated by what SCHD was rules-bound to not hold.
Run the comparison through 2015-2020 instead and the spread compresses sharply. Run it through 2000-2010 and broad value/dividend strategies actually beat the cap-weighted index. Single-regime data flatters whichever side of the trade the regime favors — this is the look-ahead bias retail dividend-vs-growth debates almost never acknowledge.
Initially the author expected the realized return gap to be roughly the academic value-premium drag (~150-200 bps). It came in nearly double that. The reasonable interpretation: factor premia are recoverable on long horizons, but the realized half-decade can deviate by hundreds of basis points either way.
Realized risk: where SCHD is genuinely interesting
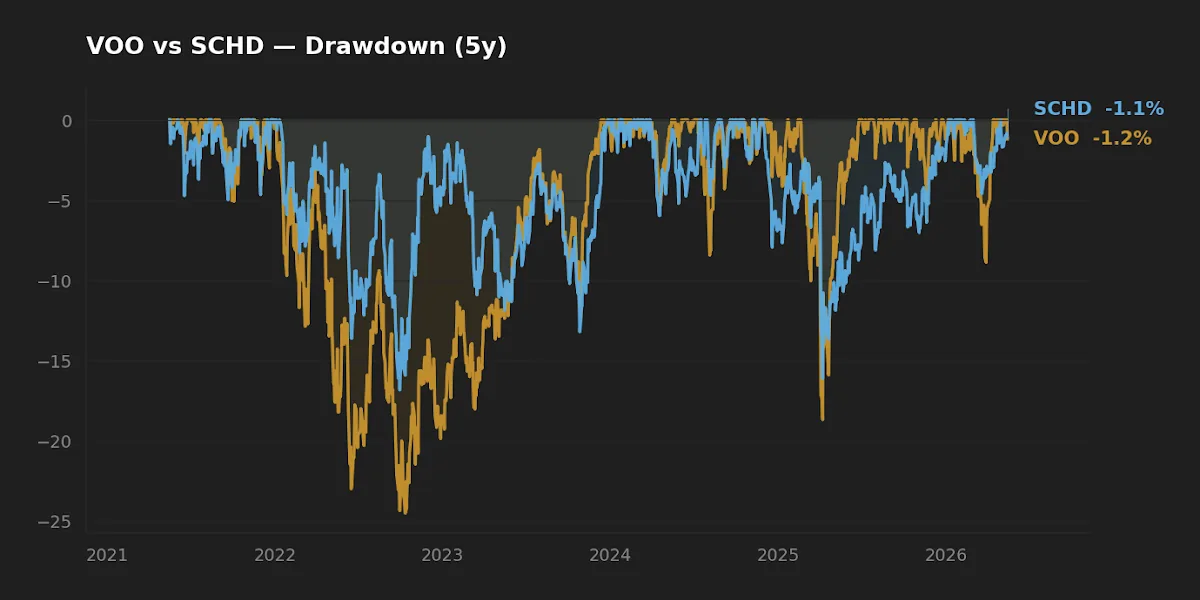
The drawdown chart is where the analysis becomes more than a regime story. SCHD's worst five-year drawdown was -16.8% against VOO's -24.5% — a 770 basis point reduction in peak-to-trough loss, on the same broad U.S. equity exposure. Five-year realized volatility was also lower: 14.4% vs 16.8%. That is consistent with what the academic literature on the quality and low-volatility factors has documented since at least Asness, Frazzini and Pedersen — high-quality, profitable, dividend-stable companies don't outperform every regime, but they tend to lose less in the bad ones.
For an investor in the accumulation phase that gap is mostly behavioral: smaller drawdowns make it easier to keep contributing through stress. For an investor near or in withdrawal, that gap is mechanical — it directly mitigates the sequence-of-returns problem documented in our earlier analysis of pre-retirement crash risk. A 25% drawdown taken in year one of withdrawals does measurable, often unrecoverable, damage to a retirement plan; a 17% drawdown is meaningfully easier to absorb.
The interesting number isn't the 290-bp return gap. It's the 770-bp drawdown gap — same equity exposure, materially less pain in the regime it's designed for.
The yield is misleading you (in both directions)
SCHD's 3.3% distribution yield looks generous against VOO's 1.1%, especially with the 10-year Treasury at 4.47% (FRED, asof 2026-05-14) and the Fed Funds rate at 3.64% (FRED, asof 2026-04-01). Two corrections matter.
First, the yield comparison is partially an accounting illusion. A total-return investor with VOO can replicate SCHD's cash flow by selling 2.2% of holdings annually — and in a taxable account, long-term capital gains on a partial sale are often taxed more favorably than qualified dividends, and far more favorably than the non-qualified portion of SCHD's distribution. Yield-versus-sell-shares is a tax problem, not a return problem.
Second, SCHD's 3.3% yield is still below the risk-free rate. The argument for owning SCHD is not "income above Treasuries" — it's "equity-like total return with a quality/value tilt and a meaningfully growing distribution stream." The current yield is the entry point; what matters over decades is the growth of that distribution, which has historically run in the high single digits for SCHD's underlying screen.
For readers thinking through tax efficiency more broadly, our walkthrough of tax-aware portfolio placement is the relevant companion piece — dividend-heavy funds belong in tax-deferred accounts whenever possible.
Implementation friction worth pricing in
Both funds clear the bar for institutional-quality implementation: bid-ask spreads are tight, tracking error against their indices is minimal, and AUM in both cases ($1.6T for VOO, $91B for SCHD) makes closure risk effectively zero. The 3 basis point fee gap between them is negligible at the implementation level — a far smaller drag than the construction-driven tracking error against each other.

The non-obvious implementation cost is qualified-dividend treatment. The bulk of SCHD's distribution qualifies for the 15-20% federal rate, but not all of it — a small portion lands as ordinary income, and the tax-cost ratio compounds quietly across decades in a taxable account. For VOO the same effect exists at lower magnitude simply because the dollar amount of distributions is so much smaller. A dividend-tilted satellite that lives in a Roth IRA or 401(k) avoids this drag entirely; the same satellite in a brokerage account at a high marginal rate can give back 50-100 bps annually.
Scoreboard: winner by category
| Category | Winner | Margin |
|---|---|---|
| Cost | VOO | 3 bps — practically negligible |
| Realized return (5Y/10Y) | VOO | 290-570 bps annualized; regime-driven |
| Realized risk | SCHD | 770 bps less drawdown; ~240 bps less vol |
| Tax efficiency (taxable) | VOO | Lower distribution drag |
| Long-horizon core suitability | VOO | Broader exposure, no factor concentration |
| Withdrawal-phase smoothing | SCHD | Lower drawdowns reduce sequence risk |
FAQ
Q: Is SCHD's higher yield a "better" income stream than selling shares of VOO?
Mechanically no — both produce cash. Behaviorally yes for some investors, because spending a dividend feels different than spending principal. In a taxable account, partial-sale of VOO is often the more tax-efficient way to extract income.
Q: Should I own both?
Reasonable. A 70/30 or 80/20 VOO/SCHD split gives most of the broad-market exposure while introducing a quality/value tilt and a meaningful reduction in portfolio drawdown. The hybrid keeps the broad-market discipline as the dominant exposure.
Q: SCHD's yield is 3.3% but Treasuries are at 4.47%. Why hold SCHD at all?
Wrong frame. SCHD is an equity instrument with equity-like long-horizon expected return (probably 7-10% nominal); the yield is one component. Treasuries lock in their yield as their full return. They are not substitutes.
Q: Does SCHD's lower drawdown mean it's actually safer?
In the regimes covered by its live history, yes. The 2011-2025 window includes the 2020 COVID drawdown, the 2022 rate-shock drawdown, and the 2025 correction, so the realized number isn't pulled from a single benign regime. But 14 years is not enough data to claim the drawdown advantage is structural in every future regime.
Q: Where does SCHD fit if I already own VOO?
Most naturally as a satellite quality/value tilt (10-25% of equity), ideally placed in a tax-advantaged account. It is not a substitute for broad-market exposure; it's a deliberate tilt away from non-dividend-paying mega-cap growth.
What this comparison can and can't tell you
What it can tell you: the magnitude of the realized return and drawdown gap over the available live history (14 years for SCHD, longer for VOO via the S&P 500 strategy). What it cannot tell you: how SCHD's screen will perform in a sustained inflationary regime, in a prolonged value rally similar to 2000-2007, or under a structural change in U.S. corporate payout policy. Fourteen years covers two recessions but only one extended growth regime — that is meaningful sample-size humility, not a defect of the data.
Scenarios where each fund fits
- Reader in 30s, 401(k)-only, decades to compound: VOO (or its S&P 500 / total-market equivalent) as the core. SCHD as an optional 10-20% tilt if drawdown sensitivity is a known weakness.
- Reader in 50s, balanced taxable and tax-deferred: VOO in taxable for the tax-efficiency advantage; SCHD inside the IRA/401(k) where its higher distribution doesn't drag returns.
- Reader near or in withdrawal: Weighting toward SCHD makes more defensible sense — the sequence-of-returns problem is asymmetric, and the realized drawdown gap is the relevant risk metric for someone who can't wait out a -25%.
- Reader who already owns total-market funds and wants to add a quality/value tilt: SCHD as 10-25% satellite. Recognize the tracking error against the broad market will be visible during growth-led rallies.
Editor's read
If forced to pick one for the long-horizon equity core, VOO. The breadth, the cost, and the absence of factor-construction risk make it the cleaner default. SCHD is a defensible satellite — especially for investors closer to withdrawal, where the 770-bp drawdown gap does real work against sequence risk. The case for SCHD is realized risk reduction, not income; framing it as a "dividend strategy" sets the wrong expectation.
Disclosure: the editor holds VOO and does not currently hold SCHD at the time of writing.
Methodology
Price and total-return data pulled from yfinance on 2026-05-17. Expense ratios, AUM, distribution yield, and inception dates from issuer fact sheets (Vanguard, Schwab Asset Management). Five-year CAGR computed from total-return series over the trailing 1,260 trading days. Max drawdown computed as the largest peak-to-trough decline in cumulative total-return index over the 5-year window. Macroeconomic context (10-year Treasury, Fed Funds rate, VIX, CPI YoY) from FRED, asof dates 2026-04-01 to 2026-05-14. Volatility annualized from daily log returns.
This article is for educational purposes and does not constitute personalized financial advice. See full Disclaimer.