
The short version
- The 4% rule was calibrated by Bengen (1994) on 1926-1976 US data. It never promised safety — only a ~95% historical success rate over a 30-year horizon, conditional on a specific stock/bond mix.
- Sequence-of-returns risk concentrates in the first ten years. A 30% drawdown in retirement year 2 is structurally different from the same drawdown in year 20 — and the 4% rule's worst historical cohorts all share early-decade real losses.
- In 2026, SGOV's 3.94% distribution yield and SCHD's 3.3% yield jointly cover most of a 4% withdrawal without forced principal sales. That regime did not exist in 2021, when SGOV yielded near zero.
The question that arrives in every late-career investor's inbox is the same: will I outlive the money? The 4% rule has carried that conversation for three decades, but the conditions under which it was derived — falling rates, low equity valuations at start dates, no recent 9%+ inflation print — do not describe 2026. The honest answer requires unbundling what the rule actually claimed, where it breaks, and what the present yield curve changes about the arithmetic.
What the 4% rule actually says
William Bengen's 1994 Journal of Financial Planning paper studied rolling 30-year retirement windows from 1926 forward, using a 50/50 to 75/25 US large-cap/intermediate-Treasury mix. His finding: an initial 4% withdrawal, indexed annually to CPI, survived every historical 30-year window — including 1929, 1937, and 1966 starters. The Trinity Study (Cooley, Hubbard, Walz, 1998) extended the work and reported a roughly 95% success rate for 4% across stock-weighted portfolios over 30 years. Neither paper claimed safety. Both reported a conditional historical frequency, calibrated to a single country's price history during a century of rising real GDP.
The rule's robustness is not magic. It compensates for early-retirement market crashes through one mechanism — the equity allocation eventually recovers and outearns the withdrawal — and that mechanism fails when two conditions stack: the early drawdown is deep enough to force outsized share sales at depressed prices, and inflation simultaneously pushes the indexed withdrawal higher. The 1966-1995 cohort, often cited as the rule's stress case, lost real purchasing power throughout the 1970s and only barely survived.
The current data: five-fund withdrawal snapshot
Below are the funds most commonly assembled into a withdrawal-stage allocation: a broad core, a small-value tilt, a Nasdaq sleeve, a quality-dividend sleeve, and a T-bill cash equivalent. All numbers are five-year annualized through 2026-05-17 from yfinance; expense ratios and AUM from issuer fact sheets.
| Ticker | Fund | ER | AUM | Yield | 5Y CAGR | 5Y Vol | 5Y Max DD |
|---|---|---|---|---|---|---|---|
| VOO | Vanguard S&P 500 | 0.03% | $1,600.2B | 1.1% | 13.9% | 16.8% | -24.5% |
| QQQM | Invesco NASDAQ 100 | 0.15% | $82.9B | 0.5% | 17.6% | 22.3% | -35.0% |
| SCHD | Schwab US Dividend Equity | 0.06% | $91.1B | 3.3% | 8.2% | 14.4% | -16.8% |
| AVUV | Avantis US Small Cap Value | 0.25% | $26.2B | 1.3% | 10.8% | 22.8% | -28.8% |
| SGOV | iShares 0-3 Month Treasury | 0.09% | $85.2B | 3.9% | 3.5% | 0.2% | -0.03% |
Sources: Vanguard VOO fact sheet, Invesco QQQM, Schwab SCHD, Avantis AVUV, iShares SGOV.
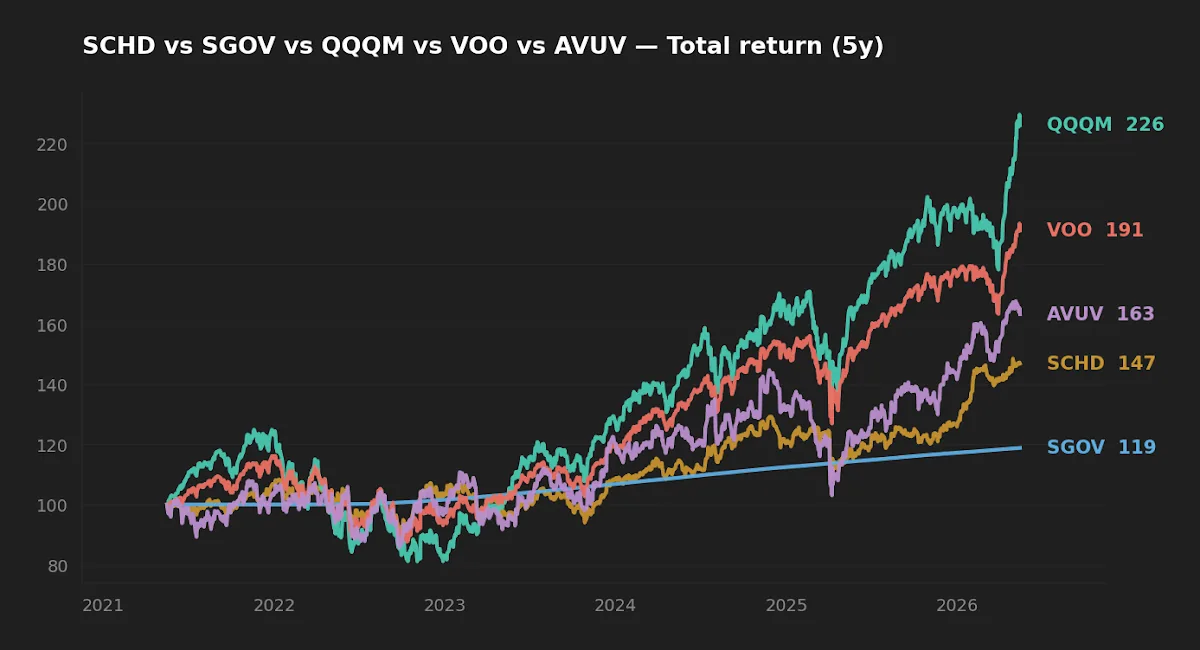
Sequence risk is not symmetric — and that is the whole point
The arithmetic that breaks the 4% rule is not average return. It is the variance in when returns arrive. Two retirees with identical 30-year average returns can end with radically different terminal wealth if one experiences losses in years 1-5 and the other in years 25-29. The first sells more shares at lower prices to fund the fixed real withdrawal; the second has already drawn down a partially-spent portfolio when the loss hits.
Concretely: a portfolio that experiences QQQM's recent 35% peak-to-trough drawdown in retirement year 2, while indexing withdrawals to current 3.95% CPI, is depleting roughly 6.2% of beginning-of-year balance in real terms. That is the 1966-cohort failure mode, modernized. The same drawdown in year 22 is largely irrelevant — the bulk of the withdrawal arithmetic has already happened. For deeper treatment of this asymmetry, see the editor's earlier post on the curse of sequence risk.
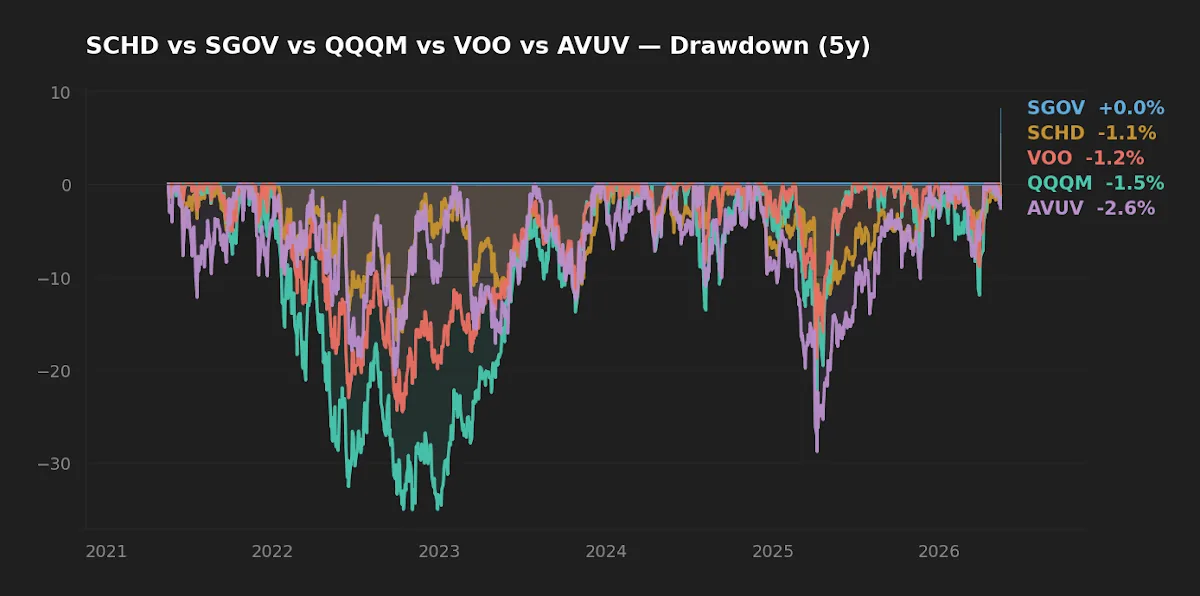
The drawdown chart sharpens the point. SGOV's realized drawdown is effectively zero (-0.03% in five years). SCHD's 16.8% max drawdown is roughly half of QQQM's. For a withdrawing investor, the rank of these funds by sequence-risk contribution is the inverse of their rank by long-horizon CAGR — and the gap is wide enough that the choice of withdrawal-stage sleeves matters as much as the withdrawal rate itself.
The 4% rule's failure mode is not low returns. It is high returns delivered late, after forced selling at the bottom has already permanently shrunk the share count.
What the 2026 yield regime actually changes
Here is the under-discussed shift. In 2021, SGOV's 30-day SEC yield was effectively zero; a retiree needing 4% had to generate essentially all of it from principal sales or equity dividends averaging under 2%. In 2026, SGOV yields 3.94% and the 10-year Treasury sits at 4.47% (FRED, 2026-05-14). A portfolio that holds 30% SGOV, 30% SCHD, and 40% broad equity now produces roughly 3.94% × 0.30 + 3.3% × 0.30 + ~1.5% × 0.40 = 2.78% of cash flow from yield alone, before any share sales.
That number does not eliminate sequence risk. It compresses it. The required principal liquidation drops from a full 4% to roughly 1.2% of beginning-of-year balance — and the portion sold can preferentially come from whichever sleeve has held up best, leaving the drawn-down sleeve to recover. The behavioral effect matters too: an investor whose withdrawal arrives mostly as a coupon rather than a forced sale is observably less likely to capitulate at the bottom.
The cost of this safety is real. SGOV yields 3.94% nominally but, against 3.95% CPI, is roughly break-even in real terms. A 30% short-Treasury sleeve drags long-run real CAGR by perhaps 250-350 bp versus a pure equity allocation. That trade-off is the whole conversation: how much expected terminal wealth to give up in exchange for sequence-risk insurance during the years it actually matters.
Dynamic withdrawal rules: Guyton-Klinger as a starting point
Bengen and Trinity both assumed a fixed-real withdrawal — the retiree spends 4% in year 1 and increases that dollar amount by CPI every subsequent year regardless of portfolio performance. Real retirees do not behave this way, and the academic literature has caught up. Guyton and Klinger (2006, Journal of Financial Planning) proposed "decision rules" that suspend the CPI adjustment after down years and cap upward adjustments after strong years. Their work, replicated in subsequent Monte Carlo studies, raises sustainable initial withdrawal rates by 50-100 bp in exchange for modest spending volatility.
The mechanism is intuitive: a retiree who skips a single inflation adjustment in a bad year preserves disproportionate compounding capacity over the remaining horizon. Vanguard's 2024 research on "dynamic spending" reaches a similar conclusion using a ceiling-and-floor band around a target withdrawal percentage. Neither framework promises guaranteed lifetime income; both reduce the probability of catastrophic depletion at the cost of accepting that real spending will fluctuate within a defined band.
One non-obvious implementation detail
Initially, the editor assumed the binding constraint on long-horizon withdrawal portfolios was equity allocation — more stocks, more expected return, more survival. The data does not support that as cleanly as expected. Once a portfolio crosses roughly 50% equity, additional equity adds expected terminal wealth but little additional sustainability beyond what dynamic withdrawal rules already provide. The binding constraint, especially in the current yield regime, turns out to be the order in which sleeves are drawn down. Selling SGOV during equity drawdowns, and selling equity sleeves during their respective recoveries, captures most of the benefit of Guyton-Klinger guardrails without the spending volatility. This is closer to a bucket strategy than a fixed-percentage rule, and the academic literature increasingly favors it for the sequence-risk window specifically.
Scoreboard: which sleeve fits which job in withdrawal
| Role in a withdrawal portfolio | Best-fitting ETF (5Y data) | Why |
|---|---|---|
| Short-horizon cash buffer (1-3 yrs of spending) | SGOV | 3.94% yield, -0.03% max DD, effectively zero duration risk |
| Yield-generating core (cash-flow substitute) | SCHD | 3.3% yield, 16.8% max DD — lowest among equity sleeves |
| Long-horizon growth (deferrable principal) | VOO | 13.9% 5Y CAGR, broadest diversification, 0.03% ER |
| Factor tilt for very long horizons | AVUV | 10.8% 5Y CAGR with documented small-value loadings |
| High-beta growth (smallest withdrawal-stage allocation) | QQQM | 17.6% CAGR but 35.0% DD — sequence risk is severe |
FAQ
Is the 4% rule still safe in 2026?
"Safe" is the wrong frame. The original research reported a historical success rate, not a guarantee. In current conditions — elevated equity valuations, 3.95% CPI, 4.47% 10Y yield — Morningstar's 2024 update suggests a more defensible starting rate is closer to 3.7%, with dynamic adjustments. The yield regime helps; the valuation regime hurts.
Why use SGOV instead of a high-yield savings account?
For taxable accounts, SGOV distributions are predominantly Treasury interest, which is exempt from state and local tax in most US states. A 3.94% pre-tax yield can equate to a meaningfully higher after-tax yield than a comparable savings rate, depending on the holder's state bracket.
Does a high dividend yield replace the need for principal sales?
Only partially. SCHD's 3.3% yield is qualified dividend income, taxed at long-term capital gains rates in taxable accounts. It reduces but does not eliminate the need to sell shares for a 4% withdrawal. The benefit is behavioral and tax-efficiency, not arithmetic immunity.
How much should sit in QQQM during withdrawal?
The 35% realized max drawdown is the answer's lower bound. A withdrawing investor who needs to sell 4% per year cannot tolerate a sleeve that requires multi-year recovery without other sleeves to draw from. Most practitioner literature caps single-sector or high-concentration sleeves at 10-20% of a withdrawal portfolio.
What does the academic literature say about variable withdrawal rules?
Guyton-Klinger (2006), Blanchett (2014), and Vanguard (2024) converge on the same broad finding: dynamic rules raise sustainable withdrawal rates by 50-150 bp versus fixed-real, in exchange for accepting spending variability within a defined band.
What this analysis can and can't tell you
Five years of return data is a single regime — one inflation shock, one tightening cycle, one AI-led equity rally. It does not contain a 1970s-style sustained inflation period or a 2000-2002-style multi-year equity bear. SGOV, AVUV, and QQQM have inception dates of 2020, 2019, and 2020 respectively; none has been live through a true sequence-risk stress test. The historical 4% rule research used 90+ years of data precisely because shorter windows mislead. Treat current-regime numbers as inputs to a framework, not as predictions of the next 30 years.
Scenarios where each approach fits
Reader 5-10 years from retirement, accumulation-stage: the dynamic-withdrawal literature is informational, not actionable yet. Focus on the bucket structure that will exist on day one of withdrawal, and start building the cash buffer two to three years before retirement begins.
Reader within 2 years of retirement: the SGOV sleeve becomes the binding decision. A 24-36 month cash buffer in SGOV (or equivalents) is what allows the equity sleeves to be left alone during a sequence-risk drawdown. The exact equity mix matters less than the existence of the buffer.
Reader already withdrawing: the question is whether current withdrawals are being funded from yield plus rebalancing, or from indiscriminate share sales. The first is robust; the second is the failure mode the 1966 cohort experienced.

Editor's read
The 4% rule remains a useful anchor — but only as a baseline against which to measure dynamic adjustments. The change worth recognizing in 2026 is that the short-end Treasury yield, at 3.94% via SGOV, is now within striking distance of the withdrawal rate itself. That meaningfully alters the share-sale arithmetic that defined the rule's worst historical cohorts. A withdrawal portfolio that pairs a 24-36 month SGOV buffer with a yield-generating equity core, and reserves high-beta growth for the smallest sleeve, captures most of the academic literature's recommended improvements without abandoning the rule's discipline. The framework matters more than the percentage.
Editor's holdings disclosure: the editor holds positions in SCHD, SGOV, AVUV, and VOO at the time of writing, and does not hold QQQM. Holdings sizes are not disclosed.
Methodology: price and return data sourced from yfinance, retrieved 2026-05-17. Expense ratios, AUM, and inception dates from each issuer's fact sheet. Macro figures (10Y Treasury, Fed Funds, CPI) from FRED, retrieved 2026-05-16. Five-year CAGR, volatility, and max drawdown computed on daily total-return series from 2021-05-17 to 2026-05-17. Sequence-risk discussion follows Bengen (1994), Cooley/Hubbard/Walz (1998), Guyton-Klinger (2006), and Vanguard dynamic-spending research (2024).
This article is for educational purposes and does not constitute personalized financial advice. See full Disclaimer.