
The short version
- The greatest risk to a 30-year portfolio isn't a crash; it's the quiet stretch around years five to ten when nothing dramatic happens and the holder reaches for excitement.
- Lower-volatility holdings (SCHD, SGOV) can be psychologically harder to hold than high-momentum ones precisely because there are fewer emotional inflection points — they get sold during plateaus, not panics.
- Surviving the plateau is mostly a structural question — automation, written intent, pre-committed rebalancing bands — not a willpower question.
Most long-horizon portfolios don't die in a crash. They die quietly, somewhere around year seven, when the index has gone sideways for eighteen months, the contributions have started to look small relative to the balance, and the holder begins to wonder whether there might be a more interesting use of the money. The behavioral evidence — Dalbar's annual studies, Vanguard's advisor-alpha work, and a long line of academic research on the investor return gap — keeps pointing back to the same uncomfortable conclusion: the median equity investor underperforms the funds they own by two to three percentage points a year, almost entirely because of decisions made during boring periods, not panicked ones.
This piece is about the boring period — what to expect, what the data actually looks like inside that supposedly "flat" decade, and which structural defenses tend to survive contact with a real human being.
Context: what a plateau actually is
The plateau is not a market regime. It's a behavioral regime. From the inside it feels like the market is doing nothing; from the outside, the chart usually shows a 6–12% drawdown that took a year or more to recover, embedded inside a longer-term uptrend. Over the last twenty years, the S&P 500 has produced multiple stretches of 18–30 months where rolling returns landed in the low single digits — none of them are visible on a 30-year log chart, but each one was lived through in real time, monthly statement by monthly statement.
The asymmetry matters because compounding is back-loaded. Most of a 30-year terminal balance is generated in the final third, when the base is already large. Decisions made in the middle third — to abandon, to chase, to "take a break and re-enter" — sit upstream of that compounding and tend to be expensive in ways that don't reveal themselves for another fifteen years. The editor explored the distribution of long-horizon outcomes in more detail in The Final-Decade Asymmetry.
The four ETFs against which boredom usually gets tested
The figures below are pulled from yfinance on 2026-05-17. Fee and AUM are cross-checked against issuer fact sheets; 5Y and 10Y CAGR are total return in USD; max drawdown is the largest peak-to-trough on daily closes over the trailing five years. Macro context (FRED, asof 2026-05-14): the 10-year Treasury yields 4.47%, the Fed funds rate sits at 3.64%, and the VIX is at 17.26 — a calm regime by historical standards, which is itself a boredom-conducive environment.
| Ticker | ER | AUM | Yield | 5Y CAGR | 10Y CAGR | 5Y Vol | 5Y MaxDD |
|---|---|---|---|---|---|---|---|
| VOO | 0.03% | $1,600B | 1.1% | 13.9% | 15.6% | 16.8% | -24.5% |
| QQQM | 0.15% | $82.9B | 0.5% | 17.6% | n/a | 22.3% | -35.0% |
| SCHD | 0.06% | $91.1B | 3.3% | 8.2% | 12.7% | 14.4% | -16.8% |
| SGOV | 0.09% | $85.2B | 3.9% | 3.5% | n/a | 0.2% | -0.0% |
Sources: yfinance for price/return; Vanguard, Invesco, Schwab and iShares fact sheets for fees, AUM, and inception; FRED for the macro reference rates. QQQM and SGOV launched in 2020, so their 10Y CAGR does not yet exist.
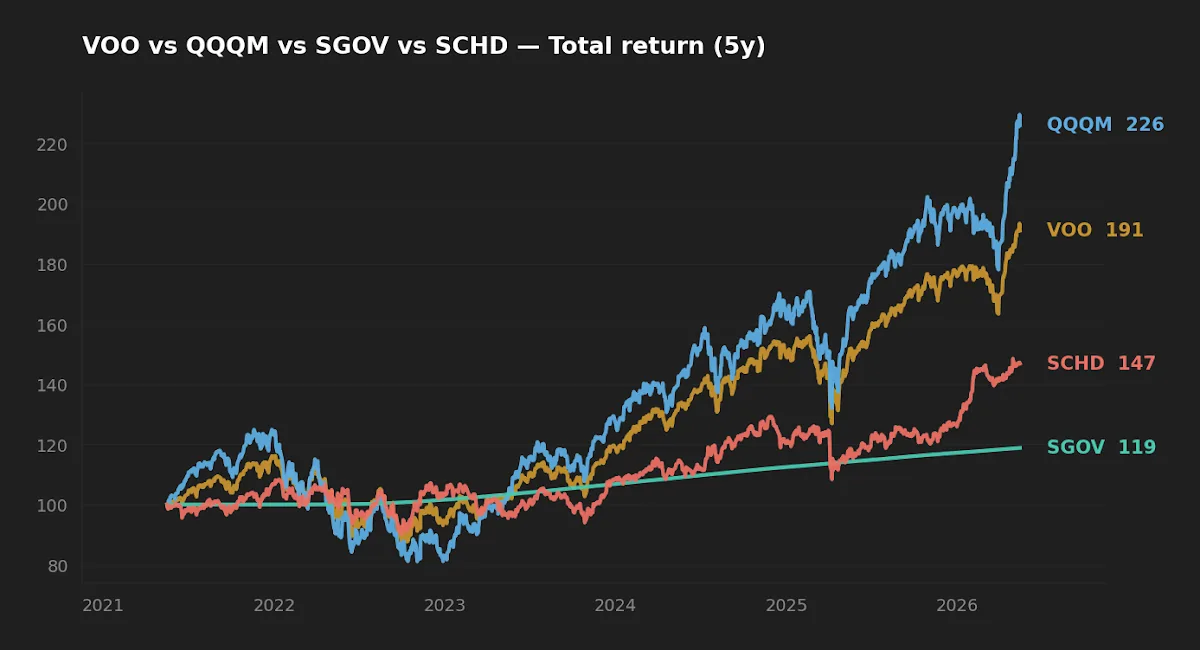
What the smooth-looking line hides
The normalized return chart looks tidy at the resolution of five years. Zoom in and the picture changes. The same QQQM line that ends roughly 125% above its starting point spent most of 2022 underwater on a year-to-date basis, gave back more than a third of its value peak-to-trough, and underperformed SCHD for stretches of six months at a time. VOO ran -24.5% off its high in the same window. SCHD, with a more defensive factor profile, only printed a -16.8% drawdown — but it also trailed both peers during the 2023–24 large-cap-tech leadership phase, and those eighteen months of relative underperformance felt longer to anyone watching the spread.
None of those interim sequences are visible from the endpoints. That's the actual hazard of long-horizon investing: the data summary is benign, but the path was not, and the path is what the holder lived through.

Realized risk: drawdown duration matters more than depth
The drawdown chart below stacks the four funds on a shared axis. The headline ranking is the obvious one — QQQM > VOO > SCHD > SGOV in worst-case depth. What's less obvious, and more behaviorally consequential, is drawdown duration. SCHD's recovery from its 2022 low took roughly fifteen months; VOO took about eleven; QQQM took longer still. Investors rarely sell at the bottom of a -25% move; they sell at month nine of a recovery that hasn't happened yet, when boredom has matured into doubt.
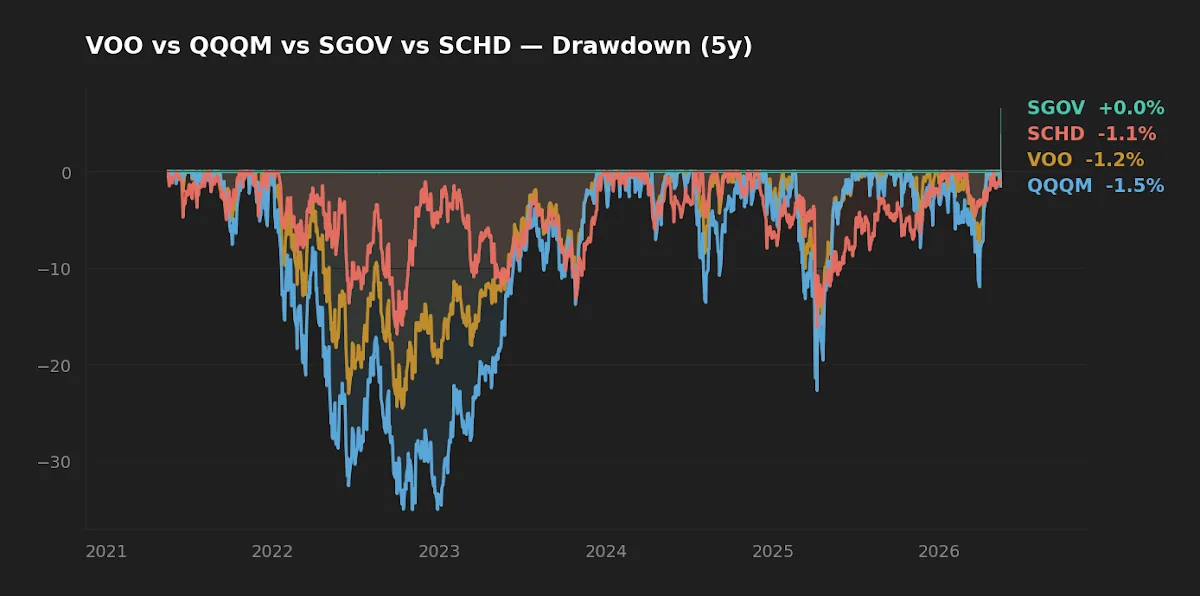
This is why the editor treats SGOV as a position rather than a parking lot. At a 0.2% trailing volatility and a 3.9% yield within shouting distance of the 10-year Treasury (4.47%, FRED, asof 2026-05-14), it functions as the part of the portfolio that does not generate decisions during the plateau years. A reserve sleeve the holder isn't tempted to redeploy is structurally more valuable than one that pays slightly more but invites tinkering.
The boredom asymmetry no one talks about
The conventional framing — high-vol assets are "harder to hold" — is only half right. A holding produces a behavioral cost every time it forces the investor to make a decision. High-volatility funds force loud decisions: panic selling at lows, FOMO buying at highs, tax-loss harvesting, re-checking the position weekly. Low-volatility funds force quieter, more dangerous decisions: the slow conviction that nothing is happening, the gradual reallocation toward "more interesting" ideas, the lump-sum withdrawal that's "only this once."
Initially the editor thought of SCHD and SGOV as the "low-behavioral-risk" pair in a long-term core. Watching real holders across multiple cycles, the asymmetry shifted: the panic risk on QQQM is loud and well-studied, and most disciplined investors have already built defenses for it. The attrition risk on a dividend or T-bill sleeve is quieter and almost entirely undefended. The lesson is not "own less volatility." The lesson is that the boredom defense and the crash defense are two different problems, and most retail portfolios are engineered for only the second.
QQQM and VOO tend to get sold during crashes. SCHD and SGOV tend to get sold during plateaus. The data summary of each event looks different; the behavioral leakage compounds the same way.
Three structural defenses that survive the middle years
None of these are heroic. They work because they remove the requirement for willpower on a Tuesday in March of year seven.
- Automate the boring layer. Standing transfers, automatic dividend reinvestment, and pre-set rebalancing bands (the editor uses the ±15% relative / ±25% absolute thresholds documented in Daryanani 2008 and revisited in Vanguard's 2024 rebalancing research) take the monthly decision off the table. If the system runs without you, boredom cannot route through you into a trade.
- Track inputs, not balance. The contribution rate, the household savings rate, and the realized tax-cost ratio are all under your control. The balance is not. Investors who anchor on inputs report fewer plateau-induced exits in the survey literature; investors who anchor on balance are more likely to act on the absence of motion. See The Curse of Sequence Risk for the related case where late-cycle balance-anchoring is most expensive.
- Write the "why" down once, re-read it twice a year. A two-sentence statement of purpose — what the portfolio is for, who it serves, what would have to be true to change the plan — does almost all of the work that financial advisors charge for. Having to overrule a written commitment is, in practice, much harder than drifting away from an unwritten one.
FAQ
How long does the boredom plateau typically last?
There isn't a fixed window, but the long-horizon equity datasets (Shiller, Dimson-Marsh-Staunton) show multiple historical 5–10 year stretches where real returns landed below long-term averages. Plan for the possibility, not for the average.
Is rebalancing the same as "doing something"?
No. Rebalancing is the execution of a pre-committed rule. The hazard to avoid is discretionary action triggered by feelings — performance-chasing, abandoning a sleeve, or going to cash on a hunch.
Does adding more tickers help with boredom?
Usually not. More positions create more decision surface and more opportunities for fee, tax, and behavioral leakage. A simpler portfolio that the holder will actually leave alone beats a more elegant one that invites weekly attention.
How should the cash sleeve be sized during a plateau?
This is personal and depends on horizon, income volatility, and tax bracket. A working rule of thumb is a multi-year emergency reserve in T-bill instruments like SGOV, then a target equity allocation the holder is willing to leave untouched through a -30% drawdown. The number you can hold through stress is the right number.
Can backtesting help with the psychological side?
Partially. Running historical drawdown sequences against your actual allocation — there's a walkthrough in the editor's Claude backtesting guide — at least calibrates expectations. It does not substitute for the lived experience of watching a balance go flat for eighteen months.
What this analysis can and can't tell you
Five years of price data and a single business cycle do not constitute robust evidence about long-horizon behavior. The 2020–2025 window covered one COVID-driven drawdown, one inflation-driven drawdown, and one AI-driven rally. It did not include a 1970s-style decade of negative real returns, a Japanese-style multi-decade deflationary stretch, or a 2008-style credit event. CAGR figures for QQQM and SGOV cover funds that have only existed since 2020; their 10-year track records do not yet exist. Apply the framework, not the back-test.
Key takeaways
- The decisive risk in a 30-year plan is behavioral, not market-mechanical. The boring middle is where the damage gets done.
- Low-volatility holdings (SCHD, SGOV) carry their own behavioral risk — quiet attrition rather than panic selling. Designing only for crashes leaves that flank uncovered.
- Structure beats willpower. Automate, write down the intent, and put rebalancing on rules rather than mood.
- Drawdown duration is the behavioral variable; depth is the marketing variable. Recovery length is what actually breaks holders.
- Boredom is not the absence of work. It is the work.
Editor's read
Of the four funds on the table, the editor leans toward SCHD as the equity sleeve for an investor who has flagged behavioral risk as their dominant concern — not because the realized return is highest (it isn't) but because the lower 14.4% volatility and shorter recovery profile produce fewer behavioral inflection points across a decade. SGOV pairs with it as the reserve that explicitly does not invite redeployment. VOO and QQQM are excellent vehicles in their own right; whether they fit depends less on the spreadsheet than on the holder's tolerance for the path. The editor holds positions in VOO, SCHD and SGOV at the time of writing and does not currently hold QQQM.
Methodology: total-return CAGR, trailing volatility, and rolling drawdown computed in Python from yfinance daily adjusted-close data, fetched 2026-05-17. Fee, AUM, inception, and yield figures cross-checked against the respective Vanguard, Invesco, Schwab, and iShares fact sheets. Macro reference data from FRED (10Y Treasury, Fed Funds, VIX, CPI), asof dates noted inline. Window analyzed: trailing five years; trailing ten years where available.
This article is for educational purposes and does not constitute personalized financial advice. See full Disclaimer.