
Photo by Dave Weatherall on Unsplash
The short version
- A 2x daily-reset ETF such as QLD does not deliver 2x the annual return of the Nasdaq-100. It delivers roughly 2x of each daily return, compounded — a path-dependent number that diverges from "2x annual" whenever the underlying moves.
- QLD's structural cost in May 2026 stacks a 0.95% expense ratio, an embedded financing cost tracking the fed funds rate (3.64%), and a volatility-decay term that scales with realized variance. At QQQ's recent 22.3% realized volatility, the three together run on the order of 9.6% per year.
- The 2010–2021 regime of near-zero short rates and mid-teens realized vol was the friendliest environment imaginable for these products. The 2026 regime — fed funds at 3.64%, ten-year at 4.47%, CPI at 3.9% — is materially less friendly, and the long-sample backtests built in the old regime do not adjust for that.
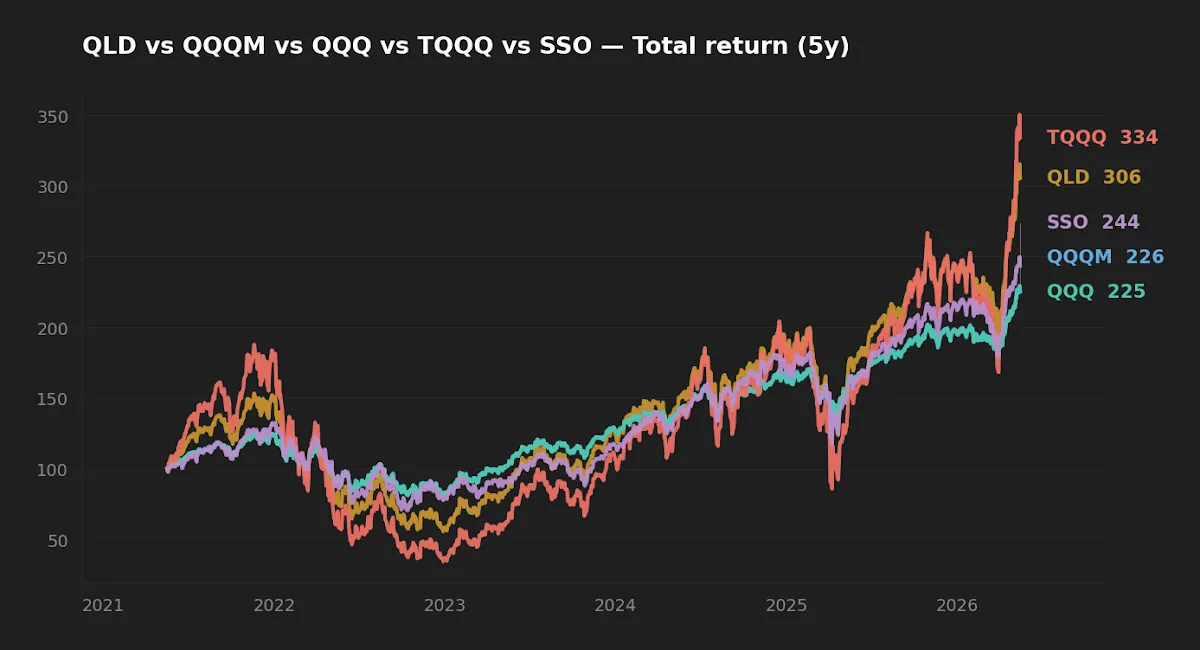
The question is not whether a 2x leveraged ETF can beat its 1x counterpart in a bull tape — it clearly can, and QLD's last five years prove it. The harder question is what daily-reset leverage actually costs in fees, financing, and volatility decay across a full cycle, and whether that cost is being honestly compared with the returns it produces. With the fed funds rate at 3.64% (FRED, asof 2026-04-01) and ten-year Treasuries at 4.47% (FRED, asof 2026-05-14), the answer in 2026 is not the answer it was in 2019.
This piece works through QLD (ProShares Ultra QQQ) as the canonical 2x example, with SSO (2x S&P 500) and TQQQ (3x Nasdaq-100) as extensions. The framework generalizes to every daily-reset leveraged equity ETF; only the magnitudes change.
What daily reset actually means
QLD is structured to deliver 200% of the daily total return of the Nasdaq-100, before fees, by holding a basket of index swaps and futures collateralized by short Treasuries. The exposure is rebalanced at the close of every trading day. This single design choice — daily reset, not period reset — drives almost everything that follows.
"Daily 2x" does not compound to "annual 2x" in any market that moves around. The compounded return of a daily-rebalanced 2x exposure differs from twice the index's compound return by a term that depends on realized variance. Over a year of typical Nasdaq-100 volatility, that term is not a rounding error.
Fund snapshot
| Ticker | ER | AUM | Inception | Yield | 5Y CAGR | 5Y Vol | 5Y MaxDD |
|---|---|---|---|---|---|---|---|
| QQQM | 0.15% | $82.9B | 2020-10-13 | 0.5% | 17.6% | 22.3% | −35.0% |
| QQQ | 0.18% | $440.3B | 1999-03-10 | 0.4% | 17.6% | 22.4% | −35.1% |
| SSO (2x S&P) | 0.87% | $7.3B | 2006-06-19 | 0.7% | 19.6% | 33.7% | −46.7% |
| QLD (2x QQQ) | 0.95% | $12.0B | 2006-06-19 | 0.2% | 24.9% | 44.8% | −63.7% |
| TQQQ (3x QQQ) | 0.82% | $31.3B | 2010-02-09 | 0.5% | 27.0% | 66.6% | −81.7% |
Source: yfinance pulled 2026-05-16; expense ratios and AUM cross-checked against issuer fact sheets — Invesco QQQM, Invesco QQQ, ProShares QLD, ProShares SSO, and ProShares TQQQ. CAGR, volatility, and max drawdown are 5-year measures from yfinance daily total-return series.
The three drags, made concrete
Most retail framing treats the expense ratio as the main cost of leveraged ETFs. It is the smallest of three.
1. Expense ratio. QLD's stated ER is 0.95% versus QQQM's 0.15% — an 80 bp gap. SSO is 0.87%; TQQQ is 0.82%. Important, but not the headline.
2. Embedded financing cost. To deliver 2x exposure on $1 of capital, QLD's swap counterparties have to fund the additional $1 of synthetic exposure at a rate close to fed funds or SOFR. That cost is priced into the swap and borne by the fund — and ultimately the holder — even though it never appears on the expense-ratio line. The economic effect is equivalent to borrowing $1 at the short rate. At fed funds near zero (2009–2015, 2020–2022) this cost was negligible. At 3.64% in May 2026 it is roughly 3.6% per year for a 2x product and roughly 7.3% for a 3x.
3. Volatility decay. For a daily-rebalanced k-times leverage product on an asset with annualized realized volatility σ, the long-run drag relative to k times the index's compound return is approximately k(k−1)σ²/2 per year. For QLD (k=2) at QQQM's 22.3% realized vol, the drag is (0.223)² ≈ 5.0% per year. For TQQQ (k=3) the term is 3σ² ≈ 14.9%. This is not a flaw specific to ProShares. It is the structural consequence of daily compounding under volatility, identical to the gap between any geometric and arithmetic mean. It applies to every daily-reset leveraged product equally.
Stacking the three at 2026 conditions for QLD: 0.95% expense + ~3.6% financing + ~5.0% vol decay ≈ 9.6% per year of structural drag relative to a hypothetical zero-cost 2x exposure to QQQ. That is the hurdle 2x leverage must clear before delivering any net advantage over simply holding QQQM at 1x. The same math applied to TQQQ produces ~23% per year of drag; to SSO at the S&P's lower realized vol, roughly 7–8%.
The 2010–2021 regime of zero short rates and historically low realized volatility was uniquely friendly to daily-reset leveraged ETFs. The math has changed. The back-tests built in the old regime have not.
What the 5-year track record actually shows — and doesn't
The yfinance data above tells a striking story on its face. QLD's 5-year CAGR is 24.9% versus QQQM's 17.6%. TQQQ's is 27.0%. SSO returned 19.6% versus a roughly 13–14% large-cap baseline. If a reader stops there, the leverage case looks closed.
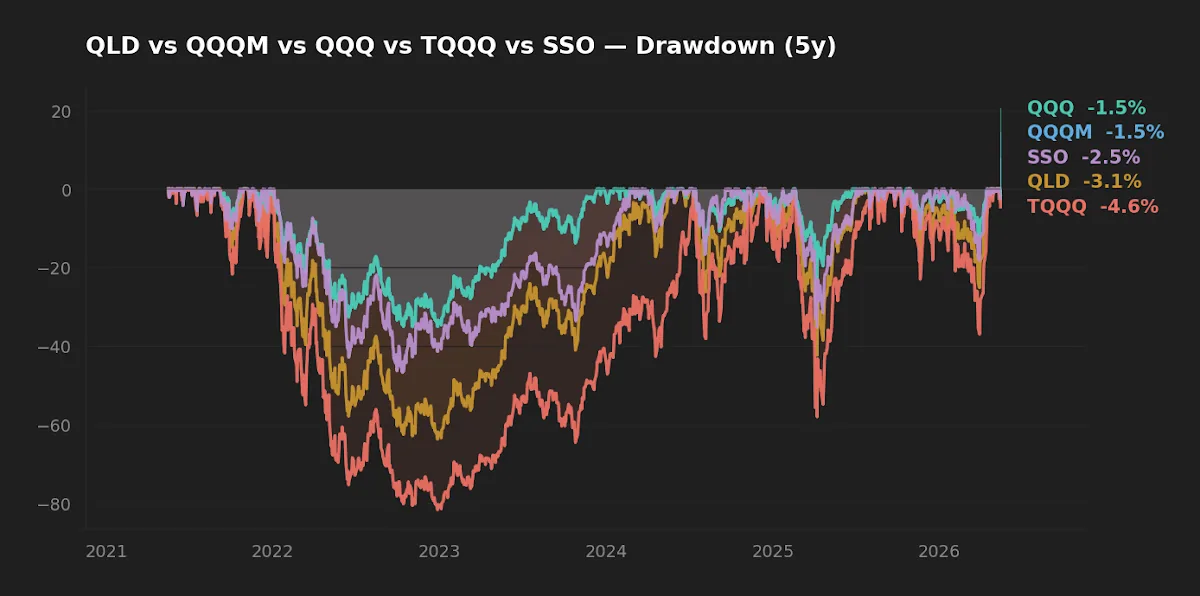
The drawdown chart shows what the CAGR line hides. QLD's 5-year max drawdown is −63.7%; TQQQ's is −81.7%. Recovery from −63.7% requires +176% to break even; from −81.7% it requires +446%. The 5-year window also covers a tape in which the underlying produced a 17.6% CAGR — a return profile near the top of the long-run historical distribution. Under that condition, daily-reset leverage outpaces drag. Under an 8% underlying return and 25% realized vol, the math reverses: QLD's expected compound return falls below QQQM's.
The honest framing is not "QLD won, therefore leverage works." It is "QLD won during a favorable regime in both return and volatility, and even then it took a 64% drawdown that would have ended most investors' holding period." This is precisely the kind of single-regime risk that any honest backtest discussion has to grapple with, and it is why risk-management discipline matters more than CAGR ranking.
The "satellite" framing, examined honestly
The standard retail proposal is to hold a 5–10% QLD satellite alongside an unleveraged core: even if QLD halves, the portfolio only loses 2.5–5%. That argument is mathematically correct on the downside. It skips the upside question.
If unleveraged QQQM returns 8% per year going forward — closer to historical large-cap norms than the 17.6% of the last five years — QLD at 2x daily reset minus drag returns roughly 8%·2 − 9.6% ≈ 6.4%. That is below the 1x return it was meant to enhance. Under those conditions the satellite reduces the portfolio's compound return rather than accelerating it. The satellite framing only works if the underlying delivers high enough returns at low enough realized volatility to overcome drag. The 2010s met that bar. The 2026 regime — fed funds 3.64%, ten-year 4.47%, CPI 3.9% — makes it a much harder assumption to defend.
Scoreboard
| Category | Winner | Notes |
|---|---|---|
| Cost | QQQM | 80 bp explicit gap, ~3.6% implicit financing on top. |
| Realized 5Y return | QLD / TQQQ | Real but regime-dependent — bull tape, low-to-moderate vol. |
| Realized 5Y risk | QQQM | Half the volatility, half the drawdown of QLD. |
| Long-term core suitability | QQQM | Daily reset is incompatible with multi-decade holding by design — the issuer prospectus says so. |
Frequently asked questions
Doesn't QLD's full-sample track record prove that 2x leverage works long term?
It proves QLD outperformed QQQ over windows characterized by near-zero policy rates, mid-teens to low-20s realized vol, and a once-in-a-generation tech bull market. It does not prove the structure delivers excess return in a different regime. The 2026 macro picture — fed funds 3.64%, ten-year 4.47%, CPI 3.9% (FRED, asof April–May 2026) — is materially different from the conditions that produced the bulk of the backtest.
Is volatility decay overstated?
The decay term is a mathematical identity, not an opinion. It is approximately k(k−1)σ²/2 per year for daily-reset leverage k on an asset with annualized realized vol σ. What is debated is the value of σ going forward. In low-vol regimes decay is small; in high-vol regimes it dominates. The decay is real; its magnitude is regime-dependent.
Why does the fed funds rate matter for an ETF I'm not buying on margin?
Because the fund itself is borrowing — synthetically, through swap and futures financing — to deliver the second (or third) unit of exposure. That financing cost is embedded in swap pricing and reduces NAV daily. It does not appear on a fee statement, but the holder bears it as if they had borrowed at the short rate themselves.
Can I time entries to avoid the drag?
Vol decay and financing accrue continuously regardless of entry point. Timing affects the underlying-index return component, not the structural drag. An investor who can reliably time the Nasdaq-100 has a more valuable skill than choosing leveraged versus unleveraged exposure — and most who believe they can have not backtested against an honest benchmark with taxes and slippage.
What about TQQQ and SSO — same conclusions?
Same framework, different magnitudes. TQQQ's decay term scales as 3σ², which at 22% vol is about 14.9% per year, and its financing scales with 2× the short rate, roughly 7.3%. Total structural drag for TQQQ at 2026 conditions approaches 23% per year before any underlying return. SSO sits between QLD and QQQM in cost and on a less volatile underlying; its drag is lighter, but the daily-reset structure and recovery math still apply.
What this analysis can and can't tell you
The drag math relies on three inputs that are not constants: the fed funds rate (changes with policy), realized volatility (changes with regime), and the index's compound return (unknowable in advance). The 9.6% headline figure is a snapshot under May 2026 conditions. The framework is what matters; readers with different forecasts can recalculate. What the data also cannot tell you is whether the 2010–2021 regime returns. If sustained zero rates and ultra-low vol come back, the satellite case improves. The editor's read is that it is not the way to bet, but reasonable investors can hold the opposite view — this is a probabilistic judgment, not a certainty.
Scenarios where each fits
- Long-horizon core investor, 20+ year frame. QQQM (or VOO, depending on Nasdaq concentration tolerance). QLD does not belong in the core under any honest reading of the math; the daily-reset structure was not designed for multi-year holding and the prospectus says so.
- Tactical trader with a defined short-horizon thesis (weeks to months). QLD or TQQQ are among several instruments that can express that view. Whether they are the best ones depends on tax setup and broker mechanics. Not the reader this blog writes for.
- Investor considering a 5–10% satellite as a long-term tilt. The math does not support it at 2026 rates and current vol. The structural drag plausibly consumes the leverage advantage. Burden of proof is on the leverage case.
- Investor already using margin or HELOC for equities. Layering an embedded-leverage ETF on top compounds the same exposure twice and the financing cost twice. This is the most predictable way to get hurt by these instruments.
Editor's read
The editor does not hold QLD, SSO, TQQQ, or any daily-reset leveraged ETF, and the analysis above is the reason. The case that worked in the 2010s rested on two conditions — near-zero short rates and ultra-low realized vol — that do not describe the current regime. At 3.64% fed funds and ~22% realized vol on the Nasdaq-100, the structural drag on QLD is on the order of 9.6% per year; for TQQQ it pushes 23%. Long-horizon investors who want more equity beta are better served by raising the equity allocation directly through unleveraged broad-market funds, not by layering daily-reset leverage on a slice. Initially the editor expected the structural-drag estimate to come in around 6–7%; running the numbers at current rates and vol pushed it noticeably higher and tightened the conclusion.
The editor does not hold QLD, SSO, TQQQ, UPRO, or any other daily-reset leveraged ETF at the time of writing.
Key takeaways
- Daily-reset leveraged ETFs deliver 2x or 3x daily, not annual. The gap is set by realized volatility and financing cost — both of which have moved against the structure since 2022.
- QLD's total structural cost in May 2026 is roughly 9.6% per year (0.95% ER + ~3.6% financing + ~5.0% vol decay). That is the hurdle 2x exposure must clear before adding net value over QQQM.
- The full-sample track record is real but reflects an unusually favorable regime. Treating it as evidence of a durable structural advantage understates how much rates and vol have changed.
- For a long-horizon investor the cleaner way to get more equity beta is to hold more equities, not to layer daily-reset leverage on a slice.
- The framework applies to TQQQ, SSO, UPRO, SOXL, and similar products. Magnitudes differ; direction of conclusion does not.
Methodology
Fund-level fields (expense ratio, AUM, inception, NAV, dividend yield) and return/volatility/drawdown statistics sourced from yfinance, pulled 2026-05-16T13:19:18Z. CAGR, volatility, and max drawdown are computed on 5-year daily total-return series; QQQM has no 10-year history because its inception is October 2020. Expense ratios and AUM cross-checked against issuer fact sheets linked above. Macro inputs (fed funds, ten-year Treasury, VIX, CPI) sourced from FRED with as-of dates noted in body. Volatility-decay derivation uses the standard daily-rebalance compounding identity for k-times leverage; the formula k(k−1)σ²/2 is exact in the limit of continuous rebalancing and a close approximation for daily reset. The headline drag figure scales linearly with the σ² input, so readers using a different volatility assumption can recompute easily.
This article is for educational purposes and does not constitute personalized financial advice. See the full Disclaimer.