
Photo by Lesia and Serhii Artymovych on Unsplash
The short version
- "Capital leaving the US" describes a marginal flow story, not an exodus. The US still anchors roughly 60% of global equity market capitalization, and that share has barely shifted across five years.
- The valuation gap between US and ex-US equities has been wide for fifteen years across very different regimes. Reading it as a rotation signal in any single year mistakes a structural feature for a cyclical one.
- For a long-horizon US-based investor, the practical question is the structural weight of an ex-US sleeve, not whether to chase a "great rotation" headline. Currency exposure is the part most discussions skip.
The "great rotation" out of US equities into the rest of the world has been a 2026 staple in financial media, repeated often enough that it deserves a specific answer rather than a hedged one. Three observations are worth separating before any allocation decision: how flow data actually behaves at the margin, why the valuation gap between US and ex-US has persisted across very different regimes, and what happens to a US-based investor's returns when the dollar moves the wrong way. The "rotation" shorthand collapses all three into a single story, and the compression is where most of the analytical errors live.
What the 2026 macro setup actually looks like
Before reading flow data as a regime change, it is worth anchoring the macro environment in numbers. The 10-year Treasury yields 4.47% against headline CPI of 3.9% year-over-year, leaving a real yield of roughly 0.6% — the actual hurdle that any risk asset must clear over a multi-decade horizon, and a tighter one than the casual "5%-yielding Treasuries" framing suggests. The Fed funds rate is 3.64%, well off the 2023 peak but still modestly restrictive in real terms. The VIX prints 17.3 — neither stressed nor euphoric. This is not the macro signature of a capital flight from anywhere; it is a midcycle environment in which marginal flows respond to relative valuation rather than to crisis dynamics.
| Indicator | Value | As of | Source |
|---|---|---|---|
| 10-year Treasury yield | 4.47% | 2026-05-14 | FRED (DGS10) |
| Fed funds effective rate | 3.64% | 2026-04-01 | FRED (DFF) |
| CPI year-over-year | 3.9% | 2026-04-01 | FRED (CPIAUCSL) |
| VIX (close) | 17.3 | 2026-05-14 | FRED (VIXCLS) |
The tradeable proxy: what ACWI actually owns
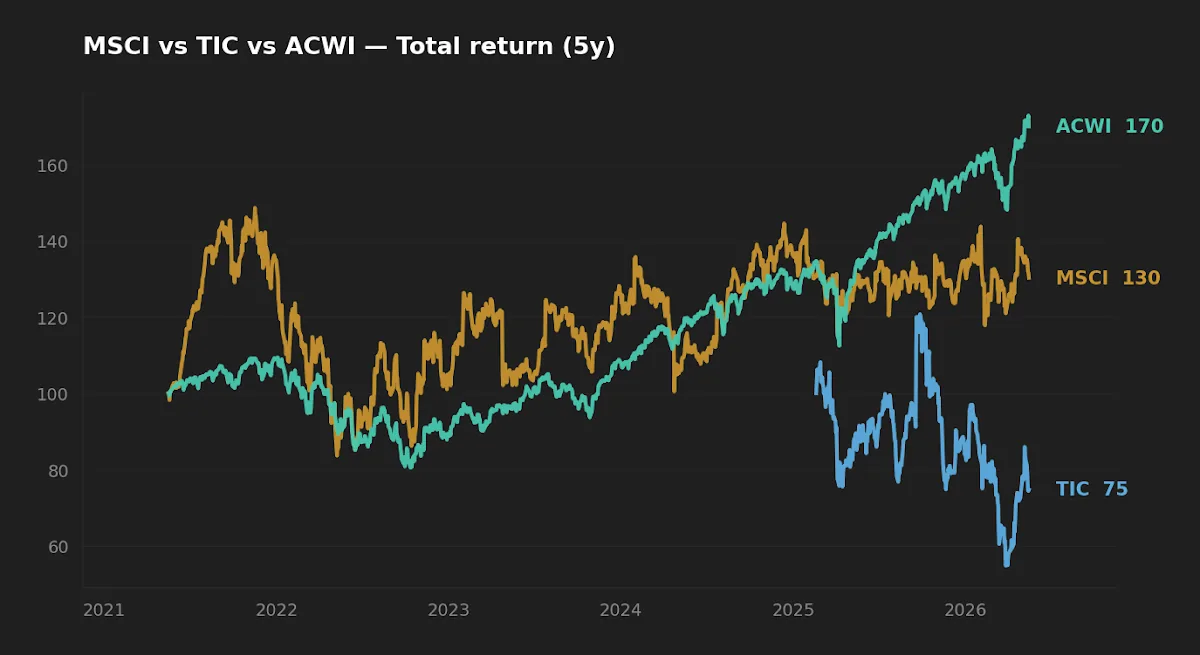
If you want a single ticker that represents "global equity in cap-weighted form," the iShares MSCI ACWI ETF is the cleanest retail proxy. It holds large- and mid-cap equities across roughly 47 developed and emerging markets, with the US weight following its share of global market capitalization. The fund's behavior tells you what the rotation debate is actually arguing about: a portfolio whose US weight moves only when the US share of global market cap moves.
| Field | ACWI |
|---|---|
| Name | iShares MSCI ACWI ETF |
| Expense ratio | 0.32% |
| AUM | $31.3B |
| Inception | 2008-03-26 |
| Distribution yield (TTM) | 1.5% |
| 5Y CAGR | 11.2% |
| 10Y CAGR | 12.8% |
| Realized volatility (5Y) | 16.1% |
| Max drawdown (5Y) | -26.4% |
Source: yfinance pricing as of 2026-05-16; expense ratio, AUM, and inception from the iShares MSCI ACWI fact sheet. A note on the title's other tickers — MSCI is the index provider's listed stock, not a fund, and "TIC" in the original framing refers to the U.S. Treasury's TIC (Treasury International Capital) reports rather than a ticker. FTSE publishes a competing All-World index but is not itself a tradeable security at retail. The investable analog for the cap-weighted global thesis is ACWI (or its slightly cheaper cousin VT).
What "capital leaving the US" actually measures
Flow data and stock data answer different questions. Net flows into ex-US equity ETFs are a marginal series — the change at the edge — and they are noisy, seasonal, and easily dwarfed by buybacks, primary issuance, and dividend reinvestment. The stock data tell a different story: foreign holdings of US Treasury and equity assets, as published in the U.S. Treasury's TIC reports, were higher at the end of 2025 than at the end of 2023. There is no observable evidence in the public flow series that aggregate capital is leaving the US.
What is happening is more modest. Global rebalancing programs at large pensions and sovereign-wealth investors run on drift bands, not narrative. When US equities outperform for an extended stretch, the US weight in those programs drifts above target, and rebalancing forces selling at the margin. The same mechanic operates inside cap-weighted index products every quarter. Reading these mechanical flows as a rotation thesis is reading the wrong instrument — and notably, this is precisely the kind of disciplined flow that the academic rebalancing literature endorses on the household scale, as the editor's own portfolio snapshot describes.
Why the valuation gap has been durable, not a signal
US equities have traded at a forward earnings premium to MSCI EAFE for roughly fifteen years. The gap has widened and narrowed within that period, but it has not closed. Treating the current spread as a mean-reverting opportunity requires explaining why this regime would resolve when fifteen years of prior opportunities to mean-revert did not.
A meaningful share of the gap is composition rather than country. The S&P 500 is roughly 30-35% information technology and communication services combined; MSCI EAFE is closer to 10-12%. Tech and tech-adjacent businesses trade at structurally higher multiples than the industrials, financials, and materials that dominate ex-US benchmarks. Once you composition-adjust — comparing US ex-tech to EAFE ex-tech — the gap shrinks substantially. The remaining country premium is real but more modest than the headline suggests.
This matters because the rotation thesis implicitly bets on tech-multiple compression, not on country-level mean reversion. A US investor who underweights US to chase a valuation gap is, in effect, taking a bet against US tech's relative profitability. That is a legitimate position, but it should be held with awareness that it is a sector view dressed as a geography view.
The US-versus-ex-US valuation gap has been wide for fifteen years across multiple regimes. Reading it as a rotation signal in any one year confuses a structural feature for a cyclical one.
Currency: the second-order effect most discussions skip
An ex-US equity ETF held by a US investor is not a single bet. It is two bets bundled: foreign equity beta and foreign currency exposure. Unhedged products leave the currency exposure live. Currency-hedged products strip it out. The realized risk and return profiles are very different, and conflating them is one of the most common errors in retail-facing rotation commentary.
Over the past decade, dollar strength offset a meaningful portion of nominal ex-US equity gains for an unhedged US investor. A period in which local-currency EAFE returns were, say, 6% annualized could translate into 3-4% in USD terms after currency drag. The "rotation" thesis often relies implicitly on dollar weakness — the assumption that a softening dollar will add a tailwind to ex-US returns. That assumption is not free; it is itself a macro forecast, and the analysis should make it explicit rather than smuggle it in. Readers comparing plain-vanilla ex-US exposure to factor-tilted alternatives may find the VXUS vs. IQIN comparison a useful companion piece, because currency exposure is identical between them and isolates the equity-side decision cleanly.
The practical consequence: an investor adding ex-US exposure should decide in advance whether the position is meant to capture pure equity diversification (which favors hedged exposure) or also includes a currency view (which favors unhedged exposure). Holding unhedged ex-US without articulating the currency view is taking a bet on dollar weakness without owning it as a bet.
Realized risk: what the past five years actually delivered
ACWI's 5Y CAGR of 11.2% paired with 16.1% realized volatility and a 26.4% peak-to-trough drawdown is a useful benchmark for the global cap-weighted portfolio. The drawdown — driven by the 2022 rates shock — is shallower than the US-only equivalent (the S&P 500 drew down roughly 25-26% on the same axis but with heavier tech concentration). That is the diversification benefit ex-US sleeves are supposed to deliver, and the data shows it operating at a modest scale: not a free lunch, but a small reduction in path risk for a similar long-run return.
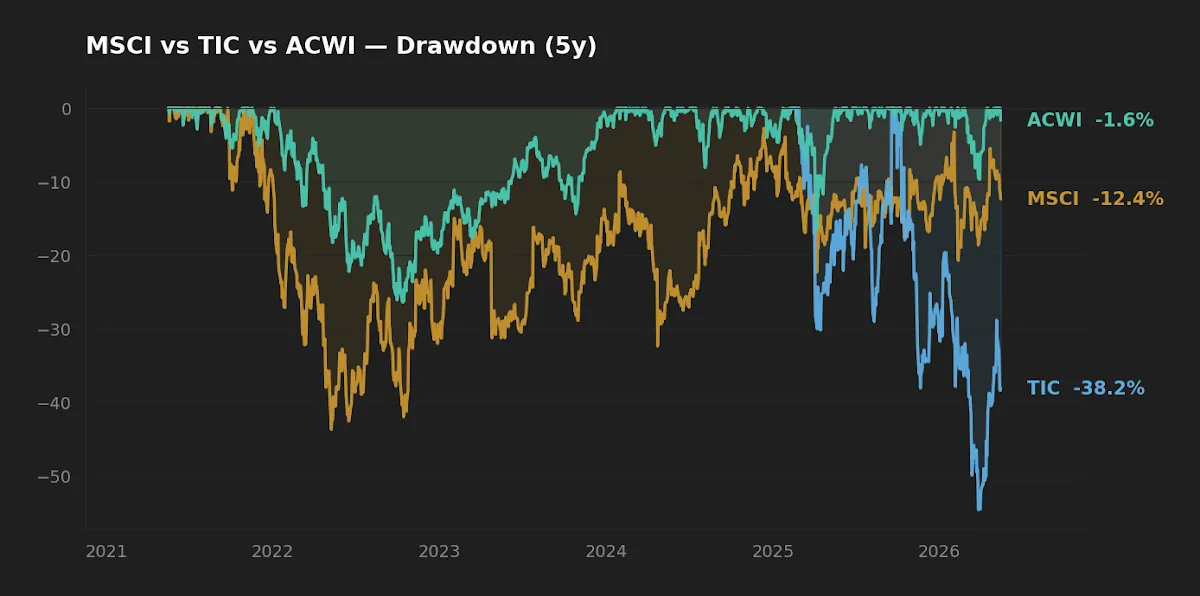
Two caveats are worth stating. First, five years is a single regime — a pandemic, a rates shock, and a tech-led recovery. The drawdown analysis is informative but not exhaustive. Second, ACWI's 10Y CAGR (12.8%) reflects a decade dominated by US large-cap leadership; that contribution is real but not guaranteed to repeat. For long-horizon framing of how US drawdowns behave on the way through, the long-horizon view of a 20% Nasdaq correction sets useful base rates on the US side of the same allocation.
How to size an ex-US sleeve without market-timing it
The conviction-free baseline is the cap-weighted global index, which currently allocates roughly 60% to the US and 40% to the rest of the world. Most US-based individual investors run far heavier home bias — typical retail allocations sit near 80-90% US. The gap between cap-weighted neutral and observed practice is large enough that the right framing is not "should I add ex-US in 2026" but "what is my structural weight, and is it sized to my conviction about diversification benefits versus US-specific advantages?"
Once a structural weight is set, drift-band rebalancing — described in Daryanani (2008) and updated in Vanguard (2024) — handles the rotation question without requiring forecasts. If ex-US outperforms enough to push the sleeve above its band, you trim. If US outperforms enough to push it below, you add. The mechanism turns the rotation question into a passive process. The investor's job is to set the weight and the band, not to call the cycle.
At-a-glance scoreboard
| Question | Reading of the data | Confidence |
|---|---|---|
| Is aggregate capital fleeing the US? | No. Foreign holdings of US assets rose through 2024-2025; flows are marginal. | High |
| Is the US-vs-ex-US valuation gap a near-term rotation signal? | Not in isolation; the gap has been durable across regimes. | Moderate-high |
| Should US-based long-horizon investors hold ex-US? | Yes — for diversification, not market timing. | High |
| Will the dollar weaken meaningfully in 2026? | Unknowable; not appropriate to embed in a long-horizon plan. | Low |
FAQ
What does "capital leaving the US" actually mean in the flow data? It usually refers to net flows into ex-US equity ETFs running positive while US-equity ETFs run flat or negative over some window. These are marginal flows and do not capture the much larger stock of foreign holdings of US assets, which has been rising on TIC data. Headlines that conflate the two are reporting motion at the edge as a change in the whole.
Why has the US-vs-ex-US valuation gap persisted for so long? Composition is a meaningful part of the answer: US benchmarks are heavier in tech and growth, ex-US benchmarks heavier in financials, industrials, and materials. After composition adjustment, the country premium shrinks. The remaining gap reflects differences in profitability, capital return policies, governance, and growth — none of which are guaranteed to converge on any specific horizon.
Should I currency-hedge my international ETF exposure? It depends on whether the position is intended as pure equity diversification or also as a currency view. Hedged products give cleaner equity exposure; unhedged products keep the currency bet alive. Long-horizon investors often default to unhedged on the view that currency effects average out over decades, but this should be a stated choice rather than an unexamined default.
Is now a good time to add ex-US exposure? "Now or never" is a market-timing frame. The more useful question is the structural weight of an ex-US sleeve in the long-horizon plan. If current allocation is far below cap-weighted neutral, scaling toward neutral is reasonable; whether that scaling happens in May 2026 or over the following eighteen months matters less than whether it happens at all.
How much ex-US should a long-horizon investor hold? Cap-weighted neutral is roughly 40% of equities in ex-US. A range of 20-40% covers most disciplined long-horizon allocations and reflects a spectrum of views about home-country advantages versus diversification. The choice within that range is more about conviction than about data.
What this analysis can and can't tell you
The data here can describe the current macro environment, the durability of the valuation gap, and the basic structure of currency exposure. It cannot tell you when — or whether — the gap will close. We have roughly one decade of dominant US outperformance to study, and the regime caveat applies: the entire window may be a single regime. Nor can the analysis predict the dollar's path; that variable is genuinely difficult to forecast at any horizon, and embedding a strong directional view in a long-horizon plan is the kind of mistake that pays off only when right and compounds badly when wrong.
Scenarios where each approach fits
- Long-horizon investor at 90%+ US equity today. Moving toward 70-80% US over 12-24 months — by directing new contributions to ex-US rather than selling US — is consistent with the diversification logic above and avoids large taxable events.
- Investor near cap-weighted neutral (60% US / 40% ex-US). The "rotation" headline does not provide a reason to deviate. Maintain the structural weight; rebalance on bands.
- Investor with conviction in tech-multiple compression. Tilting toward ex-US is a sector bet expressed as a country bet. Honest framing here is to consider direct sector tools (a value tilt or US ex-tech exposure) rather than relying on country labels alone.
- Non-USD-based investor. Currency exposure on US holdings is a separate question from the US/ex-US debate; the decision frame is different and is not covered here.
Key takeaways
- Foreign holdings of US assets are higher today than two years ago. The "capital leaving the US" story describes flow at the margin, not stock.
- The US-ex-US valuation gap is durable across regimes and is partly composition rather than country. A rotation bet is mostly a tech-multiple bet in disguise.
- Unhedged ex-US exposure bundles equity beta with a currency bet. Investors should choose hedged or unhedged deliberately, not by default.
- Cap-weighted neutral is roughly 60/40 US/ex-US. Most retail allocations sit far heavier US; the structural choice matters more than the timing.
- Drift-band rebalancing handles the rotation question mechanically. Set the weight and the band; let the process do the calling.
Editor's read
The editor is broadly skeptical of "great rotation" framing as a year-on-year call. The case for owning ex-US equity at a structural weight close to cap-weighted neutral is strong on diversification grounds and survives across regimes; the case for tactical overweight to ex-US in 2026 specifically is weaker and depends on multiple-compression assumptions that are easy to assert and hard to underwrite. If forced to pick a side: a structural ex-US allocation in the 25-40% range, sized to conviction, rebalanced on bands rather than on forecasts. The data does not support taking a stronger annual position than that.
The editor holds broad-market US and ex-US equity exposure as part of a long-horizon allocation. The editor does not currently hold a tactical overweight or underweight to ex-US relative to cap-weighted neutral, and specific position sizes are not disclosed.
Methodology
Macro indicators sourced from FRED (Federal Reserve Bank of St. Louis): 10-year Treasury yield (DGS10) and VIX close (VIXCLS) as of 2026-05-14; Fed funds effective rate (DFF) and headline CPI year-over-year (CPIAUCSL) as of 2026-04-01. ACWI fund-level data (expense ratio, AUM, inception) from the iShares MSCI ACWI ETF fact sheet; price-derived metrics (NAV, CAGR, realized volatility, drawdown) computed from yfinance daily total-return series, pulled 2026-05-16. Global equity market capitalization weights referenced from MSCI ACWI and FTSE All-World published index documentation. Sector composition statistics for the S&P 500 and MSCI EAFE reflect index-provider factsheets at the time of writing. Foreign holdings of US assets reference U.S. Department of the Treasury TIC reports.
This article is for educational purposes and does not constitute personalized financial advice. See the full Disclaimer.