
The short version
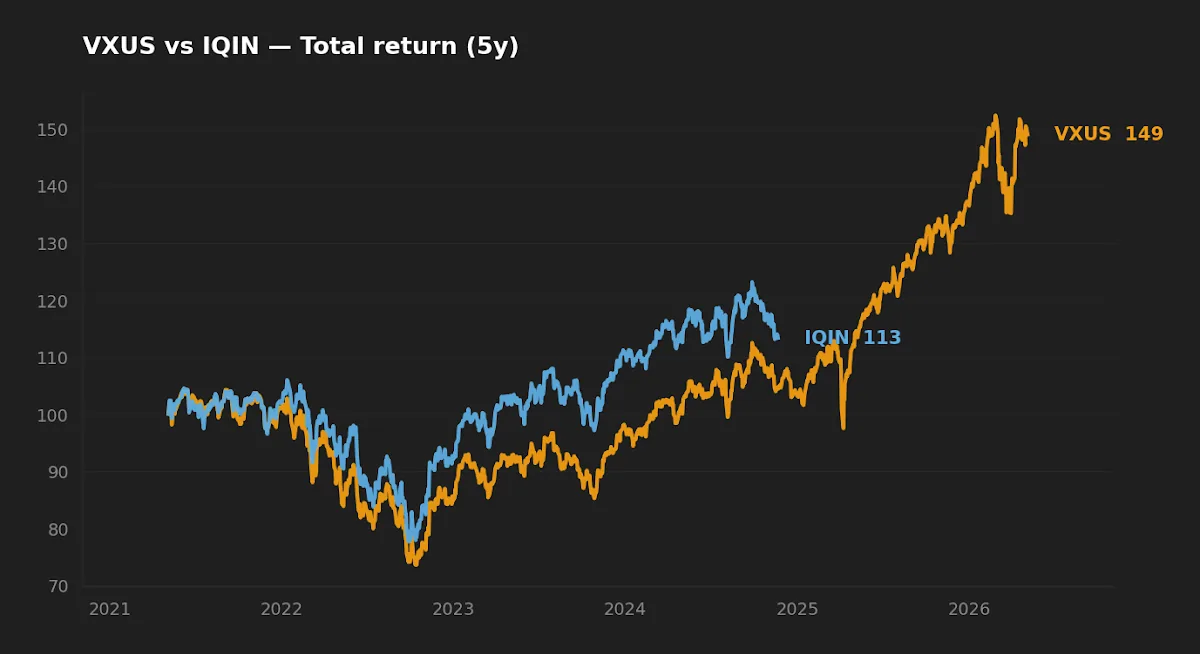
- Over the past five years, the "AI-driven" IQIN underperformed plain market-cap VXUS on every dimension we measured — lower CAGR, higher volatility, deeper drawdown — while charging five times the fee.
- IQIN's $99M AUM is a real capacity and closure-risk consideration that the marketing language doesn't surface; VXUS sits near $582B.
- For an investor who wants ex-US exposure as a long-term core holding, the burden of proof is on the active alternative, and the data hasn't carried it yet.
The interesting question with VXUS versus IQIN is not which one had a better 2024 quarter. It is whether the layer of active intelligence sitting on top of IQIN — what its issuer markets as a quantitative, factor-aware international strategy — has actually earned the 0.20% it charges on top of a plain market-cap index. Five years of live data is now available for both. The answer the data gives is uncomfortable for the "AI-driven" framing.
This piece compares Vanguard's Total International Stock ETF (VXUS) against the NYLI 500 International ETF (IQIN, issued by New York Life Investments) on cost, realized risk, realized return, capacity, and the structural questions a long-horizon investor should ask before paying up for any active wrapper.
Two very different ways to own non-US equities
VXUS is the broad-and-cheap option. It tracks the FTSE Global All Cap ex US Index, holds something on the order of 8,000+ securities across developed and emerging markets, and weights them by market capitalization. The fund has been live since January 2011, charges 0.05% per year, and currently manages roughly $582B (Vanguard fact sheet; yfinance, 2026-05-05). It is, in practice, the simplest way for a US-based investor to own the rest of the world's listed equity in proportion to how the world prices it.
IQIN is something different. It launched in December 2018 under the IQ ETFs brand (now NYLI), tracks the IQ 500 International Index, and selects roughly 500 large non-US companies using a fundamental scoring approach — sales, profits, and margins, rebalanced periodically. The marketing language frames this as a quantitative, even "AI-driven" approach to international allocation. The expense ratio is 0.25% and AUM is $99.2M (NYLI product page; yfinance, 2026-05-05).
The pitch is reasonable on paper: ex-US markets have higher information asymmetry than the US, so a rules-based fundamental screen might filter out structurally low-quality regions. The question is whether it has — and whether the implementation friction (fee, turnover, capacity) leaves enough alpha after costs to matter.
The numbers, side by side
| Metric | VXUS | IQIN |
|---|---|---|
| Issuer / Index | Vanguard / FTSE Global All Cap ex US | NYLI / IQ 500 International |
| Inception | 2011-01-26 | 2018-12-13 |
| Expense ratio | 0.05% | 0.25% |
| AUM | $582.3B | $99.2M |
| Distribution yield (TTM) | 3.0% | 4.2% |
| 5Y CAGR | 8.1% | 6.6% |
| 10Y CAGR | 9.1% | n/a (post-2018 inception) |
| 5Y annualized volatility | 16.0% | 20.1% |
| 5Y max drawdown | -29.4% | -35.9% |
Sources: yfinance (price/return/vol/drawdown), Vanguard VXUS fact sheet, NYLI IQIN product page. All figures as of 2026-05-05.
Cost: a 20 bp gap that compounds quietly
The fee gap looks small — 0.20% per year. It is not. Run a $50,000 allocation forward 25 years at a 7% gross compound rate and the fee differential alone removes roughly $9,000 of terminal value. That math doesn't depend on which fund "wins"; it shows up regardless. For a fund whose explicit job is to beat its passive equivalent, the active manager has to clear the fee hurdle before any of its skill becomes visible to the holder. Over the live window we have, IQIN has not.
This is the basic Sharpe (1991) arithmetic-of-active-management point: the average dollar in active management must, by identity, underperform the average dollar in indexing by the cost difference. Individual funds can buck this, but the prior should be skeptical, especially for funds with short live tracks.
Realized risk: more, not less
The original case for a fundamentally weighted international fund is that screening out low-quality regions should produce a smoother ride. The five-year data does not show that. IQIN's annualized volatility is 20.1% versus VXUS's 16.0%, and its peak-to-trough drawdown reached -35.9% against VXUS's -29.4% (yfinance, 2026-05-05). The "AI-driven" label, whatever sits behind it operationally, did not function as a downside dampener over the period that included the 2022 rate shock and the subsequent international rotation.
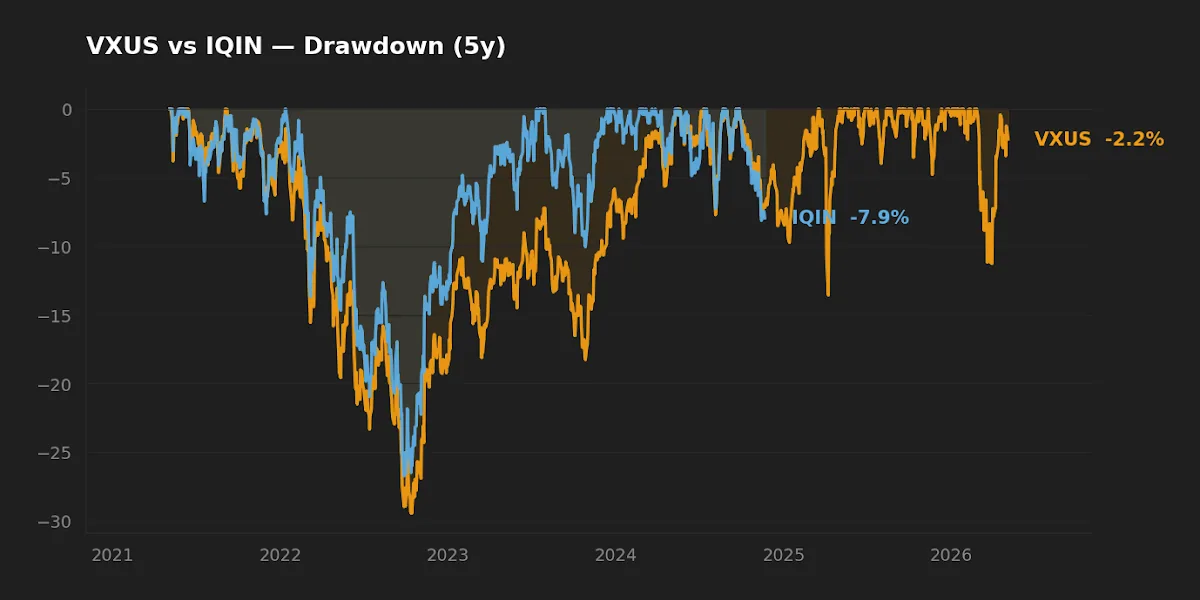
One reasonable explanation: by selecting roughly 500 names against VXUS's several thousand, IQIN concentrates idiosyncratic and country-level risk that broad cap weighting diversifies away. Concentration is a feature of any selective approach; the question is whether it pays. So far, in this fund, on this window, it has cost rather than paid.
The five-year data is not subtle: the AI-labeled wrapper produced lower return, higher volatility, and a deeper drawdown than the index it was meant to improve on, while charging five times the fee.
Capacity, AUM, and the unglamorous closure question
VXUS at $582B is in no danger of going anywhere. IQIN at $99M is in a different conversation. ETFs below ~$100M in AUM live in a closure-risk band that responsible due diligence has to acknowledge — issuers shut sub-scale funds when they stop being economic to run, and the holder eats the tax consequences of an involuntary liquidation in a taxable account. This is not a prediction that IQIN will close; it is a structural fact that shapes the asymmetry of the bet.
Bid-ask spreads also widen at small AUM and on less-liquid international holdings. For a buy-and-hold investor entering once and holding for decades the friction is bounded, but it is real, and it gets layered on top of the 0.20% fee gap rather than netted against it.
Yield, and what the macro tape is telling us
IQIN's distribution yield runs higher (4.2% TTM) than VXUS's (3.0%), reflecting its tilt toward larger, more profitable, often more mature non-US names. With the 10-year US Treasury at 4.4% and CPI YoY at 3.3% (FRED, asof 2026-05-01 and 2026-03-01 respectively), the real yield pickup IQIN offers over VXUS is modest and fully consumed by the higher fee and worse total return. An investor who specifically wants higher current ex-US dividend income has cleaner ways to get it (dedicated international dividend funds with longer tracks and lower fees) than via this particular wrapper.
For a longer treatment of why ex-US exposure still belongs in a US-resident's portfolio at all — independent of which vehicle delivers it — the prior piece Do You Really Need International Exposure? (VXUS Explained) walks through the home-bias argument. The companion VXUS vs VOO piece covers the US-vs-rest-of-world allocation choice itself.
The "AI-driven" label deserves its own paragraph
"AI-driven" is currently doing a lot of marketing work in the ETF industry. Most funds wearing the label are running quantitative factor screens — fundamentals, momentum, quality — with periodic rebalancing rules. That is a respectable thing to do. It is also what fundamentally weighted indexes have done for two decades, since well before the current LLM cycle. The relevant question for an investor is not whether a fund's process involves computation (all of them do) but whether the fund's live track record has shown skill that survives fees, turnover, and capacity. By that test, on its current five-year sample, IQIN has not. A related case is examined in QQQM vs QRFT; the broader principle is in Why Factor Investing Still Works.
What this comparison can and can't tell you
Five years is a single regime. It covers the COVID dislocation, the 2022 rate shock, and the partial 2023–2025 international rotation, but it does not cover a 2008-style global credit crisis or a multi-decade stagflation. IQIN simply has not lived through enough cycles for any verdict to be final. We also cannot decompose its returns into clean factor loadings without proprietary data; a Fama-French style regression on the live history would be informative, but the sample is short enough that confidence intervals would be wide.
What the data can tell us is the cumulative, after-fee, realized experience of a holder who bought either fund five years ago and held. On that question — which is the question that matters to a long-term investor — VXUS won on every dimension we measured.
Scenarios where each fund fits
- Long-term core ex-US allocation, taxable or tax-advantaged: VXUS is the default. Lowest fee in its category, broadest diversification, highest AUM, longest track record.
- Investor specifically seeking concentrated, fundamentally screened large-cap international exposure as a small satellite tilt: IQIN can be considered, but the case has to be made on conviction in the methodology rather than on the realized track record, which currently argues against it. Position sizing should reflect that.
- Investor in a closure-sensitive taxable account: avoid ETFs below ~$200M AUM as a long-term core unless the issuer has a clear commitment to scale. IQIN doesn't currently meet that bar.
- Investor whose primary goal is higher international dividend income: neither of these is the optimal vehicle. A dedicated international dividend ETF with longer history and lower fee will serve better.
At-a-glance scoreboard
| Category | Winner | Margin |
|---|---|---|
| Cost | VXUS | Material — 20 bp/yr |
| Realized risk (5Y vol & drawdown) | VXUS | Clear — 410 bp lower vol, 650 bp shallower MDD |
| Realized return (5Y CAGR) | VXUS | Material — 150 bp/yr |
| AUM scale & closure risk | VXUS | Decisive |
| Distribution yield | IQIN | 120 bp, but consumed by total-return gap |
| Suitability for long-term core | VXUS | Strong |
Editor's read
If forced to pick one for the ex-US sleeve of a long-horizon portfolio, the editor leans clearly toward VXUS. The fee gap, the realized return gap, the realized risk gap, and the capacity gap all point the same direction, and the "AI-driven" framing of the alternative has not earned the trust the marketing language asks for. IQIN may yet show something interesting over a longer cycle — its current sample is short — but the burden of proof sits on the active wrapper, and at present the evidence does not carry it.
The editor holds VXUS as part of a long-term core international allocation; does not hold IQIN at the time of writing.
FAQ
Is IQIN actually using AI in any meaningful sense?
The fund tracks a rules-based fundamental index that screens and weights non-US large caps using sales, earnings, and margin metrics. Whether one calls that "AI" is largely marketing taxonomy. It is a quantitative, periodically rebalanced approach — a respectable category, but not a magic one, and the live track record is what matters.
Why does VXUS hold so many more stocks than IQIN?
VXUS holds the entire investable ex-US market by capitalization (developed + emerging, all caps); IQIN selects roughly 500 large companies that pass its fundamental screen. The diversification difference is structural, not incidental.
Could IQIN's higher dividend yield make up for its lower total return in a taxable account?
No. Total return already includes reinvested dividends. A higher distribution yield in a taxable account is generally a tax disadvantage, not an advantage, because it pulls forward the tax liability. The 4.2% versus 3.0% distribution gap does not reverse the 8.1% versus 6.6% total-return gap.
What is the closure-risk threshold for ETFs?
There is no industry-fixed line, but funds below roughly $50M of AUM are at meaningful closure risk; $50M–$100M is a watch zone. IQIN at $99M sits in the watch zone. This is not a forecast of closure — it is a base-rate consideration that should affect position sizing in a taxable account.
Should an investor wait longer to judge IQIN, given how short its track is?
Reasonable position. Five years includes only one major risk-off regime. A skeptical investor's right move is usually to wait for a longer record at the existing fee — not to pay up for the methodology on faith.
Key takeaways
- VXUS at 0.05% delivered 8.1% 5Y CAGR with 16.0% volatility and a -29.4% max drawdown.
- IQIN at 0.25% delivered 6.6% 5Y CAGR with 20.1% volatility and a -35.9% max drawdown.
- The five-year evidence does not support paying the 20 bp premium for the "AI-driven" label as currently implemented in this fund.
- IQIN's $99M AUM is a real, structural consideration for taxable-account holders, separate from performance.
- For a long-term ex-US core allocation, the default should be the broadest, cheapest, largest fund unless the active alternative has earned its premium. IQIN, on this window, has not.
Methodology
Price, return, volatility, and drawdown statistics were computed from yfinance daily total-return data through 2026-05-05. Expense ratios, AUM, distribution yields, and inception dates were cross-checked against the Vanguard VXUS fact sheet and the NYLI IQIN product page. Macro context (10-year Treasury yield, CPI YoY) was pulled from FRED with the as-of dates noted inline. The 5Y CAGR is the geometric annualized total return over the trailing five years; max drawdown is the largest peak-to-trough decline of cumulative total return over the same window. No proprietary factor decomposition was performed — the live sample is too short for those estimates to be precise.
By the Mulden editor. About.
This article is for educational purposes and does not constitute personalized financial advice. See Disclaimer.